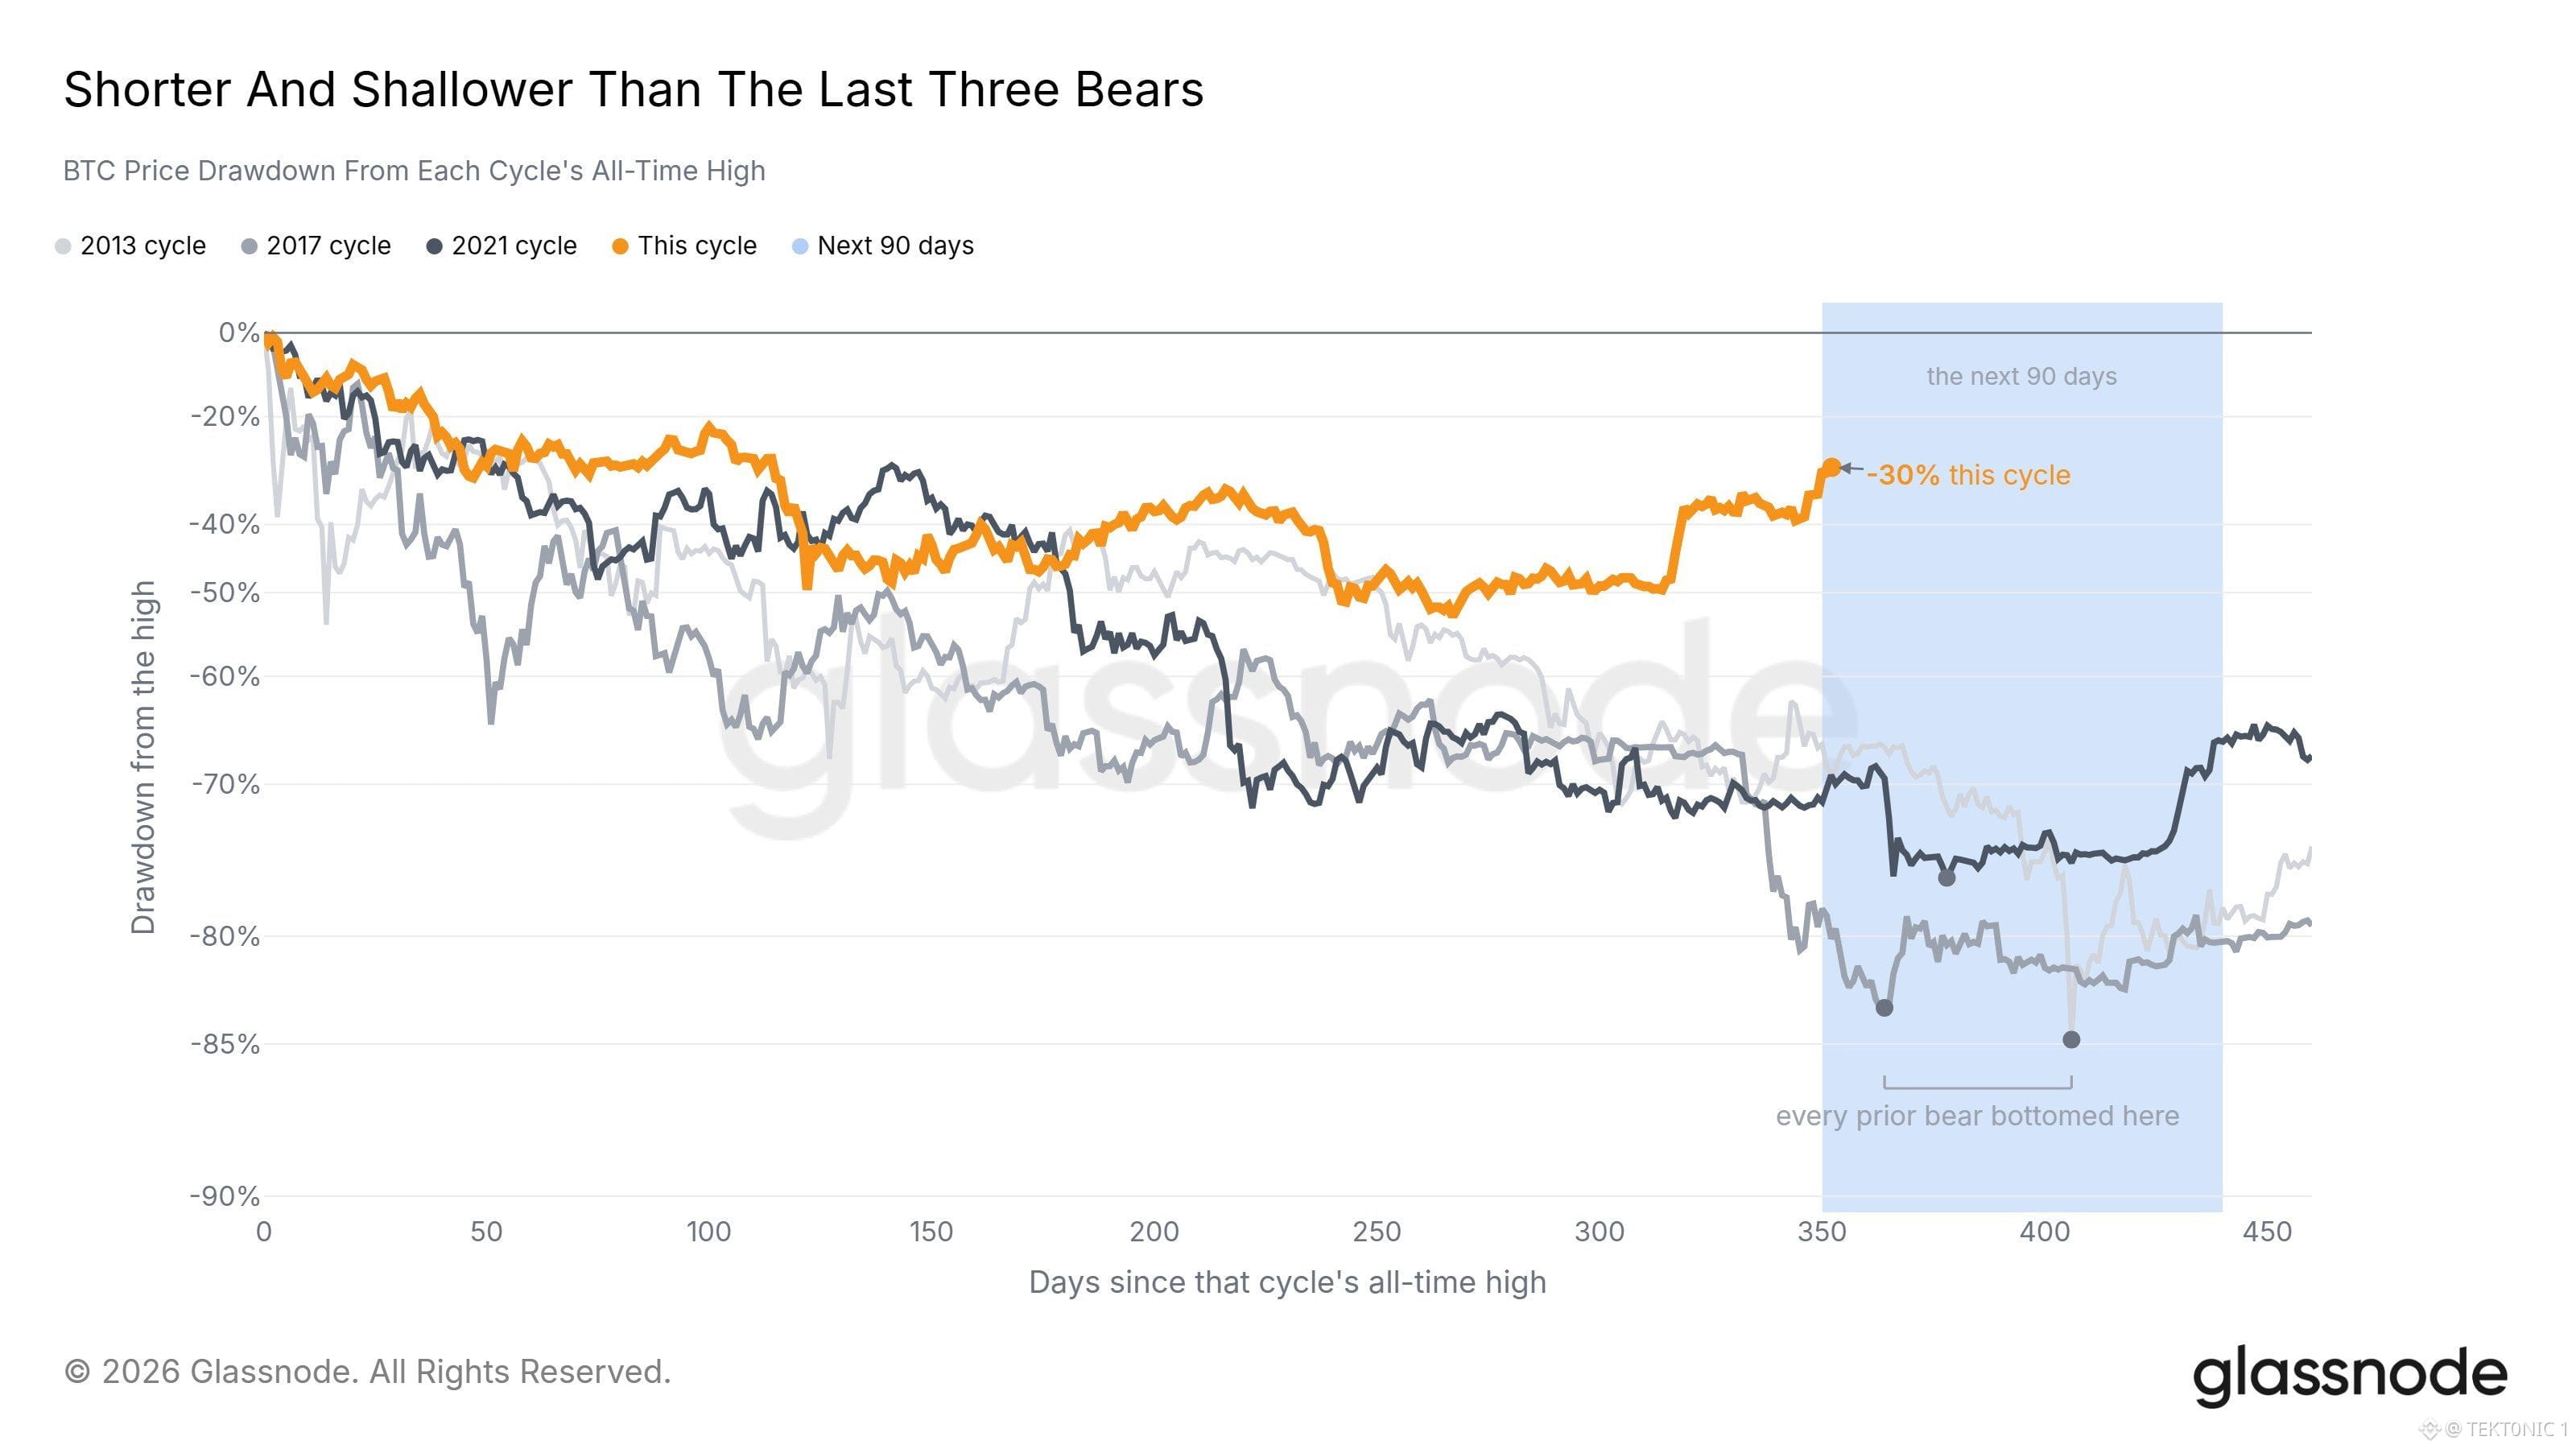
this $BTC drawdown is shorter and shallower than the last three bears. Glassnode tracks each cycle as a percentage drop from that cycle’s all-time high. this cycle, marked in orange, is about 350 days after the October 2025 peak near $126,000. price is only about 30% below that high after the rebound to $87,000. the 2013, 2017 and 2021 cycles were already down 70% to 85% at the same point on the clock. their cycle lows also printed inside the following 90 days, the window Glassnode highlights on the chart. that is why the usual four-year bear script has not played out. those earlier bears still had a deep washout left. this one is 30% off the high and moving back up, with spot holding above the true market mean at $76,746. a late drop all the way to those old depths looks less likely the longer $87,000 holds. the 90-day window is still open, so the comparison is not finished. $82,000 remains the first support on this rebound. $BTC hold it and this cycle stays the shallow one. lose it and the chart starts looking more like the last three. #BTC Price Analysis# #Bitcoin Price Prediction: What is Bitcoins next move?# $XRP


Posting