LIGHT ANALYSIS / CHART SETUP — SOL/USDT
📈 Structure Overview
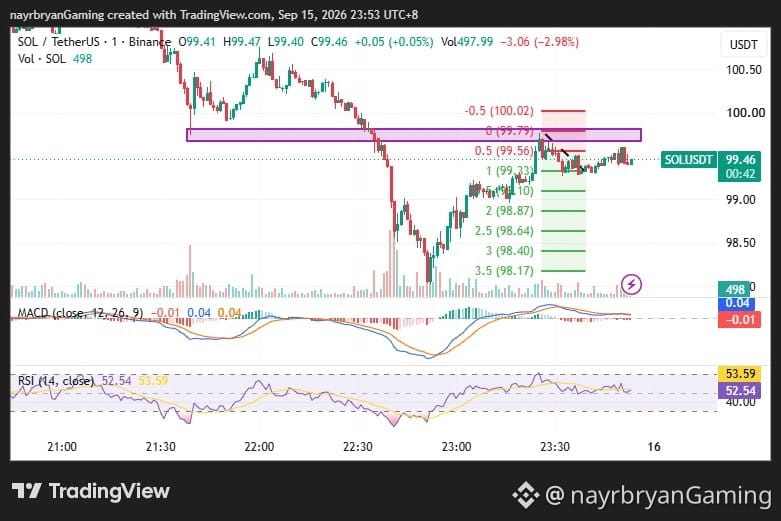
Market phase: Sharp sell-off → recovery → resistance consolidation
Major resistance zone: ~99.55–99.80
Descending trendline: Overhead resistance
Current price: ~99.44
Fib downside mapped toward: 98.17
📌 What I’m Watching
Scenario A — Bearish Continuation (Educational)
If SOL remains below the purple resistance zone and fails to reclaim the descending trendline, price may rotate lower toward:
99.33 → 99.10 → 98.87 → 98.64 → 98.40 → 98.17
The 99.56–99.79 area remains the key rejection region.
Scenario B — Bearish Invalidation (Educational)
If SOL breaks and holds above 100.03, the short-side structure shown on the chart becomes invalid. A sustained reclaim above the descending trendline would weaken the bearish setup and could signal a broader recovery.
Note:
This is a chart framework, not a trade recommendation. Use it to support your own DYOR-based execution plan.
— @nayrbryanGaming #SOLAnalysis #ChartSetup #SmartMoney #DYOR 🔔 Follow for professional chart breakdowns.
📈 Structure Overview
Market phase: Sharp sell-off → recovery → resistance consolidation
Major resistance zone: ~99.55–99.80
Descending trendline: Overhead resistance
Current price: ~99.44
Fib downside mapped toward: 98.17
📌 What I’m Watching
Scenario A — Bearish Continuation (Educational)
If SOL remains below the purple resistance zone and fails to reclaim the descending trendline, price may rotate lower toward:
99.33 → 99.10 → 98.87 → 98.64 → 98.40 → 98.17
The 99.56–99.79 area remains the key rejection region.
Scenario B — Bearish Invalidation (Educational)
If SOL breaks and holds above 100.03, the short-side structure shown on the chart becomes invalid. A sustained reclaim above the descending trendline would weaken the bearish setup and could signal a broader recovery.
Note:
This is a chart framework, not a trade recommendation. Use it to support your own DYOR-based execution plan.
— @nayrbryanGaming #SOLAnalysis #ChartSetup #SmartMoney #DYOR 🔔 Follow for professional chart breakdowns.