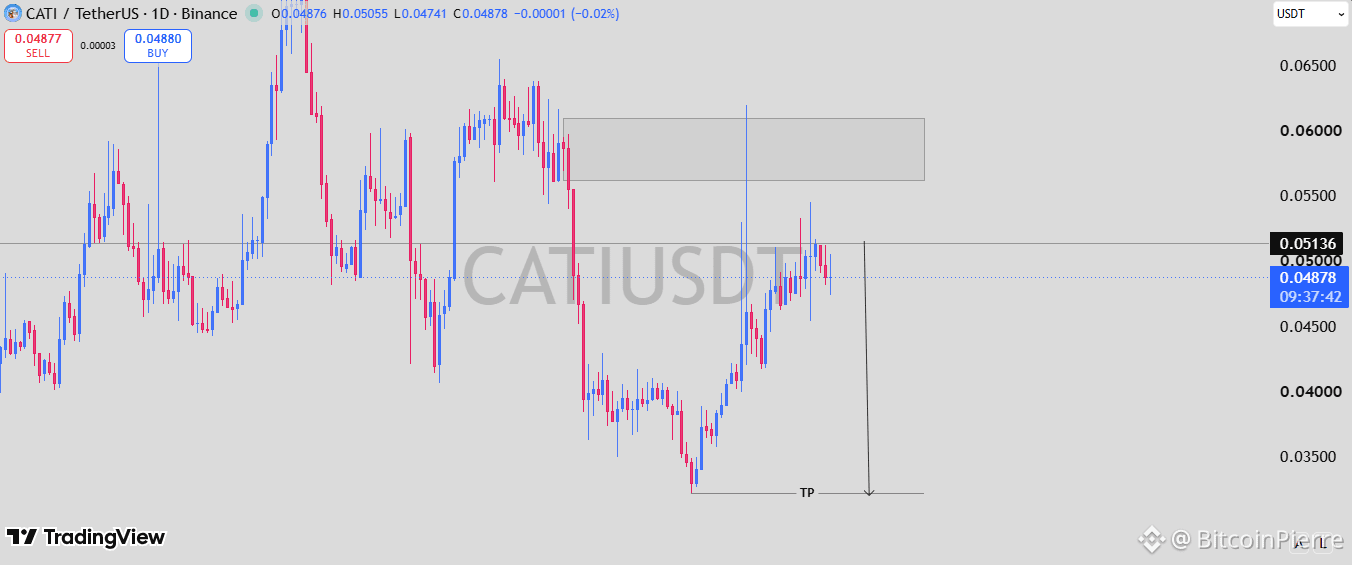
The current $CATI /USDT 1D chart is showing a potentially important bearish setup as price approaches a clearly defined resistance area. CATI is trading around $0.04878 after recovering from the $0.034–$0.035 region, but this recovery is now running into resistance around $0.0500–$0.0514. The reaction from this level will be critical because price has previously struggled around this area, and the current structure suggests the rebound could be losing momentum. Above the current price, there is a larger supply zone around $0.056–$0.061, which represents another major area where sellers could become active if CATI manages to push higher. However, the chart projection is currently pointing toward rejection from the $0.050–$0.0514 region rather than a sustained breakout. If sellers defend this resistance and CATI starts forming lower highs on the daily timeframe, downside momentum could accelerate. The projected target on the chart sits around $0.032–$0.033, close to the previous major low. That makes the current resistance zone extremely important. A decisive daily breakout and acceptance above $0.0514 would weaken the immediate bearish thesis, while continued rejection below that level keeps the downside projection valid. #BTC Price Analysis# #Meme Alpha#

Posting