


Oracle Stock enters this session in an awkward position. The daily chart remains structurally damaged, yet short-term tape is building a floor. ORCL closed at 145.48 after a wide reversal from 151.99. The bias stays bearish on structure and neutral on momentum.
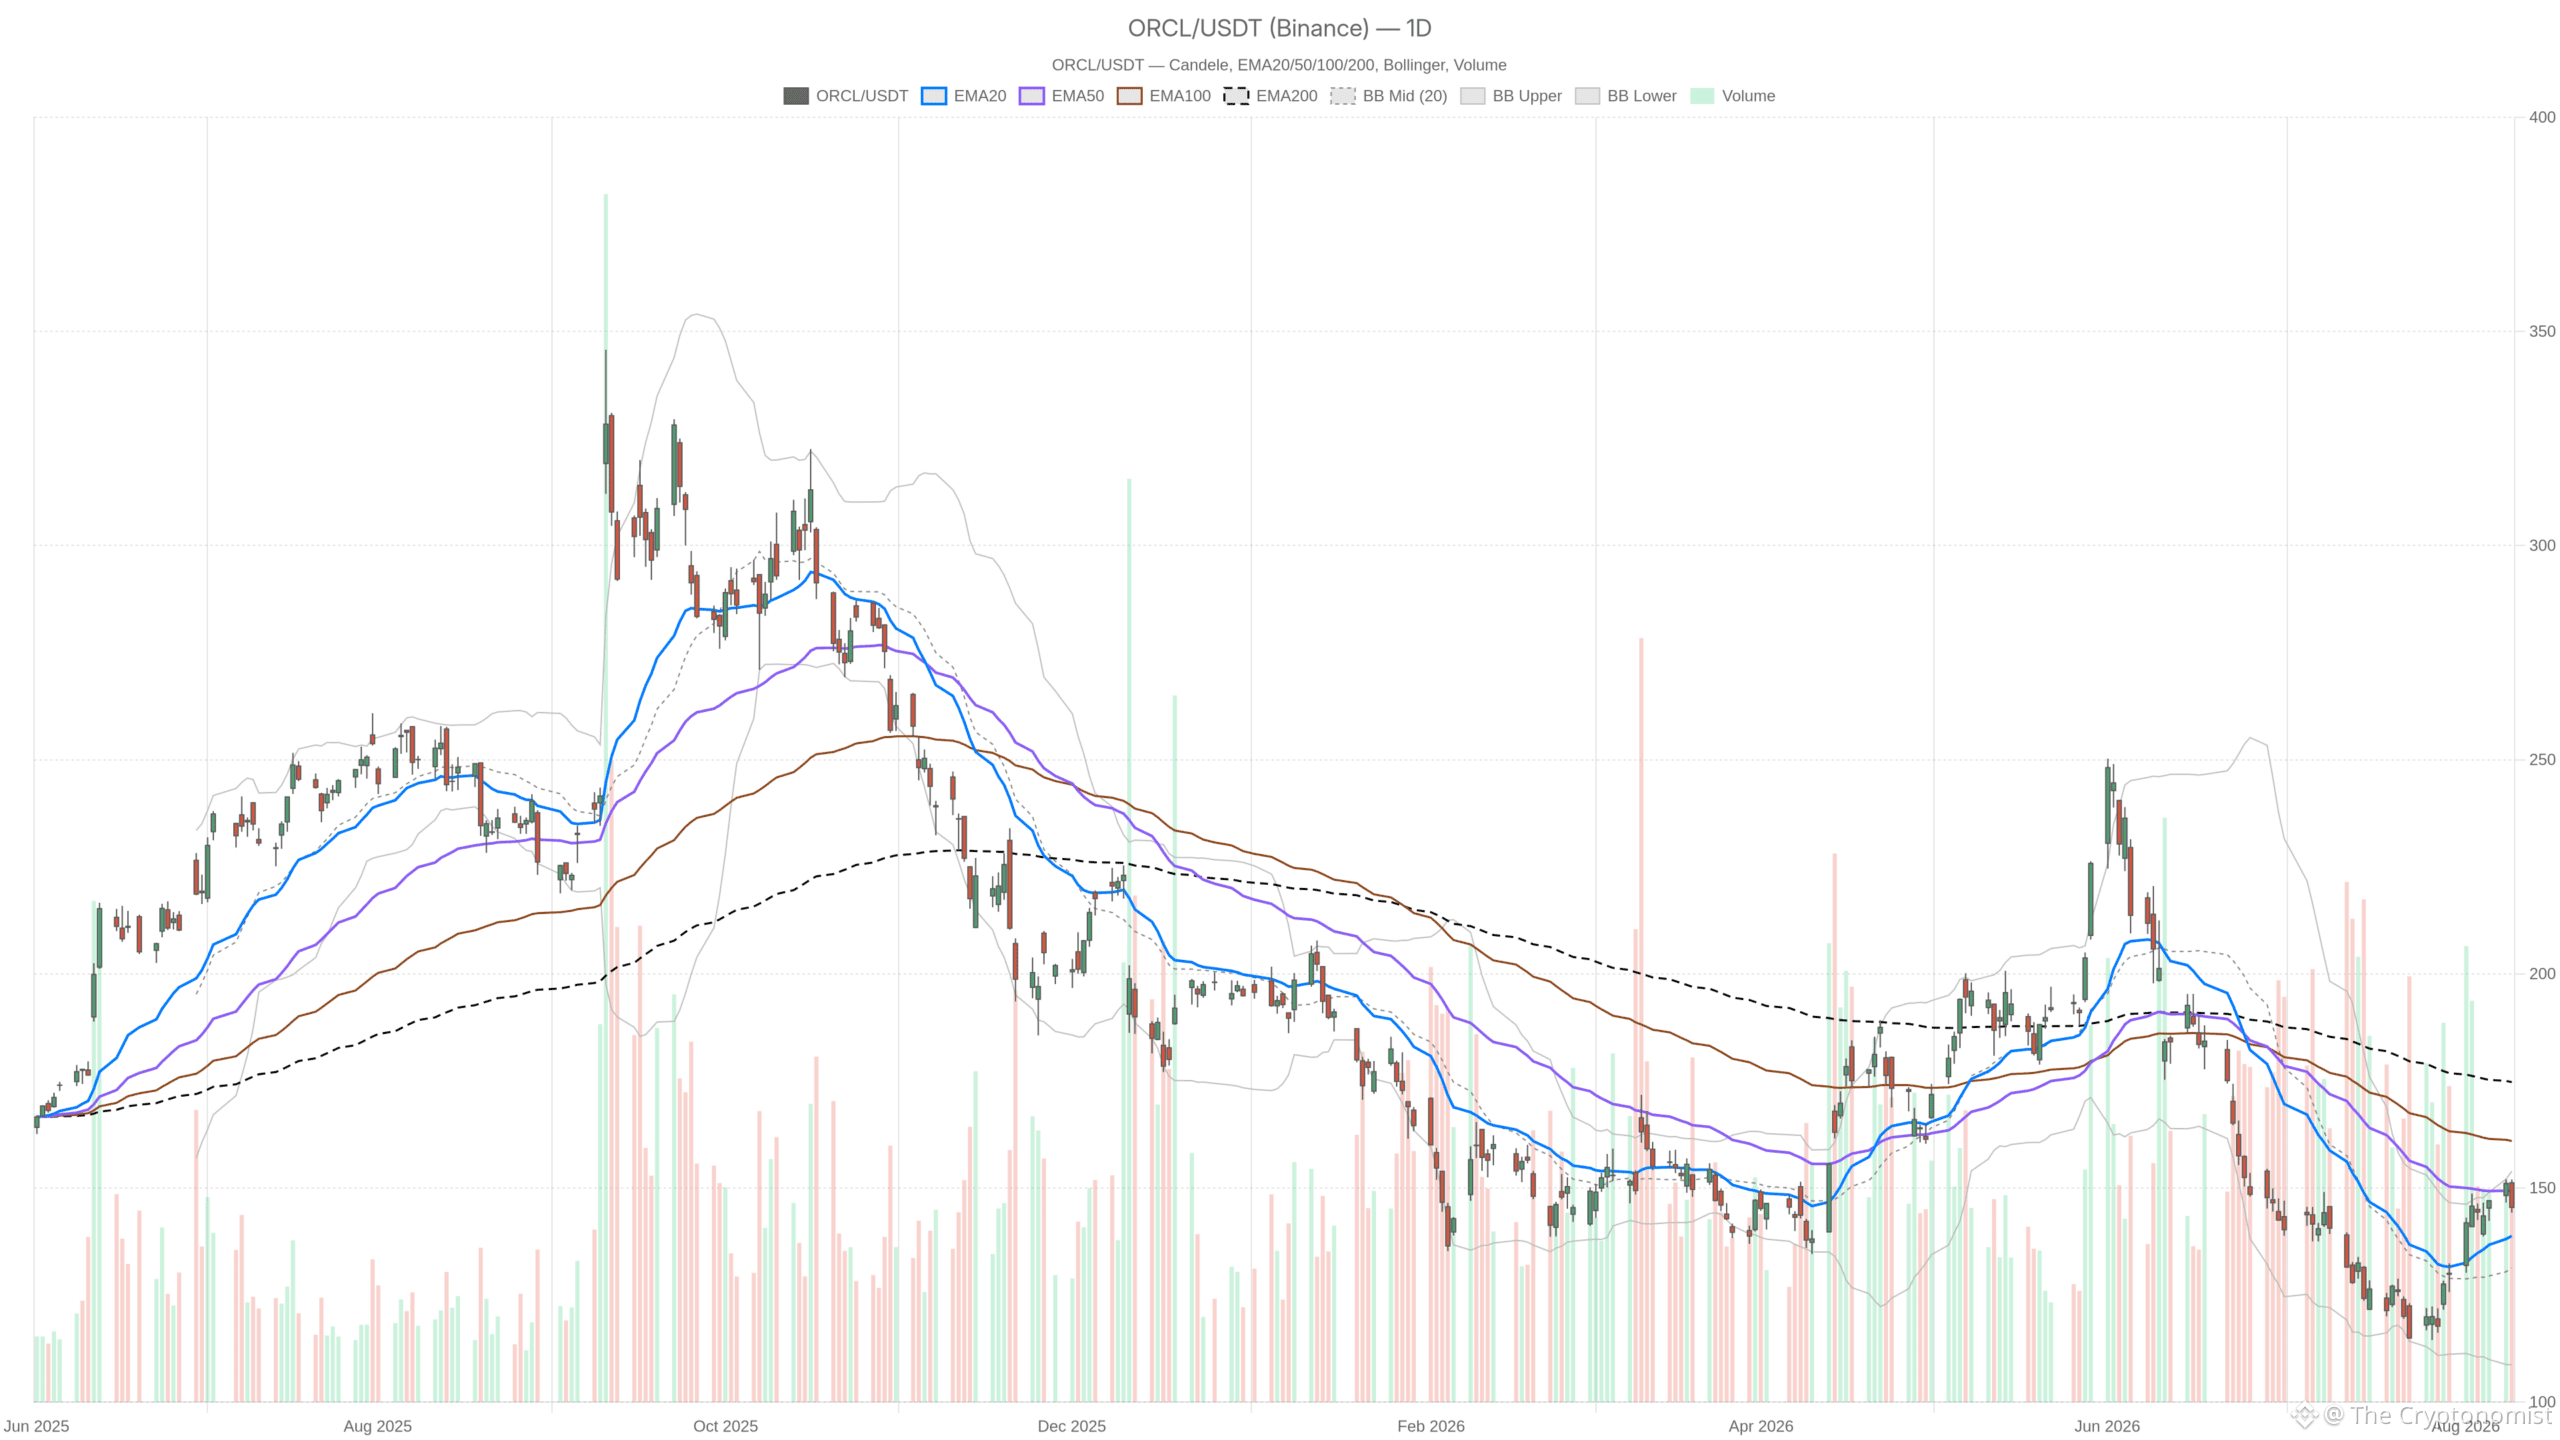 ORCL — daily chart with candlesticks, EMA20/EMA50 and volume.
Key takeaways
ORCL closed at 145.48 after rejecting the 50-day EMA near 152, confirming sellers defend that zone.
Daily RSI at 54.12 has recovered above the midline, but signals repair rather than genuine demand.
A fresh 52-week low follows a 57% decline over ten months, with AI infrastructure debt compounding the pressure.
Daily ATR at 7.37 implies routine swings of roughly 5%, making position sizing critical.
The July CPI release at 8:30 a.m. ET adds event risk to an already compressed intraday tape.
Oracle Stock daily structure: a bounce inside a broken trend
Oracle Stock’s daily chart shows a short-term bounce unfolding within a structurally broken downtrend. The 50-day EMA at 149.21 caps upside, while the 200-day EMA at 174.71 sits far overhead. This is a recovery attempt inside a bearish structure, not a trend change.
The context reinforces the caution. Reports flag a fresh 52-week low after a 57% drop over ten months. Meanwhile, the AI backlog keeps expanding. Oracle is said to be preparing new layoffs this month. Billions in AI infrastructure debt sit in the background. NVIDIA’s $500 billion funding plan has rewarded neocloud names and punished Oracle. Even TikTok headlines failed to lift the tape. Overall, the narrative is not helping buyers.
Momentum repair without strength
Price at 145.48 sits well above the 20-day EMA at 138.80. That confirms a short-term recovery attempt is genuinely underway. However, the 50-day EMA at 149.21 caps the move from above. The session high of 151.99 was rejected right through that zone. The 200-day EMA at 174.71 remains far overhead.
Momentum tells a similar story of repair rather than strength. Daily RSI at 54.12 has climbed back above the midline. This removes oversold pressure without signalling real demand. The MACD line at -0.55 still trades below zero. However, the histogram at +4.46 against a signal line of -5.02 shows selling pressure fading quickly. Notably, that combination usually marks the recovery phase after capitulation, not the start of a fresh advance.
Volatility and pivot levels
Volatility is the dominant variable here. The daily Bollinger bands run from 108.74 to 153.91 with a midline at 131.32. That is an extraordinarily wide envelope, and price now trades in the upper portion of it. ATR at 7.37 implies routine daily swings of roughly five percent of the share price. Consequently, position sizing matters more than direction in the near term.
The daily pivot structure frames the battle neatly. The pivot sits at 147.24, resistance at 150.23 and support at 142.48. Yesterday’s close below the pivot leaves sellers with the marginal edge. A daily close back above 147.24 would be the first genuine sign that the bounce still has legs.
The 1H chart weakens the recovery case
The hourly picture complicates the constructive read on Oracle Stock. ORCL at 145.43 trades below its 1H EMA20 at 146.37, yet remains above the EMA50 at 142.95 and the EMA200 at 141.54. That is a stalling market rather than a collapsing one. Short-term buyers have lost control of the immediate trend. However, the medium-term hourly base is still intact.
Momentum on this timeframe is rolling over. The 1H MACD line at 0.42 sits below its signal at 1.19, with the histogram negative at -0.77. RSI at 48.33 has slipped under the midline. Therefore, the impulse that carried price toward 152 has clearly exhausted itself.
Price is also trading below the 1H Bollinger midline at 147.22, with bands at 152.42 and 142.01. That places the market in the lower half of its hourly range. ATR at 2.05 shows hourly candles remain large by normal standards. The hourly pivot at 145.27 is effectively where price closed, with 146.08 above and 144.61 below. In short, the market is balanced on a knife edge, and the burden of proof sits with buyers.
15m execution context: compression before CPI
On the 15-minute chart, Oracle Stock shows compression, not direction. Bollinger bands have narrowed dramatically, running only from 144.37 to 145.52 around a midline of 144.95. ATR at 0.53 confirms that intraday ranges have collapsed. Price at 145.43 is pinned against the EMA20 at 145.48, below the EMA50 at 146.37 and above the EMA200 at 142.14.
Momentum here is quietly improving. The 15m MACD histogram has turned positive at +0.21 while RSI sits at 46.13. That mix suggests a market coiling rather than trending. With the July consumer price index due at 8:30 a.m. ET, this compression looks like pre-event positioning. Consequently, breakout attempts before the data carry a higher false-signal risk than usual.
Bullish scenario for Oracle Stock
The constructive case rests on fading daily selling pressure. Bulls need to reclaim the daily pivot at 147.24 and then push through the 1H Bollinger midline at 147.22. Above that, the 50-day EMA at 149.21 and daily R1 at 150.23 become the real test. A decisive break of 151.99 would open the daily upper band at 153.91.
Support for that path would come from a positive hourly MACD crossover. RSI would need to recover back above 50 on both intraday timeframes. Sustained trade above the 15m EMA50 at 146.37 would be the earliest tactical confirmation. Fundamentally, the expanding AI backlog remains the strongest argument for buyers willing to fight the trend.
Bearish scenario for Oracle Stock
The bearish case is simpler and structurally cleaner. ORCL trades roughly 29 points below its 200-day EMA and has just registered a fresh 52-week low. Rejection from the 149–152 area already confirms sellers are defending the 50-day EMA. A loss of daily S1 at 142.48 would invalidate the bounce thesis outright.
Below that level, the 1H EMA200 at 141.54 becomes the last meaningful intraday floor. A break there would re-expose the lower half of the enormous daily Bollinger range. At the same time, the news flow leans in this direction. Layoff preparations, heavy AI infrastructure debt and NVIDIA’s capital rotating toward competitors all reinforce the downside narrative.
Positioning, volatility and what remains unresolved
The timeframes genuinely disagree, and that must be acknowledged. The daily chart shows momentum repair inside a broken trend. The hourly chart shows that repair losing traction. The 15-minute chart shows a market waiting for a catalyst. Signals are mixed. Oracle Stock is therefore best read as a volatile, range-bound instrument until 147.24 or 142.48 breaks on a closing basis.
Volatility is the real risk here, not direction. A daily ATR above seven points means stops placed on intraday logic will be tested routinely. With CPI due and the AI capital-allocation debate unresolved, the probability of sharp two-way movement is elevated. Patience until levels resolve looks more defensible than anticipating the break.
FAQ
Is Oracle Stock in a downtrend or a recovery?
Oracle Stock remains in a structurally broken downtrend on the daily chart. Price has bounced above the 20-day EMA at 138.80 and RSI has recovered to 54.12. However, the 50-day EMA at 149.21 caps upside and the 200-day EMA at 174.71 sits far overhead. This is a bounce inside a downtrend, not a trend change.
What are the key levels to watch for Oracle Stock?
The daily pivot at 147.24 is the near-term bull/bear line. A close above it signals the bounce has legs. Daily S1 at 142.48 is the critical downside level—a break there invalidates the bounce thesis. On the upside, 149.21 and 151.99 are the main resistance zones.
How does the CPI release affect Oracle Stock?
The July CPI release at 8:30 a.m. ET adds significant event risk. The 15-minute chart shows extreme compression ahead of the data, with Bollinger bands narrowed dramatically. Breakout attempts before CPI carry a higher false-signal risk than usual.
What is driving the bearish pressure on Oracle Stock?
Several factors weigh on Oracle Stock: a fresh 52-week low after a 57% decline, upcoming layoffs, heavy AI infrastructure debt, and NVIDIA’s capital rotating toward competitors. The expanding AI backlog remains the main bullish counterargument.
Disclaimer: This article is for informational purposes only and does not constitute financial advice, an investment recommendation, or a solicitation to buy or sell any financial instrument or cryptocurrency. The analysis provided is not indicative of future results. Investing in crypto assets and financial markets carries a high risk of capital loss. Always do your own research (DYOR) and consult a qualified financial advisor before making any decision.
Article produced with the assistance of artificial intelligence and reviewed by the editorial team.