

Qaiser Mehmood Sheikh
6 Publications

Qaiser Mehmood Sheikh
Signaler
Bloquer l’utilisateur
Ouvert au trading
2.2 mois
2 Suivis
0 Abonnés
0 J’aime
Publications
Portefeuille
#dusk $DUSK @Dusk_Foundation
Le point central de @Dusk_Foundation est de construire une puissante couche d’exécution financière qui associe de manière transparente une conformité de niveau institutionnel à une confidentialité préservée par la cryptographie à divulgation nulle de connaissance. En permettant des contrats intelligents confidentiels, $DUSK fournit l’infrastructure essentielle nécessaire pour les actifs financiers réglementés et des règlements sécurisés en chaîne. Un immense pas en avant pour une finance axée sur la confidentialité ! #dusk
#dusk $DUSK @Dusk
Le point central de @Dusk est de construire une puissante couche d’exécution financière qui associe de manière transparente une conformité de niveau institutionnel à une confidentialité préservée par la cryptographie à divulgation nulle de connaissance. En permettant des contrats intelligents confidentiels, $DUSK fournit l’infrastructure essentielle nécessaire pour les actifs financiers réglementés et des règlements sécurisés en chaîne. Un immense pas en avant pour une finance axée sur la confidentialité ! #dusk
Le point central de @Dusk est de construire une puissante couche d’exécution financière qui associe de manière transparente une conformité de niveau institutionnel à une confidentialité préservée par la cryptographie à divulgation nulle de connaissance. En permettant des contrats intelligents confidentiels, $DUSK fournit l’infrastructure essentielle nécessaire pour les actifs financiers réglementés et des règlements sécurisés en chaîne. Un immense pas en avant pour une finance axée sur la confidentialité ! #dusk
63
Article
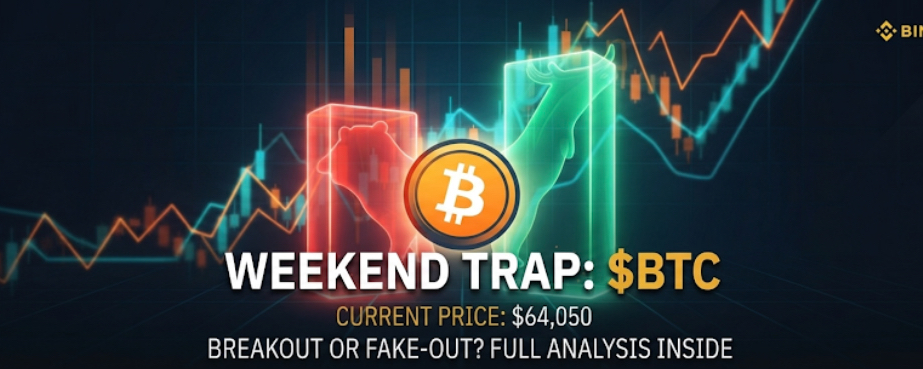
Le piège du week-end : est-ce que le $BTC va éclater à la hausse… ou nous tromper ? 📉 📈Bonjour la famille de Binance Square ! Alors que nous entrons dans le week-end, la volatilité se resserre partout, et $BITCOIN se trouve pile à un point de décision majeur près de 64 050 $.
Le volume se calme, ce qui signifie généralement une chose : un mouvement brusque arrive. Voici comment je joue la structure de marché actuelle :
Le scénario haussier : si les haussiers parviennent à défendre la zone de support 63 500 $ – 64 000 $ et à pousser une bougie à fort volume au-dessus de 65 000 $, nous cherchons alors une hausse rapide jusqu’à la zone de résistance 66 700 $ – 67 500 $.
Le risque baissier : si la perte du support immédiat se produit, un balayage vers le bas est possible jusqu’aux plus bas de la fourchette macro près de 62 500 $.
Le piège du week-end : est-ce que le $BTC va éclater à la hausse… ou nous tromper ? 📉 📈
Bonjour la famille de Binance Square ! Alors que nous entrons dans le week-end, la volatilité se resserre partout, et $BITCOIN se trouve pile à un point de décision majeur près de 64 050 $.
Le volume se calme, ce qui signifie généralement une chose : un mouvement brusque arrive. Voici comment je joue la structure de marché actuelle :
Le scénario haussier : si les haussiers parviennent à défendre la zone de support 63 500 $ – 64 000 $ et à pousser une bougie à fort volume au-dessus de 65 000 $, nous cherchons alors une hausse rapide jusqu’à la zone de résistance 66 700 $ – 67 500 $.
Le risque baissier : si la perte du support immédiat se produit, un balayage vers le bas est possible jusqu’aux plus bas de la fourchette macro près de 62 500 $.
Le volume se calme, ce qui signifie généralement une chose : un mouvement brusque arrive. Voici comment je joue la structure de marché actuelle :
Le scénario haussier : si les haussiers parviennent à défendre la zone de support 63 500 $ – 64 000 $ et à pousser une bougie à fort volume au-dessus de 65 000 $, nous cherchons alors une hausse rapide jusqu’à la zone de résistance 66 700 $ – 67 500 $.
Le risque baissier : si la perte du support immédiat se produit, un balayage vers le bas est possible jusqu’aux plus bas de la fourchette macro près de 62 500 $.
99
Analyse du marché Ethereum $ETH
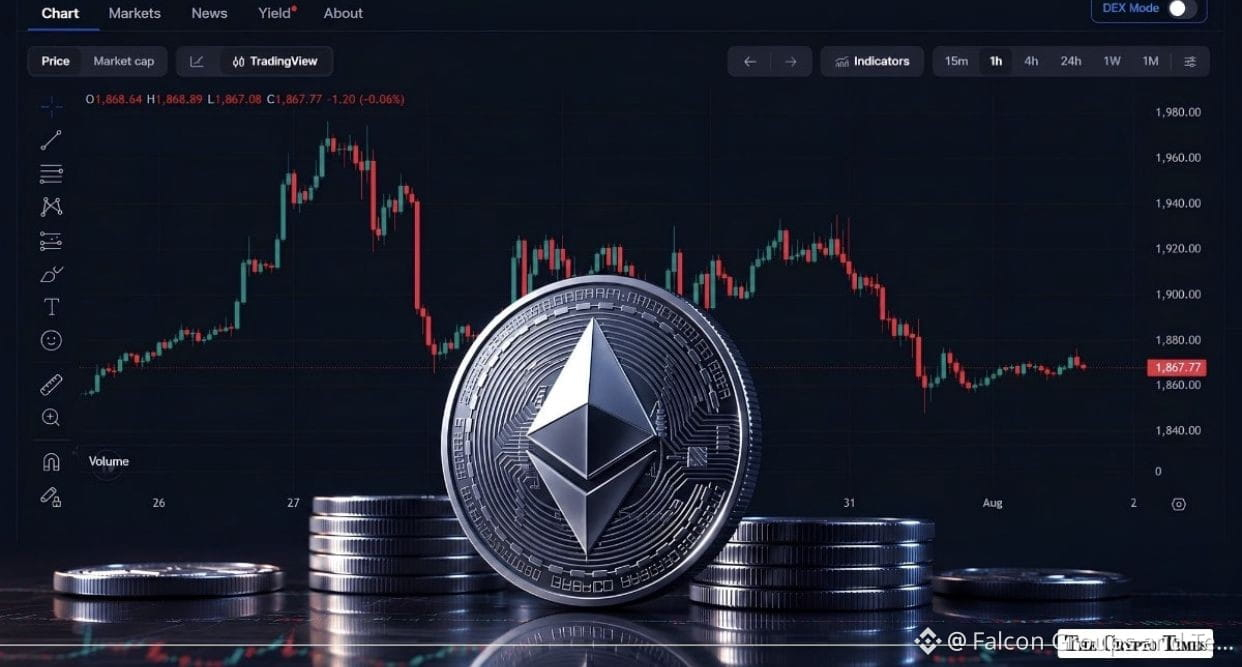
* Prix actuel : ~1 890 – 1 900 $
* Contexte du marché : $ETH tente une reprise stable après avoir testé un support près de la zone des 1 850 $. Le mouvement évolue de concert avec les fluctuations plus larges du marché crypto, pendant que les traders digèrent les mises à jour macroéconomiques et les données sur l’inflation aux États-Unis.
Niveaux techniques clés
| Type de niveau | Fourchette de prix | Importance |
|---|---|---|
| Support immédiat | 1 850 – 1 865 $ | Confluence des moyennes mobiles exponentielles (EMA) sur 20 jours et 50 jours ; sert de “filet de sécurité” essentiel en cas de baisse à court terme. |
| Pivot / Seuil de cassure | 1 895 – 1 920 $ | Point d’inflexion à court terme, aligné sur l’EMA sur 100 jours (1 922 $). Reprendre cette zone est crucial pour construire un élan haussier. |
| Offre / Résistance majeure | 1 960 – 2 000 $ | Zone de résistance au-dessus, particulièrement dense. Une clôture quotidienne confirmée au-dessus de ce niveau ouvre la voie vers des objectifs intermédiaires plus élevés (2 170 $+). |
Quand est le meilleur moment pour trader ?
Le bon moment pour entrer dépend de votre préférence : jouer une fourchette “en sécurité” ou attendre une cassure confirmée :
* Meilleur moment pour des positions longues (rebond sur support) :
Recherchez des entrées lorsque le prix teste avec succès et défend la zone de support 1 850 – 1 865 $ tout en voyant le volume de vente diminuer. Acheter près du support en conservant un stop-loss serré sous 1 830 $ offre un ratio risque/rendement favorable.
* Meilleur moment pour la dynamique / les entrées sur cassure :
Évitez de courir après le prix au milieu de la fourchette. Attendez plutôt une clôture quotidienne à fort volume au-dessus de la zone de résistance 1 920 – 1 960 $. Entrer après confirmation réduit le risque de se faire piéger par une fausse cassure ou un rejet ramenant vers les plus bas de la fourchette.
* Avertissement de gestion du risque :
Avec un sentiment global du marché plutôt prudent et des tendances de volume estivales restant plates, évitez le levier élevé. Échelonnez vos ordres et conservez des stop-loss stricts pour vous protéger contre la volatilité liée aux facteurs macro.
#ETH #EthereumMarket $ETH
{spot}(ETHUSDT)
Analyse du marché Ethereum $ETH
* Prix actuel : ~1 890 – 1 900 $
* Contexte du marché : $ETH tente une reprise stable après avoir testé un support près de la zone des 1 850 $. Le mouvement évolue de concert avec les fluctuations plus larges du marché crypto, pendant que les traders digèrent les mises à jour macroéconomiques et les données sur l’inflation aux États-Unis.
Niveaux techniques clés
| Type de niveau | Fourchette de prix | Importance |
|---|---|---|
| Support immédiat | 1 850 – 1 865 $ | Confluence des moyennes mobiles exponentielles (EMA) sur 20 jours et 50 jours ; sert de “filet de sécurité” essentiel en cas de baisse à court terme. |
| Pivot / Seuil de cassure | 1 895 – 1 920 $ | Point d’inflexion à court terme, aligné sur l’EMA sur 100 jours (1 922 $). Reprendre cette zone est crucial pour construire un élan haussier. |
| Offre / Résistance majeure | 1 960 – 2 000 $ | Zone de résistance au-dessus, particulièrement dense. Une clôture quotidienne confirmée au-dessus de ce niveau ouvre la voie vers des objectifs intermédiaires plus élevés (2 170 $+). |
Quand est le meilleur moment pour trader ?
Le bon moment pour entrer dépend de votre préférence : jouer une fourchette “en sécurité” ou attendre une cassure confirmée :
* Meilleur moment pour des positions longues (rebond sur support) :
Recherchez des entrées lorsque le prix teste avec succès et défend la zone de support 1 850 – 1 865 $ tout en voyant le volume de vente diminuer. Acheter près du support en conservant un stop-loss serré sous 1 830 $ offre un ratio risque/rendement favorable.
* Meilleur moment pour la dynamique / les entrées sur cassure :
Évitez de courir après le prix au milieu de la fourchette. Attendez plutôt une clôture quotidienne à fort volume au-dessus de la zone de résistance 1 920 – 1 960 $. Entrer après confirmation réduit le risque de se faire piéger par une fausse cassure ou un rejet ramenant vers les plus bas de la fourchette.
* Avertissement de gestion du risque :
Avec un sentiment global du marché plutôt prudent et des tendances de volume estivales restant plates, évitez le levier élevé. Échelonnez vos ordres et conservez des stop-loss stricts pour vous protéger contre la volatilité liée aux facteurs macro.
#ETH #EthereumMarket $ETH
* Prix actuel : ~1 890 – 1 900 $
* Contexte du marché : $ETH tente une reprise stable après avoir testé un support près de la zone des 1 850 $. Le mouvement évolue de concert avec les fluctuations plus larges du marché crypto, pendant que les traders digèrent les mises à jour macroéconomiques et les données sur l’inflation aux États-Unis.
Niveaux techniques clés
| Type de niveau | Fourchette de prix | Importance |
|---|---|---|
| Support immédiat | 1 850 – 1 865 $ | Confluence des moyennes mobiles exponentielles (EMA) sur 20 jours et 50 jours ; sert de “filet de sécurité” essentiel en cas de baisse à court terme. |
| Pivot / Seuil de cassure | 1 895 – 1 920 $ | Point d’inflexion à court terme, aligné sur l’EMA sur 100 jours (1 922 $). Reprendre cette zone est crucial pour construire un élan haussier. |
| Offre / Résistance majeure | 1 960 – 2 000 $ | Zone de résistance au-dessus, particulièrement dense. Une clôture quotidienne confirmée au-dessus de ce niveau ouvre la voie vers des objectifs intermédiaires plus élevés (2 170 $+). |
Quand est le meilleur moment pour trader ?
Le bon moment pour entrer dépend de votre préférence : jouer une fourchette “en sécurité” ou attendre une cassure confirmée :
* Meilleur moment pour des positions longues (rebond sur support) :
Recherchez des entrées lorsque le prix teste avec succès et défend la zone de support 1 850 – 1 865 $ tout en voyant le volume de vente diminuer. Acheter près du support en conservant un stop-loss serré sous 1 830 $ offre un ratio risque/rendement favorable.
* Meilleur moment pour la dynamique / les entrées sur cassure :
Évitez de courir après le prix au milieu de la fourchette. Attendez plutôt une clôture quotidienne à fort volume au-dessus de la zone de résistance 1 920 – 1 960 $. Entrer après confirmation réduit le risque de se faire piéger par une fausse cassure ou un rejet ramenant vers les plus bas de la fourchette.
* Avertissement de gestion du risque :
Avec un sentiment global du marché plutôt prudent et des tendances de volume estivales restant plates, évitez le levier élevé. Échelonnez vos ordres et conservez des stop-loss stricts pour vous protéger contre la volatilité liée aux facteurs macro.
#ETH #EthereumMarket $ETH
80
Article
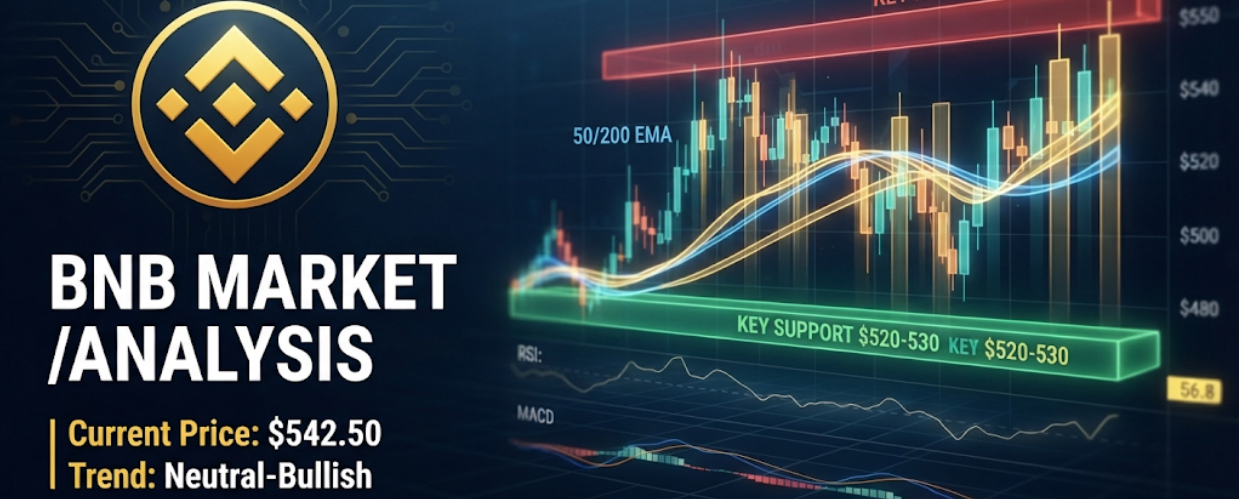
Analyse technique détaillée BNB / USDPrix actuel du marché : ~$BNB 542,50
Indicateurs techniques : EMA sur 50 jours : 530,00 $ (agissant comme support dynamique immédiat)
EMA sur 200 jours :
498,00 $ (base structurelle à long terme)
RSI (Relative Strength Index) : 56,8 (momentum neutre à haussier, en progression sans être suracheté)
MACD :
Convergence haussière modérée en formation sur les graphiques journaliers après des tests récents du support.
Zones techniques clés
Type de zone
Fourchette de prix
Analyse & importance
Zone d’offre / de résistance
555,00 $ - 565,00 $
Bloc de liquidité important. Les tentatives de reprise précédentes ont rencontré une forte pression de vente à cet endroit. Une clôture quotidienne au-dessus de 565 $ est nécessaire pour un important breakout.
Analyse technique détaillée BNB / USD
Prix actuel du marché : ~$BNB 542,50
Indicateurs techniques : EMA sur 50 jours : 530,00 $ (agissant comme support dynamique immédiat)
EMA sur 200 jours :
498,00 $ (base structurelle à long terme)
RSI (Relative Strength Index) : 56,8 (momentum neutre à haussier, en progression sans être suracheté)
MACD :
Convergence haussière modérée en formation sur les graphiques journaliers après des tests récents du support.
Zones techniques clés
Type de zone
Fourchette de prix
Analyse & importance
Zone d’offre / de résistance
555,00 $ - 565,00 $
Bloc de liquidité important. Les tentatives de reprise précédentes ont rencontré une forte pression de vente à cet endroit. Une clôture quotidienne au-dessus de 565 $ est nécessaire pour un important breakout.
Indicateurs techniques : EMA sur 50 jours : 530,00 $ (agissant comme support dynamique immédiat)
EMA sur 200 jours :
498,00 $ (base structurelle à long terme)
RSI (Relative Strength Index) : 56,8 (momentum neutre à haussier, en progression sans être suracheté)
MACD :
Convergence haussière modérée en formation sur les graphiques journaliers après des tests récents du support.
Zones techniques clés
Type de zone
Fourchette de prix
Analyse & importance
Zone d’offre / de résistance
555,00 $ - 565,00 $
Bloc de liquidité important. Les tentatives de reprise précédentes ont rencontré une forte pression de vente à cet endroit. Une clôture quotidienne au-dessus de 565 $ est nécessaire pour un important breakout.
86
Analyse du trading Bitcoin $BTC
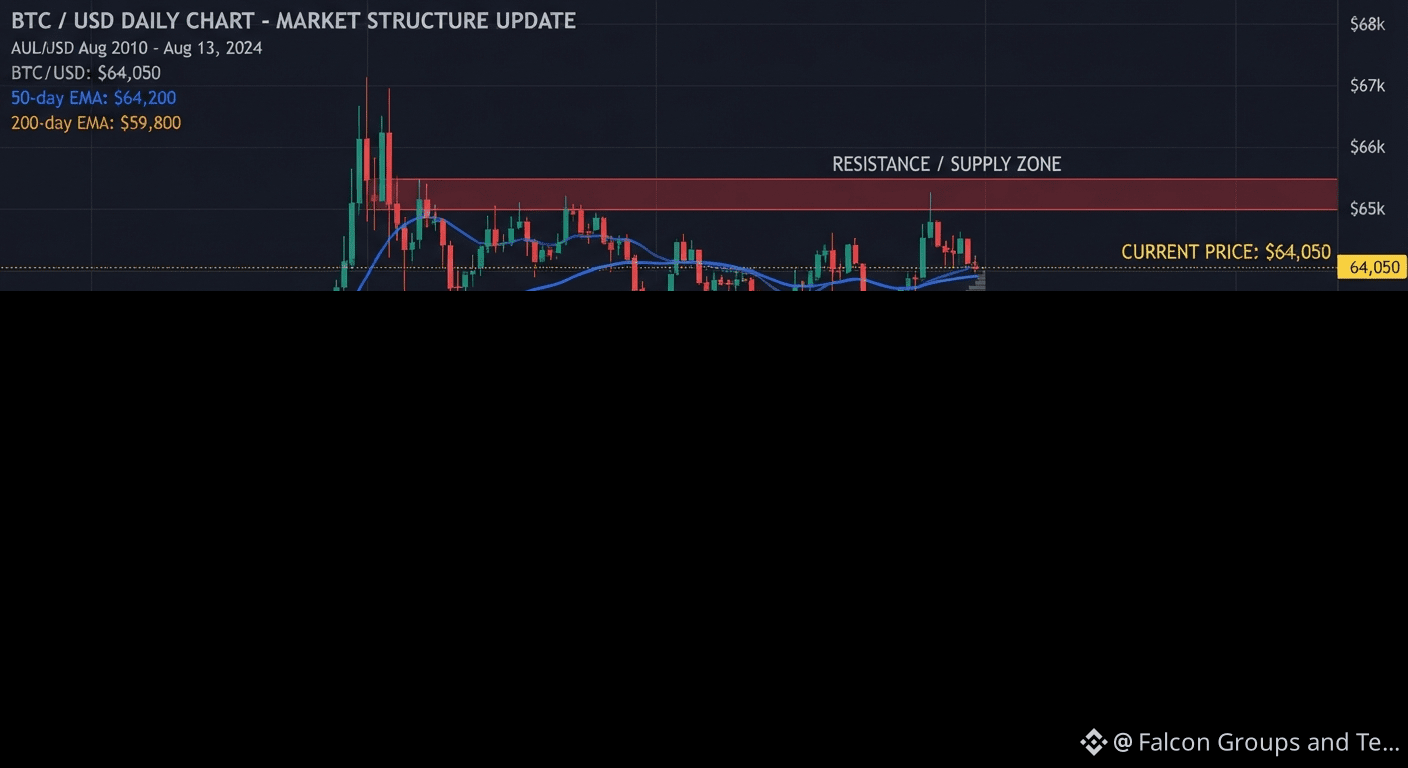
* Prix actuel : ~63 800 $ – 64 000 $
* Contexte du marché : $BTC consolide dans une fourchette serrée entre 62 500 $ et 65 000 $, réagissant de près aux données récentes d’inflation aux États-Unis (IPC) et attendant des déclencheurs macroéconomiques à venir.
Niveaux techniques clés
| Type de niveau | Zone de prix / Fourchette | Importance |
|---|---|---|
| Support immédiat | 62 500 $ – 63 500 $ | Zone de demande cruciale maintenant des plus bas plus élevés à court terme ; une cassure risque d’entraîner une baisse vers 61 300 $. |
| Pivot / Zone de cassure | 64 000 $ – 64 500 $ | Point d’inflexion à court terme ; interaction avec la MM 50 jours (64 583 $). |
| Résistance immédiate | 64 900 $ – 65 300 $ | Zone d’offre/liquidité importante. Un rejet ici pourrait prolonger le mouvement en range. |
| Objectif haussier / Cassure | 66 700 $ – 67 500 $ | Une clôture journalière confirmée au-dessus des objectifs de résistance vise la MM 100 jours et des sommets locaux faibles. |
Scénarios de trading
* Configuration de continuation haussière (Long) :
* Déclencheur : rechercher une clôture solide en bougie 1H–4H au-dessus de 65 000 $, soutenue par le volume, ou un retest propre et une défense du bloc de support 63 800 $ – 64 200 $.
* Objectifs : 65 500 $, puis 66 750 $.
* Gestion du risque : stop-loss géré de façon serrée sous 63 500 $.
* Configuration baissière / rejet de range (Short) :
* Déclencheur : rejet et baisse de la dynamique autour de la zone d’offre 64 900 $ – 65 300 $.
* Objectifs : retour vers les plus bas du range à 62 500 $.
* Gestion du risque : stop-loss placé au-dessus de 65 600 $.
* Invalidation : une clôture journalière à fort volume sous 62 000 $ invalide la structure actuelle de reprise à court terme, exposant un soutien macro plus profond.
#BTC #Market_Update
{spot}(BTCUSDT)
Analyse du trading Bitcoin $BTC
* Prix actuel : ~63 800 $ – 64 000 $
* Contexte du marché : $BTC consolide dans une fourchette serrée entre 62 500 $ et 65 000 $, réagissant de près aux données récentes d’inflation aux États-Unis (IPC) et attendant des déclencheurs macroéconomiques à venir.
Niveaux techniques clés
| Type de niveau | Zone de prix / Fourchette | Importance |
|---|---|---|
| Support immédiat | 62 500 $ – 63 500 $ | Zone de demande cruciale maintenant des plus bas plus élevés à court terme ; une cassure risque d’entraîner une baisse vers 61 300 $. |
| Pivot / Zone de cassure | 64 000 $ – 64 500 $ | Point d’inflexion à court terme ; interaction avec la MM 50 jours (64 583 $). |
| Résistance immédiate | 64 900 $ – 65 300 $ | Zone d’offre/liquidité importante. Un rejet ici pourrait prolonger le mouvement en range. |
| Objectif haussier / Cassure | 66 700 $ – 67 500 $ | Une clôture journalière confirmée au-dessus des objectifs de résistance vise la MM 100 jours et des sommets locaux faibles. |
Scénarios de trading
* Configuration de continuation haussière (Long) :
* Déclencheur : rechercher une clôture solide en bougie 1H–4H au-dessus de 65 000 $, soutenue par le volume, ou un retest propre et une défense du bloc de support 63 800 $ – 64 200 $.
* Objectifs : 65 500 $, puis 66 750 $.
* Gestion du risque : stop-loss géré de façon serrée sous 63 500 $.
* Configuration baissière / rejet de range (Short) :
* Déclencheur : rejet et baisse de la dynamique autour de la zone d’offre 64 900 $ – 65 300 $.
* Objectifs : retour vers les plus bas du range à 62 500 $.
* Gestion du risque : stop-loss placé au-dessus de 65 600 $.
* Invalidation : une clôture journalière à fort volume sous 62 000 $ invalide la structure actuelle de reprise à court terme, exposant un soutien macro plus profond.
#BTC #Market_Update
* Prix actuel : ~63 800 $ – 64 000 $
* Contexte du marché : $BTC consolide dans une fourchette serrée entre 62 500 $ et 65 000 $, réagissant de près aux données récentes d’inflation aux États-Unis (IPC) et attendant des déclencheurs macroéconomiques à venir.
Niveaux techniques clés
| Type de niveau | Zone de prix / Fourchette | Importance |
|---|---|---|
| Support immédiat | 62 500 $ – 63 500 $ | Zone de demande cruciale maintenant des plus bas plus élevés à court terme ; une cassure risque d’entraîner une baisse vers 61 300 $. |
| Pivot / Zone de cassure | 64 000 $ – 64 500 $ | Point d’inflexion à court terme ; interaction avec la MM 50 jours (64 583 $). |
| Résistance immédiate | 64 900 $ – 65 300 $ | Zone d’offre/liquidité importante. Un rejet ici pourrait prolonger le mouvement en range. |
| Objectif haussier / Cassure | 66 700 $ – 67 500 $ | Une clôture journalière confirmée au-dessus des objectifs de résistance vise la MM 100 jours et des sommets locaux faibles. |
Scénarios de trading
* Configuration de continuation haussière (Long) :
* Déclencheur : rechercher une clôture solide en bougie 1H–4H au-dessus de 65 000 $, soutenue par le volume, ou un retest propre et une défense du bloc de support 63 800 $ – 64 200 $.
* Objectifs : 65 500 $, puis 66 750 $.
* Gestion du risque : stop-loss géré de façon serrée sous 63 500 $.
* Configuration baissière / rejet de range (Short) :
* Déclencheur : rejet et baisse de la dynamique autour de la zone d’offre 64 900 $ – 65 300 $.
* Objectifs : retour vers les plus bas du range à 62 500 $.
* Gestion du risque : stop-loss placé au-dessus de 65 600 $.
* Invalidation : une clôture journalière à fort volume sous 62 000 $ invalide la structure actuelle de reprise à court terme, exposant un soutien macro plus profond.
#BTC #Market_Update
75
Connectez-vous pour découvrir plus de contenu
Rejoignez la communauté mondiale des adeptes de cryptomonnaies sur Binance Square
⚡️ Suviez les dernières informations importantes sur les cryptomonnaies.
💬 Jugé digne de confiance par la plus grande plateforme d’échange de cryptomonnaies au monde.
👍 Découvrez les connaissances que partagent les créateurs vérifiés.
Adresse e-mail/Nº de téléphone
Sujets d’actualité
NvidiaApproves$150BBuyback
1,342 vues
37 mentions
#NvidiaApproves$150BBuyback
Onde de choc de rachat de 150 milliards de dollars de Nvidia : est-ce que les flux de trésorerie liés à l’IA alimentent la prochaine flambée du marché ? 🚀
Le supercycle de l’IA vient d’envoyer des ondes de choc à travers les marchés traditionnels (tradfi) et crypto ! Le conseil d’administration de NVIDIA a autorisé une hausse massive de 150 milliards de dollars de son programme de rachat d’actions, portant l’autorisation totale restante de rachat de la société à 235 milliards de dollars.
Il s’agit de la plus grande autorisation de rachat d’actions de l’histoire des entreprises américaines, dépassant le repère d’Apple à 110 milliards de dollars.
📰 Faits marquants & décryptage du marché
Restitution de capital record : Le fondateur et PDG de NVIDIA, Jensen Huang, a cité « un changement de plateforme, une fois par génération, vers l’IA » ainsi que de solides flux de trésorerie d’entreprise comme principaux moteurs du retour de capital aux actionnaires.
L’inverse des replis du marché : Malgré la pression plus large sur les actions et la hausse des rendements des bons du Trésor américain, les actions de $NVDA ont bondi de plus de 3 % à l’annonce, signalant la confiance des investisseurs institutionnels dans les actifs tech.
Retombées sur l’IA décentralisée : Historiquement, les grands titres bullish sur NVIDIA déclenchent un sentiment positif pour les protocoles d’infrastructure d’IA décentralisée (tels que NEAR, RENDER et FET), car les projets web3 liés à l’IA suivent les valorisations du secteur de l’IA dans son ensemble.
❓ Point à discuter
Nvidia annonce un rachat massif de 150 Md ! Les gains sur les actions technologiques vont-ils déborder vers le Bitcoin et les tokens d’IA ?
$RENDER
📊 Signal de trading crypto associé : RENDER/USDT
Biais de trading : Bullish
Zone d’entrée : 5,20 $ – 5,45 $
Objectif 1 (TP1) : 6,10 $
Objectif 2 (TP2) : 6,85 $
Stop Loss (SL) : 4,85 $
Effet de levier (futures) : 3x – 5x (Isolé)
Justification technique : RENDER réagit souvent fortement au matériel Nvidia et aux développements en matière de capital lié à l’IA. Le prix se consolide près du support clé de la moyenne mobile, avec un volume spot en hausse après la $NVDAB
annonce.
#HackersDrainOver12.4MXRPFromDCENTWallets #CryptoNews #AITokens #TradingSignals
Lily星星
·1 mentions J’aime
·135 vues
OpenAIDelaysGPT6.1OverSafetyIssues
6,530 vues
306 mentions
AMDToAcquireWorldLabsFor$8.2B
847 vues
34 mentions