

Mr boom 1
5 Publications

Mr boom 1
Signaler
Bloquer l’utilisateur
0 Suivis
0 Abonnés
0 J’aime
Publications
·
--
Voir la traduction
Market is moving! $BTC strong zone mein hai, ETH & BNB bhi momentum dikha rahe hain. 📈
#CerebrasSinksNearly20%OnReportNvidiaToPowerOpenAI #SECProposesCryptoCustodyRules #G7PlansToReleaseUpTo100MBarrelsOilDiesel
Market is moving! $BTC strong zone mein hai, ETH & BNB bhi momentum dikha rahe hain. 📈
#CerebrasSinksNearly20%OnReportNvidiaToPowerOpenAI #SECProposesCryptoCustodyRules #G7PlansToReleaseUpTo100MBarrelsOilDiesel
#CerebrasSinksNearly20%OnReportNvidiaToPowerOpenAI #SECProposesCryptoCustodyRules #G7PlansToReleaseUpTo100MBarrelsOilDiesel

32
·
--
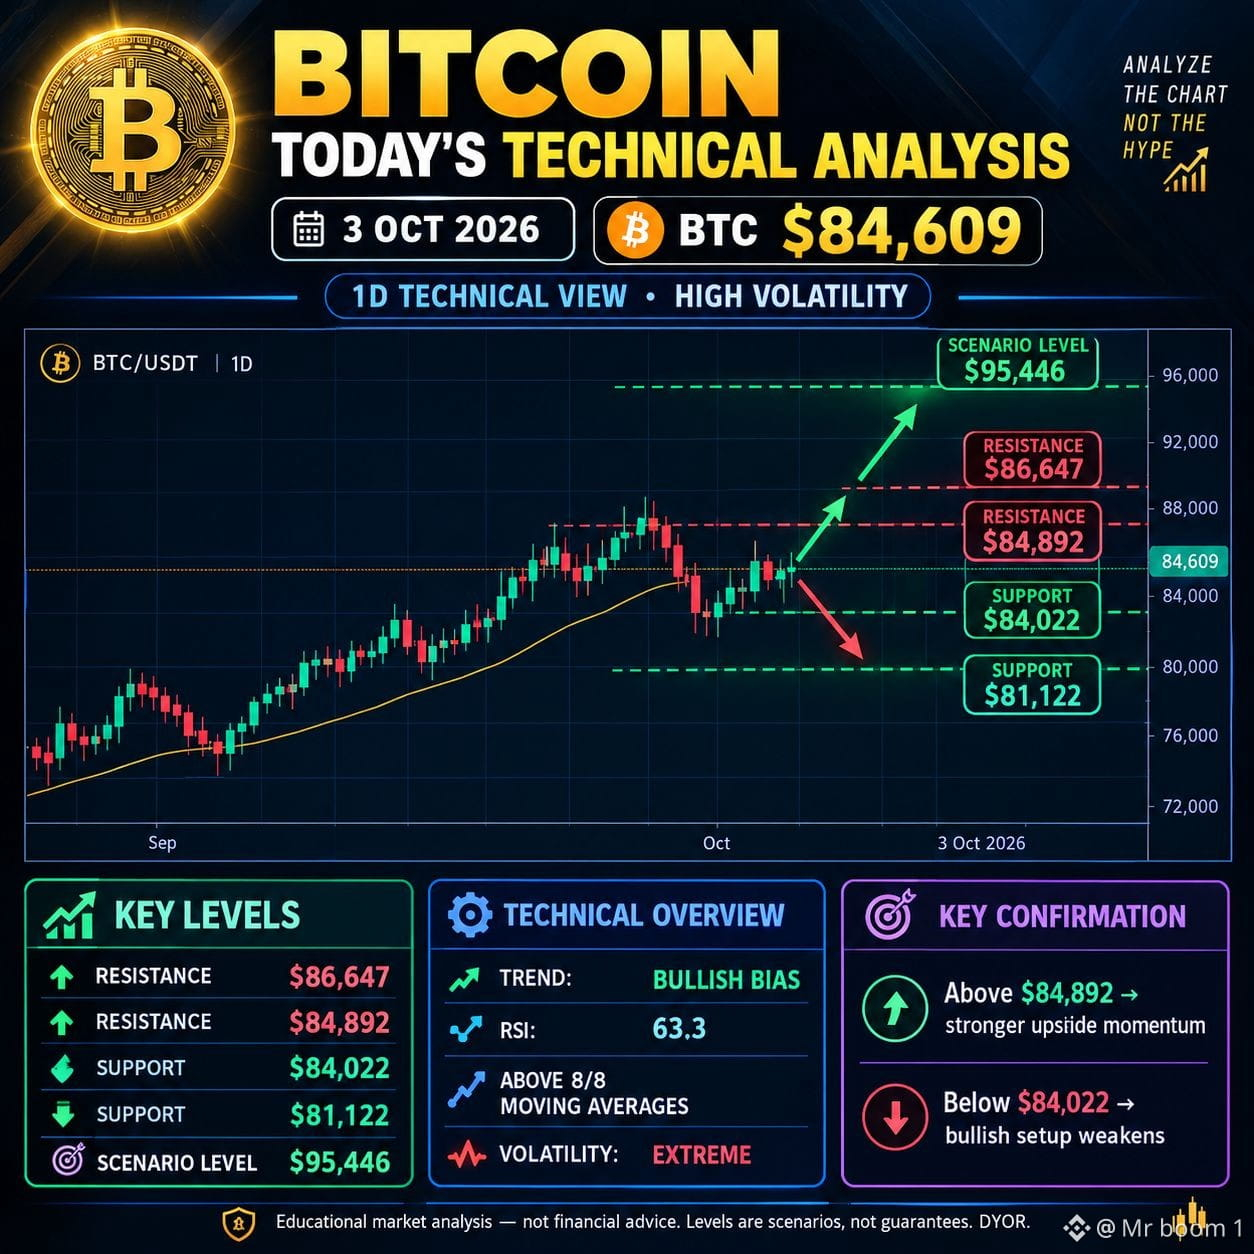
🚨 BITCOIN $BTC — ANALYSE DU JOUR | 3 OCT 2026
💰 BTC : 84 609 $
📈 Tendance : biais haussier
🟢 Résistance : 84 892 $ → 86 647 $
🎯 Niveau de scénario : 95 446 $
🔴 Support : 84 022 $ → 81 122 $
⚡ Au-dessus de 84 892 $ → élan haussier
⚠️ En dessous de 84 022 $ → le scénario haussier s’affaiblit
📊 Forte volatilité — attendez une confirmation.
#BTC #Bitcoin #Crypto #Trading #BTCAnalysis
{future}(BTCUSDT)
🚨 BITCOIN $BTC — ANALYSE DU JOUR | 3 OCT 2026
💰 BTC : 84 609 $
📈 Tendance : biais haussier
🟢 Résistance : 84 892 $ → 86 647 $
🎯 Niveau de scénario : 95 446 $
🔴 Support : 84 022 $ → 81 122 $
⚡ Au-dessus de 84 892 $ → élan haussier
⚠️ En dessous de 84 022 $ → le scénario haussier s’affaiblit
📊 Forte volatilité — attendez une confirmation.
#BTC #Bitcoin #Crypto #Trading #BTCAnalysis
💰 BTC : 84 609 $
📈 Tendance : biais haussier
🟢 Résistance : 84 892 $ → 86 647 $
🎯 Niveau de scénario : 95 446 $
🔴 Support : 84 022 $ → 81 122 $
⚡ Au-dessus de 84 892 $ → élan haussier
⚠️ En dessous de 84 022 $ → le scénario haussier s’affaiblit
📊 Forte volatilité — attendez une confirmation.
#BTC #Bitcoin #Crypto #Trading #BTCAnalysis
43
·
--
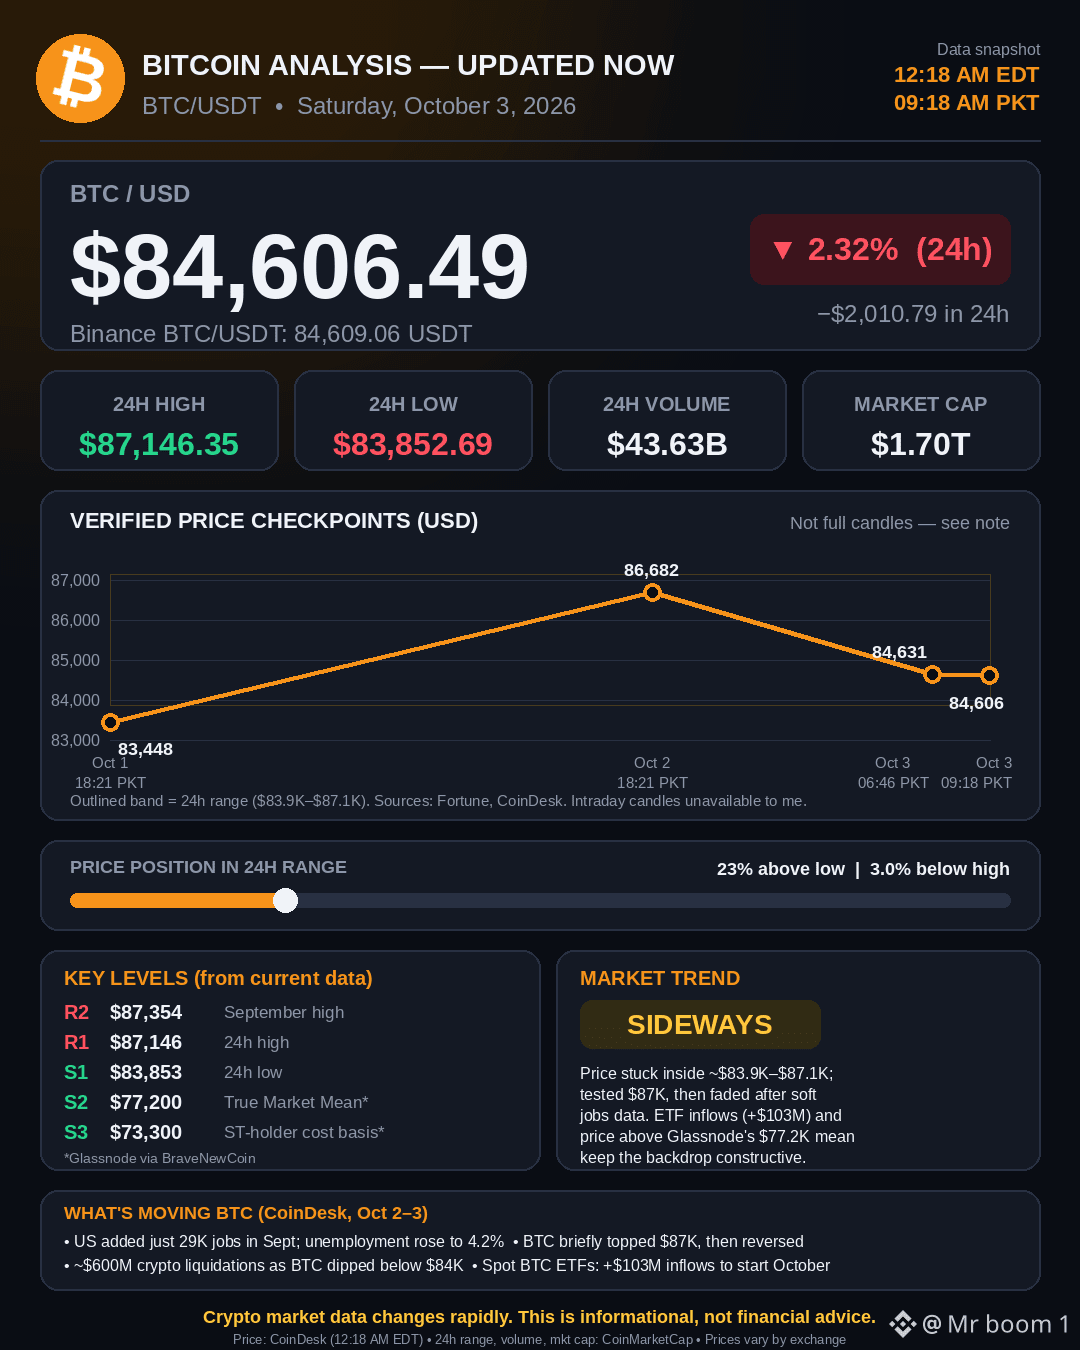
₿ ANALYSE DU BITCOIN — MISE À JOUR MAINTENANT
$BTC /USDT | Samedi 3 octobre 2026
Aperçu des données : 12 h 18 (EDT) / 09 h 18 (PKT)
💰 Prix : 84 606,49 $ (Binance BTC/USDT : 84 609,06)
📉 Variation 24h : -2,32% (-2 010,79 $)
🔼 Plus haut 24h : 87 146,35 $
🔽 Plus bas 24h : 83 852,69 $
📊 Volume 24h : 43,63 Md$
🏦 Capitalisation boursière : 1,70 T$
NIVEAUX CLÉS
Résistance : 87 354 $ (plus haut de septembre), 87 146 $ (plus haut des 24h)
Support : 83 853 $ (plus bas des 24h), 77 200 $ (True Market Mean*), 73 300 $ (coût de base des détenteurs à court terme*)
*Données Glassnode
TENDANCE : LATÉRALE
Le BTC évolue à l’intérieur d’une fourchette d’environ 83,9 K$–87,1 K$. Il a testé 87 K$, puis s’est replié après les données américaines sur l’emploi (plutôt molles). Le prix se situe à environ 23 % au-dessus du plus bas des 24h et à 3,0 % en dessous du plus haut des 24h. Les entrées de FNB (ETF) (+103 M$) et le fait que le prix reste au-dessus de la moyenne de 77,2 K$ de Glassnode maintiennent un contexte plutôt constructif.
CE QUI FAIT BOUGER LE BTC
• Les États-Unis n’ont ajouté que 29 K emplois en septembre ; le chômage est passé à 4,2 %
• Le BTC a brièvement dépassé 87 K$, puis s’est retourné
• Environ 600 M$ de liquidations en crypto lorsque le BTC est passé sous 84 K$
• FNB spot sur le BTC : +103 M$ d’entrées pour démarrer octobre
⚠️ Les données du marché crypto évoluent rapidement. Ceci est informatif et ne constitue pas un conseil financier.
Sources : CoinDesk (prix), CoinMarketCap (fourchette 24h, volume, capitalisation boursière), Glassnode, Fortune. Les prix varient selon la plateforme.
#Bitcoin #BTC #Crypto #BTCUSDT #CryptoNews
₿ ANALYSE DU BITCOIN — MISE À JOUR MAINTENANT
$BTC /USDT | Samedi 3 octobre 2026
Aperçu des données : 12 h 18 (EDT) / 09 h 18 (PKT)
💰 Prix : 84 606,49 $ (Binance BTC/USDT : 84 609,06)
📉 Variation 24h : -2,32% (-2 010,79 $)
🔼 Plus haut 24h : 87 146,35 $
🔽 Plus bas 24h : 83 852,69 $
📊 Volume 24h : 43,63 Md$
🏦 Capitalisation boursière : 1,70 T$
NIVEAUX CLÉS
Résistance : 87 354 $ (plus haut de septembre), 87 146 $ (plus haut des 24h)
Support : 83 853 $ (plus bas des 24h), 77 200 $ (True Market Mean*), 73 300 $ (coût de base des détenteurs à court terme*)
*Données Glassnode
TENDANCE : LATÉRALE
Le BTC évolue à l’intérieur d’une fourchette d’environ 83,9 K$–87,1 K$. Il a testé 87 K$, puis s’est replié après les données américaines sur l’emploi (plutôt molles). Le prix se situe à environ 23 % au-dessus du plus bas des 24h et à 3,0 % en dessous du plus haut des 24h. Les entrées de FNB (ETF) (+103 M$) et le fait que le prix reste au-dessus de la moyenne de 77,2 K$ de Glassnode maintiennent un contexte plutôt constructif.
CE QUI FAIT BOUGER LE BTC
• Les États-Unis n’ont ajouté que 29 K emplois en septembre ; le chômage est passé à 4,2 %
• Le BTC a brièvement dépassé 87 K$, puis s’est retourné
• Environ 600 M$ de liquidations en crypto lorsque le BTC est passé sous 84 K$
• FNB spot sur le BTC : +103 M$ d’entrées pour démarrer octobre
⚠️ Les données du marché crypto évoluent rapidement. Ceci est informatif et ne constitue pas un conseil financier.
Sources : CoinDesk (prix), CoinMarketCap (fourchette 24h, volume, capitalisation boursière), Glassnode, Fortune. Les prix varient selon la plateforme.
#Bitcoin #BTC #Crypto #BTCUSDT #CryptoNews
$BTC /USDT | Samedi 3 octobre 2026
Aperçu des données : 12 h 18 (EDT) / 09 h 18 (PKT)
💰 Prix : 84 606,49 $ (Binance BTC/USDT : 84 609,06)
📉 Variation 24h : -2,32% (-2 010,79 $)
🔼 Plus haut 24h : 87 146,35 $
🔽 Plus bas 24h : 83 852,69 $
📊 Volume 24h : 43,63 Md$
🏦 Capitalisation boursière : 1,70 T$
NIVEAUX CLÉS
Résistance : 87 354 $ (plus haut de septembre), 87 146 $ (plus haut des 24h)
Support : 83 853 $ (plus bas des 24h), 77 200 $ (True Market Mean*), 73 300 $ (coût de base des détenteurs à court terme*)
*Données Glassnode
TENDANCE : LATÉRALE
Le BTC évolue à l’intérieur d’une fourchette d’environ 83,9 K$–87,1 K$. Il a testé 87 K$, puis s’est replié après les données américaines sur l’emploi (plutôt molles). Le prix se situe à environ 23 % au-dessus du plus bas des 24h et à 3,0 % en dessous du plus haut des 24h. Les entrées de FNB (ETF) (+103 M$) et le fait que le prix reste au-dessus de la moyenne de 77,2 K$ de Glassnode maintiennent un contexte plutôt constructif.
CE QUI FAIT BOUGER LE BTC
• Les États-Unis n’ont ajouté que 29 K emplois en septembre ; le chômage est passé à 4,2 %
• Le BTC a brièvement dépassé 87 K$, puis s’est retourné
• Environ 600 M$ de liquidations en crypto lorsque le BTC est passé sous 84 K$
• FNB spot sur le BTC : +103 M$ d’entrées pour démarrer octobre
⚠️ Les données du marché crypto évoluent rapidement. Ceci est informatif et ne constitue pas un conseil financier.
Sources : CoinDesk (prix), CoinMarketCap (fourchette 24h, volume, capitalisation boursière), Glassnode, Fortune. Les prix varient selon la plateforme.
#Bitcoin #BTC #Crypto #BTCUSDT #CryptoNews
95
·
--
Voir la traduction
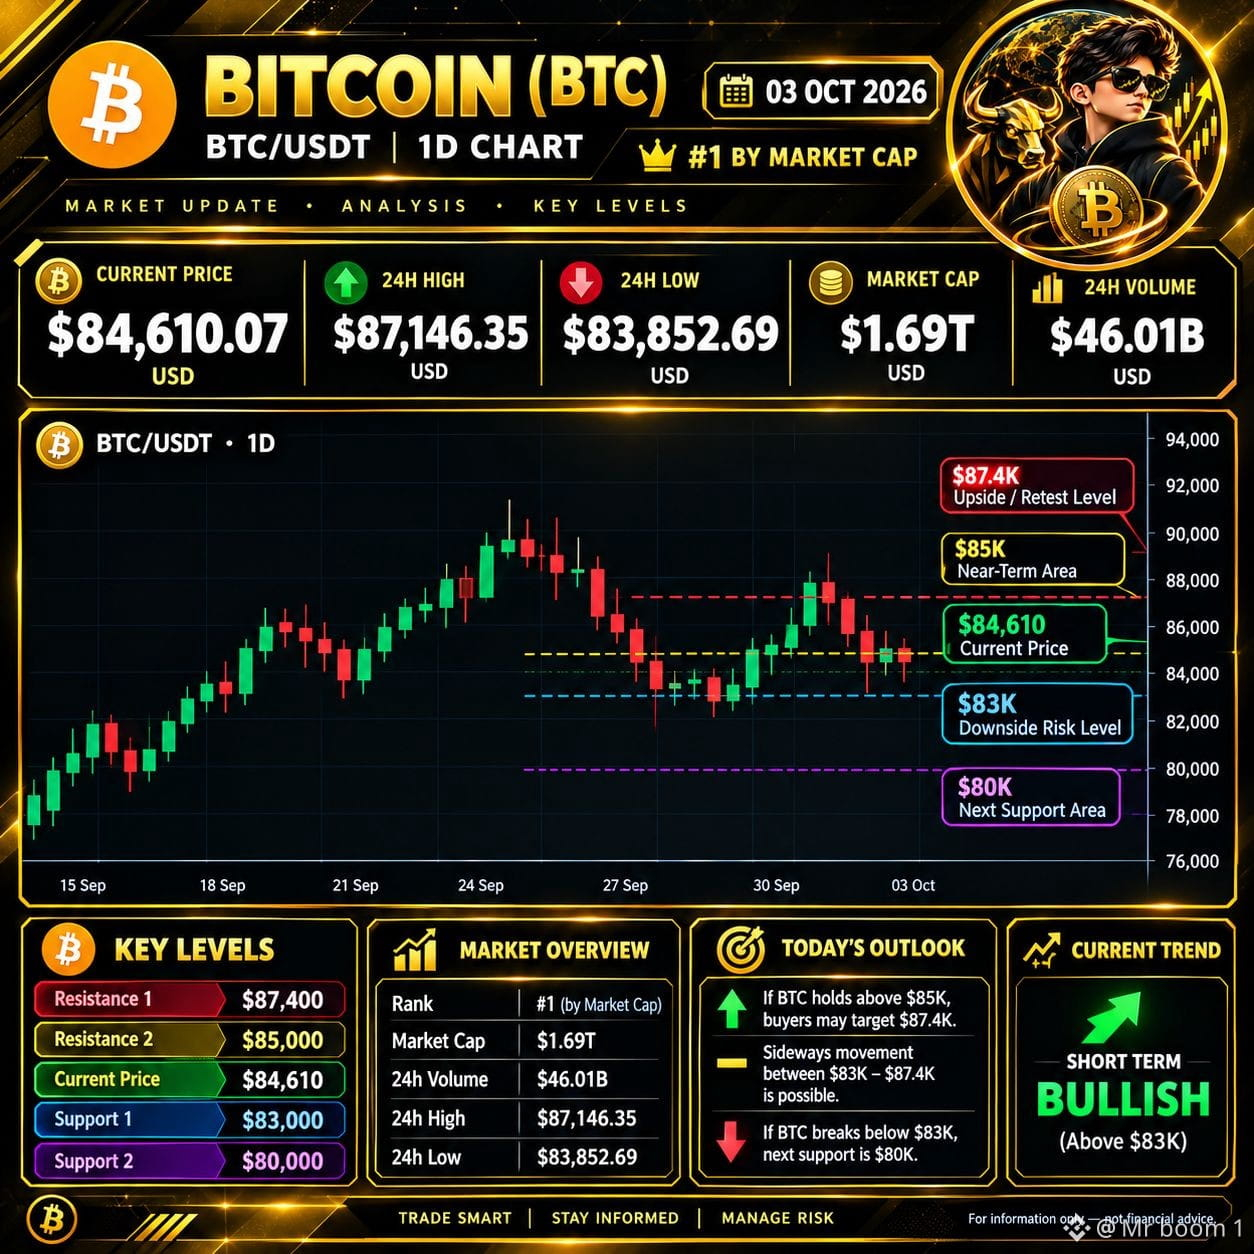
🚨 BITCOIN $BTC — TODAY’S MARKET UPDATE | 03 OCT 2026
₿ BTC is currently trading around the $84K area after recently moving above $86K. The latest price action shows a recovery followed by a pullback, so the market is currently watching the key support and resistance zones closely. �
FXDailyReport.Com +1
📊 KEY LEVELS TO WATCH
🔴 Resistance: $86K–$87.4K
🟡 Near-Term Zone: $85K
🟢 Current Area: ~$84K
🔵 Support: $83K–$84K
🟣 Major Support: ~$82K
📈 BULLISH SCENARIO
If BTC reclaims the $85K area and then breaks and holds above $87K–$87.4K, the next major psychological area to watch would be around $90K. �
FXDailyReport.Com
🟡 SIDEWAYS SCENARIO
If BTC remains between approximately $83K and $87K, consolidation and range-bound movement may continue until a clearer breakout or breakdown occurs.
🔴 BEARISH SCENARIO
If BTC loses the $83K–$82K support area and remains below it, downside risk could increase, with $80K becoming another important area to watch.
🧠 MARKET VIEW
BTC is currently in a recovery/consolidation phase, rather than showing a confirmed one-direction move. For me, the most important thing to watch is price confirmation around the key levels, not simply chasing a short-term move.
Upside: $85K → $87K/$87.4K → $90K
Downside: $83K/$82K → $80K
⚠️ This is for educational and informational purposes only, not financial advice. Crypto markets are highly volatile. Always DYOR and manage your risk before trading.
#Bitcoin #BTC #BTCUSDT #BinanceSquare #Crypto #BitcoinAnalysis #BTCUpdate #CryptoAnalysis #NFPWatch #
{future}(BTCUSDT)
🚨 BITCOIN $BTC — TODAY’S MARKET UPDATE | 03 OCT 2026
₿ BTC is currently trading around the $84K area after recently moving above $86K. The latest price action shows a recovery followed by a pullback, so the market is currently watching the key support and resistance zones closely. �
FXDailyReport.Com +1
📊 KEY LEVELS TO WATCH
🔴 Resistance: $86K–$87.4K
🟡 Near-Term Zone: $85K
🟢 Current Area: ~$84K
🔵 Support: $83K–$84K
🟣 Major Support: ~$82K
📈 BULLISH SCENARIO
If BTC reclaims the $85K area and then breaks and holds above $87K–$87.4K, the next major psychological area to watch would be around $90K. �
FXDailyReport.Com
🟡 SIDEWAYS SCENARIO
If BTC remains between approximately $83K and $87K, consolidation and range-bound movement may continue until a clearer breakout or breakdown occurs.
🔴 BEARISH SCENARIO
If BTC loses the $83K–$82K support area and remains below it, downside risk could increase, with $80K becoming another important area to watch.
🧠 MARKET VIEW
BTC is currently in a recovery/consolidation phase, rather than showing a confirmed one-direction move. For me, the most important thing to watch is price confirmation around the key levels, not simply chasing a short-term move.
Upside: $85K → $87K/$87.4K → $90K
Downside: $83K/$82K → $80K
⚠️ This is for educational and informational purposes only, not financial advice. Crypto markets are highly volatile. Always DYOR and manage your risk before trading.
#Bitcoin #BTC #BTCUSDT #BinanceSquare #Crypto #BitcoinAnalysis #BTCUpdate #CryptoAnalysis #NFPWatch #
₿ BTC is currently trading around the $84K area after recently moving above $86K. The latest price action shows a recovery followed by a pullback, so the market is currently watching the key support and resistance zones closely. �
FXDailyReport.Com +1
📊 KEY LEVELS TO WATCH
🔴 Resistance: $86K–$87.4K
🟡 Near-Term Zone: $85K
🟢 Current Area: ~$84K
🔵 Support: $83K–$84K
🟣 Major Support: ~$82K
📈 BULLISH SCENARIO
If BTC reclaims the $85K area and then breaks and holds above $87K–$87.4K, the next major psychological area to watch would be around $90K. �
FXDailyReport.Com
🟡 SIDEWAYS SCENARIO
If BTC remains between approximately $83K and $87K, consolidation and range-bound movement may continue until a clearer breakout or breakdown occurs.
🔴 BEARISH SCENARIO
If BTC loses the $83K–$82K support area and remains below it, downside risk could increase, with $80K becoming another important area to watch.
🧠 MARKET VIEW
BTC is currently in a recovery/consolidation phase, rather than showing a confirmed one-direction move. For me, the most important thing to watch is price confirmation around the key levels, not simply chasing a short-term move.
Upside: $85K → $87K/$87.4K → $90K
Downside: $83K/$82K → $80K
⚠️ This is for educational and informational purposes only, not financial advice. Crypto markets are highly volatile. Always DYOR and manage your risk before trading.
#Bitcoin #BTC #BTCUSDT #BinanceSquare #Crypto #BitcoinAnalysis #BTCUpdate #CryptoAnalysis #NFPWatch #
91
·
--
Voir la traduction
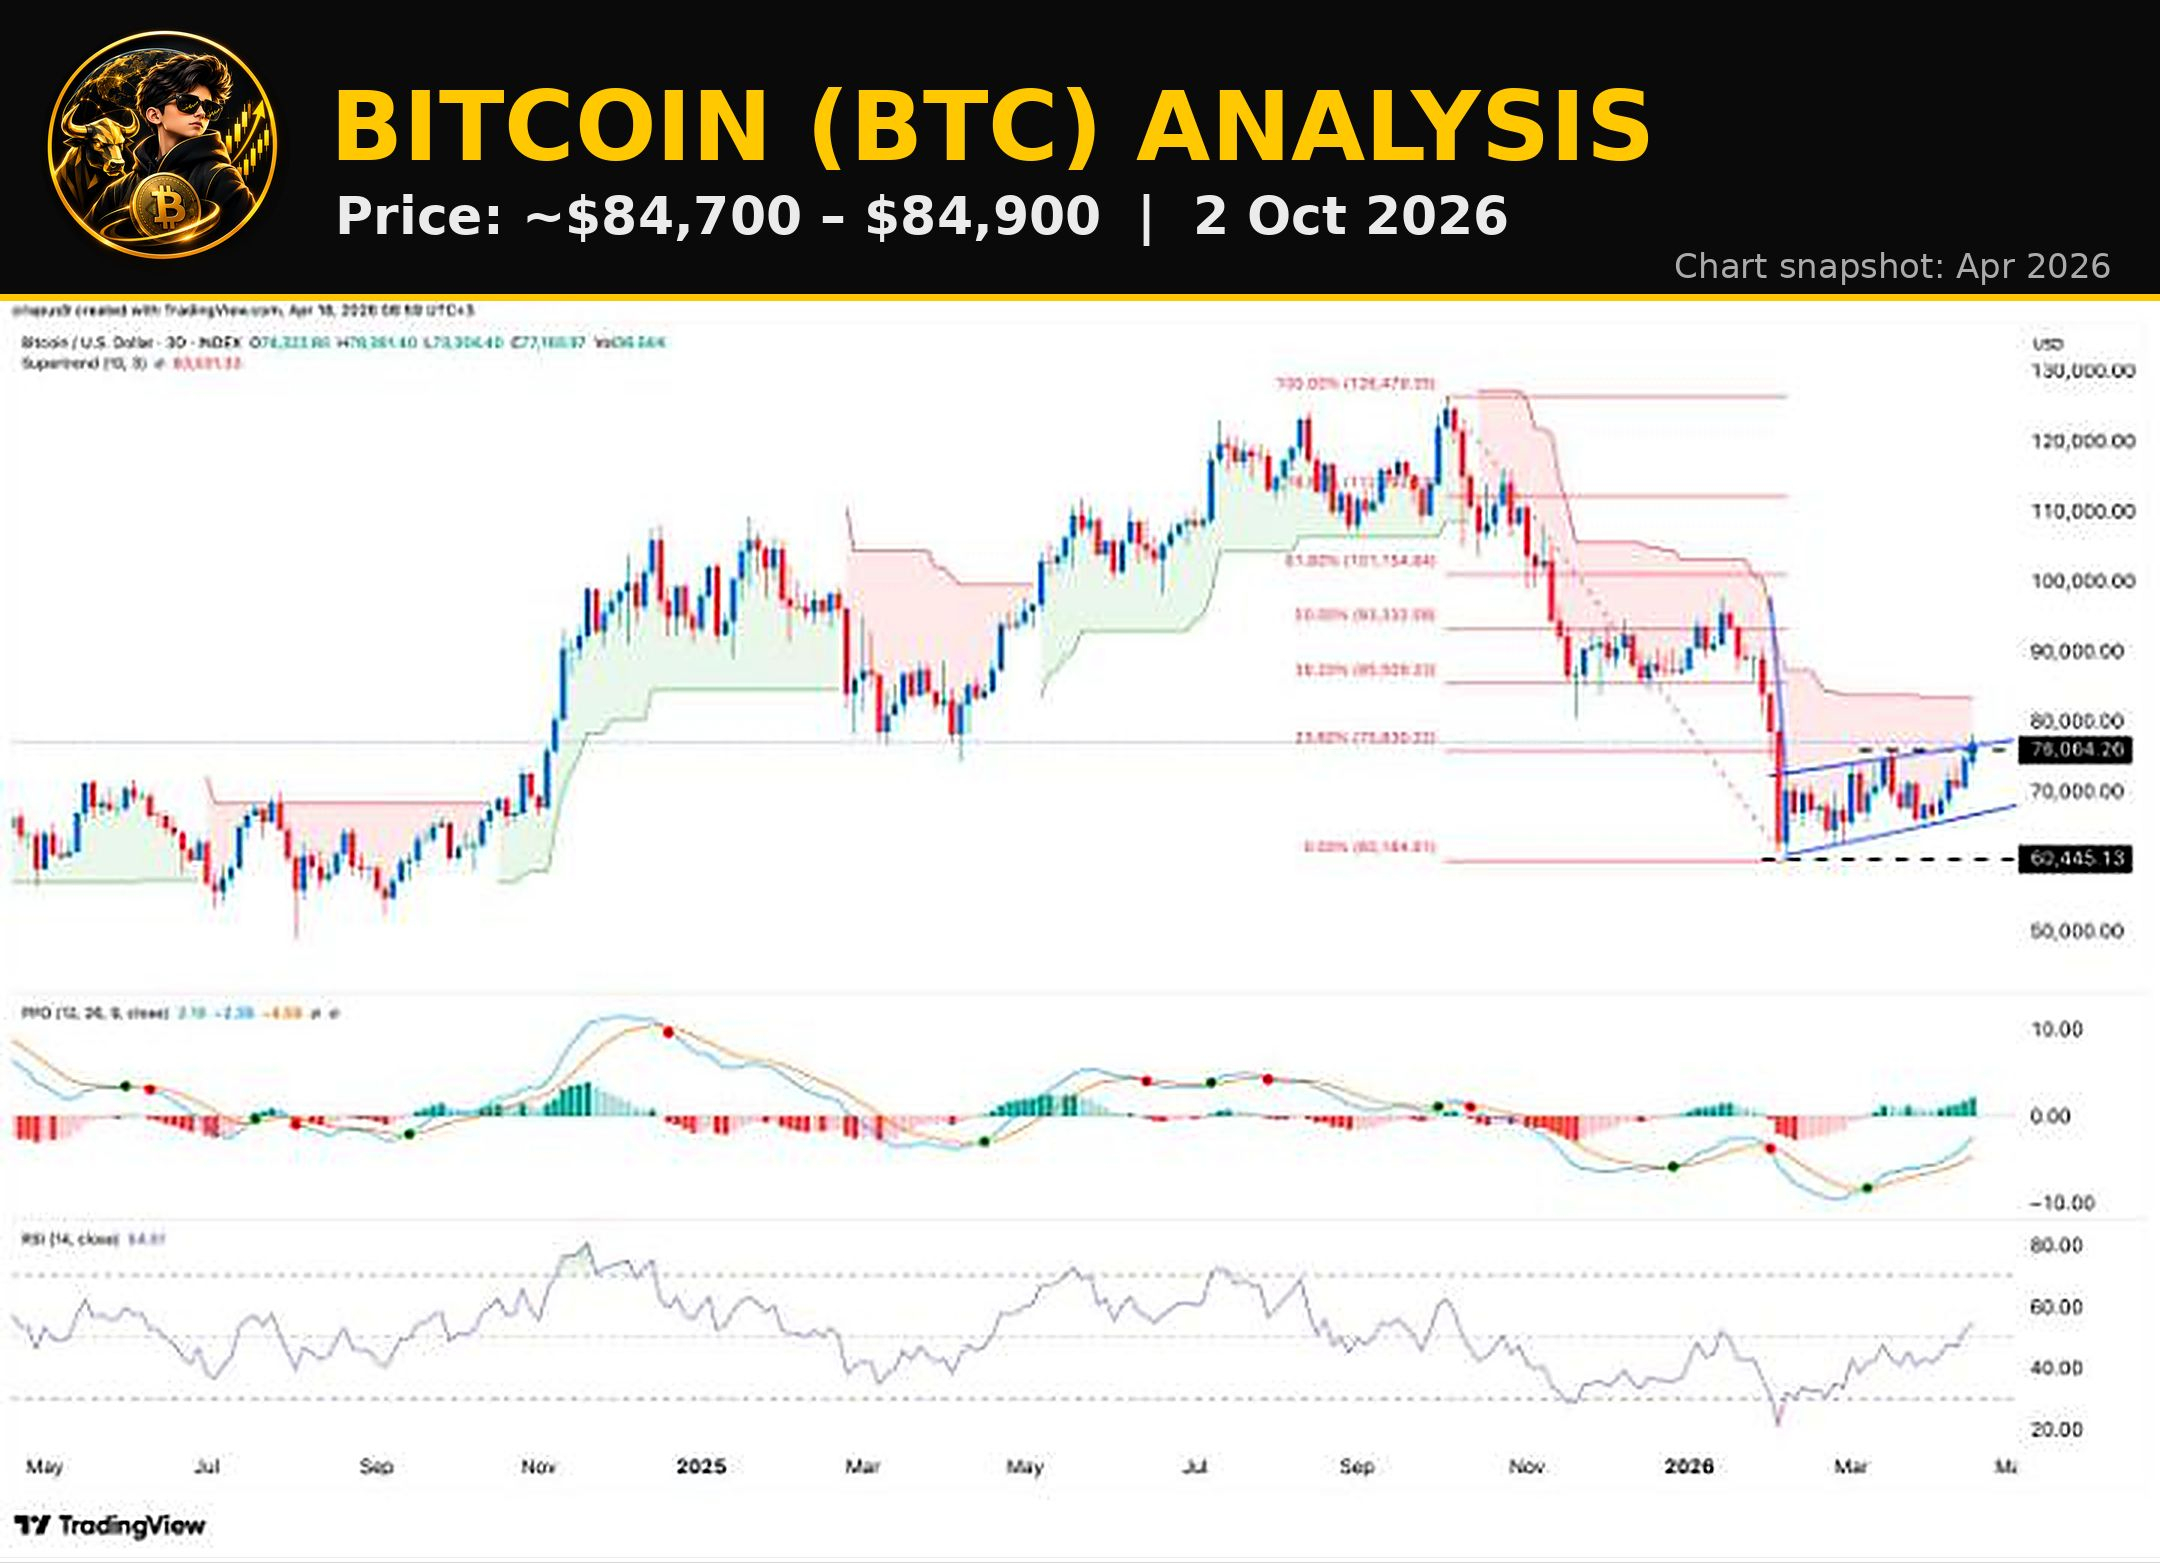
🟠 Bitcoin $BTC — Latest Analysis
🗓️ 2 October 2026
₿ Bitcoin is currently the #1 cryptocurrency by market capitalization.
BTC is trading around $84,700–$84,900, with the recent 24-hour range around $83,100–$85,200.
📊 Key Levels to Watch
🔴 Resistance: $86,000–$87,400
🟢 Support: $82,000–$82,900
🟢 Major Support: Around $80,000
A sustained move above $87,400 would bring the recent high zone back into focus.
A daily close below $82,000 would weaken the short-term structure and could bring the $80,000 area into focus.
📰 What Is Moving BTC Today?
Bitcoin has entered October after a strong Q3 rebound. U.S. Treasury yields, Federal Reserve rate expectations and ETF flows remain important factors for the market.
U.S. spot Bitcoin ETFs recorded a $148.7M net outflow on September 30, ending a nine-session inflow streak that had brought in more than $3B.
At the same time, Citigroup raised its 12-month Bitcoin forecast to $113,000, citing stronger crypto activity, supportive macro conditions and renewed ETF inflows. This is Citi's forecast, not a guaranteed price target.
📌 Bottom Line
BTC is currently testing the upper part of its recent range.
For the short term:
🟢 $82K–$83K = Important Support Zone
🔴 $86K–$87.4K = Key Resistance Zone
⚠️ This is market analysis for educational purposes, not financial advice or a guaranteed prediction.
#Bitcoin #BTC #Crypto #Cryptocurrency #BitcoinNews #BitcoinAnalysis #BTCUSD #CryptoNews #CryptoMarket #BitcoinPrice #Blockchain #DigitalAssets
{future}(BTCUSDT)
🟠 Bitcoin $BTC — Latest Analysis
🗓️ 2 October 2026
₿ Bitcoin is currently the #1 cryptocurrency by market capitalization.
BTC is trading around $84,700–$84,900, with the recent 24-hour range around $83,100–$85,200.
📊 Key Levels to Watch
🔴 Resistance: $86,000–$87,400
🟢 Support: $82,000–$82,900
🟢 Major Support: Around $80,000
A sustained move above $87,400 would bring the recent high zone back into focus.
A daily close below $82,000 would weaken the short-term structure and could bring the $80,000 area into focus.
📰 What Is Moving BTC Today?
Bitcoin has entered October after a strong Q3 rebound. U.S. Treasury yields, Federal Reserve rate expectations and ETF flows remain important factors for the market.
U.S. spot Bitcoin ETFs recorded a $148.7M net outflow on September 30, ending a nine-session inflow streak that had brought in more than $3B.
At the same time, Citigroup raised its 12-month Bitcoin forecast to $113,000, citing stronger crypto activity, supportive macro conditions and renewed ETF inflows. This is Citi's forecast, not a guaranteed price target.
📌 Bottom Line
BTC is currently testing the upper part of its recent range.
For the short term:
🟢 $82K–$83K = Important Support Zone
🔴 $86K–$87.4K = Key Resistance Zone
⚠️ This is market analysis for educational purposes, not financial advice or a guaranteed prediction.
#Bitcoin #BTC #Crypto #Cryptocurrency #BitcoinNews #BitcoinAnalysis #BTCUSD #CryptoNews #CryptoMarket #BitcoinPrice #Blockchain #DigitalAssets
🗓️ 2 October 2026
₿ Bitcoin is currently the #1 cryptocurrency by market capitalization.
BTC is trading around $84,700–$84,900, with the recent 24-hour range around $83,100–$85,200.
📊 Key Levels to Watch
🔴 Resistance: $86,000–$87,400
🟢 Support: $82,000–$82,900
🟢 Major Support: Around $80,000
A sustained move above $87,400 would bring the recent high zone back into focus.
A daily close below $82,000 would weaken the short-term structure and could bring the $80,000 area into focus.
📰 What Is Moving BTC Today?
Bitcoin has entered October after a strong Q3 rebound. U.S. Treasury yields, Federal Reserve rate expectations and ETF flows remain important factors for the market.
U.S. spot Bitcoin ETFs recorded a $148.7M net outflow on September 30, ending a nine-session inflow streak that had brought in more than $3B.
At the same time, Citigroup raised its 12-month Bitcoin forecast to $113,000, citing stronger crypto activity, supportive macro conditions and renewed ETF inflows. This is Citi's forecast, not a guaranteed price target.
📌 Bottom Line
BTC is currently testing the upper part of its recent range.
For the short term:
🟢 $82K–$83K = Important Support Zone
🔴 $86K–$87.4K = Key Resistance Zone
⚠️ This is market analysis for educational purposes, not financial advice or a guaranteed prediction.
#Bitcoin #BTC #Crypto #Cryptocurrency #BitcoinNews #BitcoinAnalysis #BTCUSD #CryptoNews #CryptoMarket #BitcoinPrice #Blockchain #DigitalAssets
83
Connectez-vous pour découvrir plus de contenu
Rejoignez la communauté mondiale des adeptes de cryptomonnaies sur Binance Square
⚡️ Suviez les dernières informations importantes sur les cryptomonnaies.
💬 Jugé digne de confiance par la plus grande plateforme d’échange de cryptomonnaies au monde.
👍 Découvrez les connaissances que partagent les créateurs vérifiés.
Adresse e-mail/Nº de téléphone
Sujets d’actualité
BitcoinRejectedAt$87K
8,129 vues
39 mentions
$BTC Mise à jour 🚨 🐼 Ignorez CET Avertissement à vos risques et périls ⚠️
Le BTC frappe à la porte des 87K comme s’il en était déjà propriétaire 😂 Les haussiers sont réveillés… mais le BTC aime généralement faire sortir quelques personnes avant le vrai mouvement.
Globalement, le BTC sort du range et la vue en timeframe supérieure reste haussière. La structure en 4H et en daily est solide, le prix tient au-dessus des moyennes majeures, et l’élan soutient encore le mouvement.
83K était honnêtement un superbe niveau d’achat. C’était la zone où le ratio risque/récompense faisait vraiment sens. Ceux qui ont acheté là sont déjà en train de profiter
Maintenant, on passe au principal
Le BTC est juste sous le précédent plus haut autour de 87K. Donc je ne serais pas surpris qu’on voie d’abord une petite chasse à la liquidité vers le bas, qu’on flush quelques longs en retard, puis que le BTC décide s’il veut vraiment la cassure.
Pour le scalp d’aujourd’hui, voici mon Plan 👇
BTC SHORT (scalp) Entrée : 86,550–86,900
TP1 : 85,650
TP2 : 84,850
TP3 : 84,050
SL : 87,800
J’aime seulement ça si on obtient un rejet propre près des plus hauts. Pas de short aveugle.
Pour le contexte plus large, je reste haussier tant que la zone 82,5K–83K continue de tenir. Si le BTC fait une cassure nette et commence à être accepté au-dessus de 87,4K, alors toute cette idée de short est invalidée et la prochaine impulsion haussière devient beaucoup plus intéressante.
SO FONDAMENTALEMENT, OCTOBRE EST UN MOIS HISTORIQUEMENT HAUSSIER POUR LE BITCOIN.
FAITES TOUJOURS VOTRE PROPRE RECHERCHE (DYOR)
Panda Traders
·29 mentions J’aime
·12.7k vues
FedOctoberRateHikeOddsFallTo17%
9,168 vues
204 mentions
NvidiaHitsRecordHighUp2.4%
1,255 vues
123 mentions