

Abdul Wahab okz
18 Publications

Abdul Wahab okz
Signaler
Bloquer l’utilisateur
Ouvert au trading
Trade occasionnellement
2.9 an(s)
6 Suivis
31 Abonnés
29 J’aime
Publications
Portefeuille
Voir la traduction
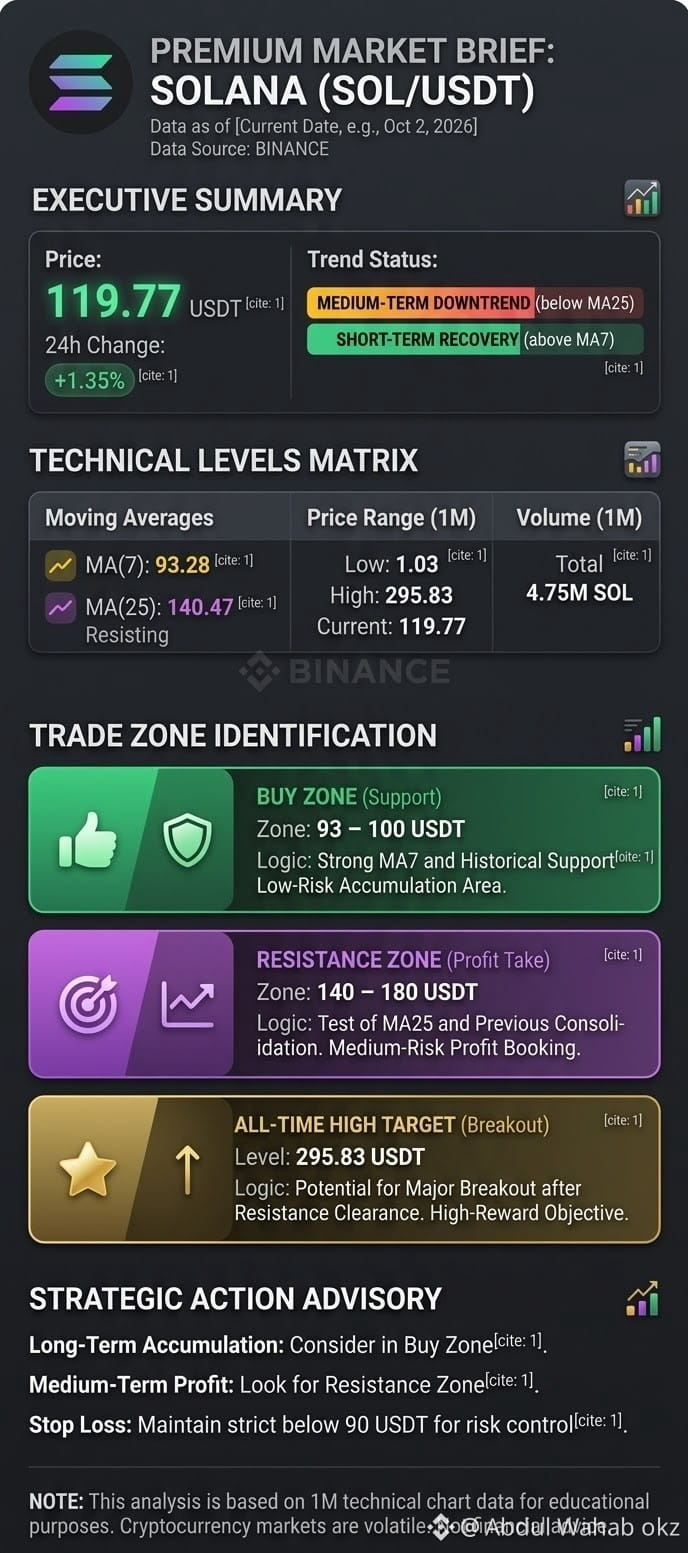
$SOL
When to take an Up Trade (Long / Buy)
If you want to buy, there are two ideal setups:
On Breakout Strategy:
When? When the SOL price moves above $141 and closes a 4-hour or 1-day candle above it.
Why? There is strong resistance at $140.47 (MA 25). A breakout above this level confirms strong buyers (bulls) pushing the price towards $180 – $200.
On Dip / Support Strategy:
When? If the price drops into the $93 – $100 zone.
Why? Strong support exists around $93.28 (MA 7). Buying here offers a low-risk entry.
2. When to take a Down Trade (Short / Sell)
If you want to sell or open a short trade:
On Resistance Rejection:
When? If the price reaches the $140 – $141 resistance area and faces repeated rejections (failing to break through).
Target: $117 first, followed by $100.
On Support Breakdown:
When? If the price breaks down below the current $117 support level.
Target: $93.
Final Advice
Current Price ($119.77): The price is right in the middle. Taking a trade here is risky because it can move in either direction.
Best Strategy: Either wait for the price to break above $141 or wait for a pullback to $93 – $100. #SolanaUSTD
{spot}(SOLUSDT)
$SOL
When to take an Up Trade (Long / Buy)
If you want to buy, there are two ideal setups:
On Breakout Strategy:
When? When the SOL price moves above $141 and closes a 4-hour or 1-day candle above it.
Why? There is strong resistance at $140.47 (MA 25). A breakout above this level confirms strong buyers (bulls) pushing the price towards $180 – $200.
On Dip / Support Strategy:
When? If the price drops into the $93 – $100 zone.
Why? Strong support exists around $93.28 (MA 7). Buying here offers a low-risk entry.
2. When to take a Down Trade (Short / Sell)
If you want to sell or open a short trade:
On Resistance Rejection:
When? If the price reaches the $140 – $141 resistance area and faces repeated rejections (failing to break through).
Target: $117 first, followed by $100.
On Support Breakdown:
When? If the price breaks down below the current $117 support level.
Target: $93.
Final Advice
Current Price ($119.77): The price is right in the middle. Taking a trade here is risky because it can move in either direction.
Best Strategy: Either wait for the price to break above $141 or wait for a pullback to $93 – $100. #SolanaUSTD
When to take an Up Trade (Long / Buy)
If you want to buy, there are two ideal setups:
On Breakout Strategy:
When? When the SOL price moves above $141 and closes a 4-hour or 1-day candle above it.
Why? There is strong resistance at $140.47 (MA 25). A breakout above this level confirms strong buyers (bulls) pushing the price towards $180 – $200.
On Dip / Support Strategy:
When? If the price drops into the $93 – $100 zone.
Why? Strong support exists around $93.28 (MA 7). Buying here offers a low-risk entry.
2. When to take a Down Trade (Short / Sell)
If you want to sell or open a short trade:
On Resistance Rejection:
When? If the price reaches the $140 – $141 resistance area and faces repeated rejections (failing to break through).
Target: $117 first, followed by $100.
On Support Breakdown:
When? If the price breaks down below the current $117 support level.
Target: $93.
Final Advice
Current Price ($119.77): The price is right in the middle. Taking a trade here is risky because it can move in either direction.
Best Strategy: Either wait for the price to break above $141 or wait for a pullback to $93 – $100. #SolanaUSTD
83
·
--
Haussier
Voir la traduction
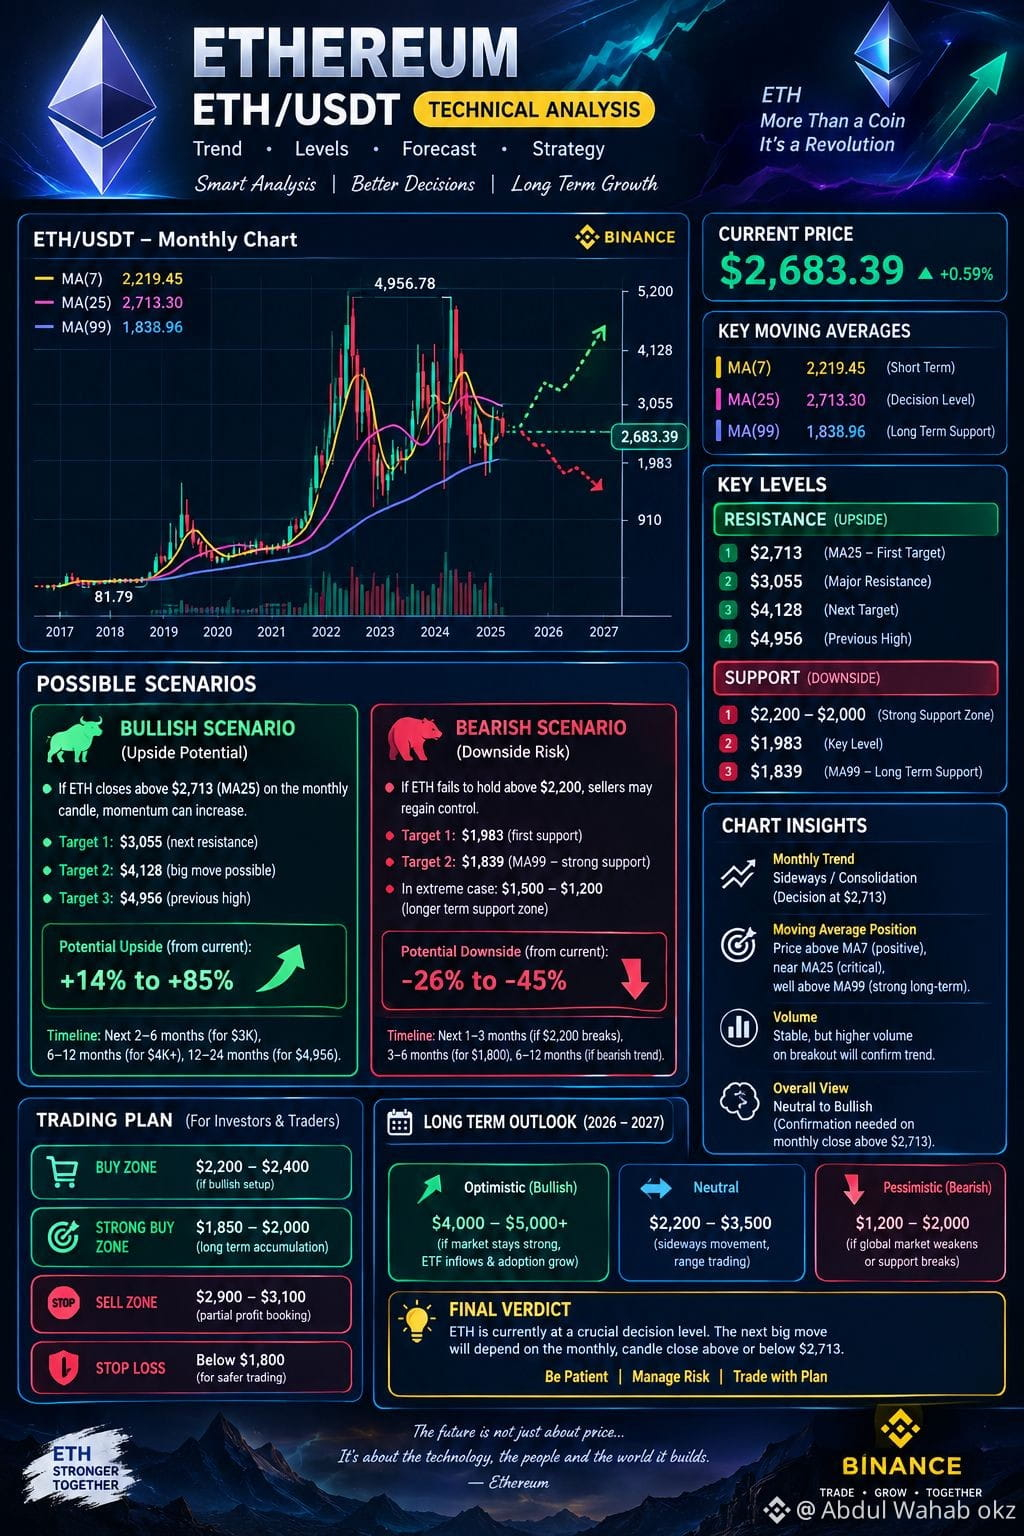
$ETH Ethereum is currently in a consolidation/recovery phase, rather than a clean one-direction trend.
Recent data shows ETH has gained roughly 12–15% over the last month, but short-term momentum has started to slow around the $2,700–$2,800 area. �
Coinlib +1
The most important near-term question is:
Can ETH break and hold above $2,800?
A sustained move above that area would strengthen the bullish scenario. A rejection there could send ETH back toward its support zones.
📈 Bullish Scenario
$2,800 → $3,000
This is the first major upside scenario.
Current technical commentary is also watching $2,800 resistance, with a successful breakout potentially opening the way toward $3,000. �
CoinMarketCap +1
If ETH breaks $2,800 with strong volume and holds it as support:
Possible path:
$2,800 → $2,900 → $3,000 → $3,050
The $3,000–$3,100 region could produce another period of profit-taking or consolidation.
Above $3,100
If ETH establishes itself above approximately $3,050–$3,100, the next major technical areas from your monthly chart become approximately:
$3,500
$4,100
$4,956 — previous major high on your chart
These are scenario levels, not guaranteed targets.
📉 Bearish Scenario
If ETH repeatedly fails around $2,750–$2,800 and Bitcoin/overall crypto sentiment weakens, ETH could experience a pullback.
First support: $2,500–$2,600
This is currently one of the important short-term areas to monitor. CMC's current analysis also identifies approximately $2,500 as near-term support and $2,800 as resistance.#BitcoinFundingRateTriplesTo10% #ETH🔥🔥🔥🔥🔥🔥
{spot}(ETHUSDT)
$ETH Ethereum is currently in a consolidation/recovery phase, rather than a clean one-direction trend.
Recent data shows ETH has gained roughly 12–15% over the last month, but short-term momentum has started to slow around the $2,700–$2,800 area. �
Coinlib +1
The most important near-term question is:
Can ETH break and hold above $2,800?
A sustained move above that area would strengthen the bullish scenario. A rejection there could send ETH back toward its support zones.
📈 Bullish Scenario
$2,800 → $3,000
This is the first major upside scenario.
Current technical commentary is also watching $2,800 resistance, with a successful breakout potentially opening the way toward $3,000. �
CoinMarketCap +1
If ETH breaks $2,800 with strong volume and holds it as support:
Possible path:
$2,800 → $2,900 → $3,000 → $3,050
The $3,000–$3,100 region could produce another period of profit-taking or consolidation.
Above $3,100
If ETH establishes itself above approximately $3,050–$3,100, the next major technical areas from your monthly chart become approximately:
$3,500
$4,100
$4,956 — previous major high on your chart
These are scenario levels, not guaranteed targets.
📉 Bearish Scenario
If ETH repeatedly fails around $2,750–$2,800 and Bitcoin/overall crypto sentiment weakens, ETH could experience a pullback.
First support: $2,500–$2,600
This is currently one of the important short-term areas to monitor. CMC's current analysis also identifies approximately $2,500 as near-term support and $2,800 as resistance.#BitcoinFundingRateTriplesTo10% #ETH🔥🔥🔥🔥🔥🔥
Recent data shows ETH has gained roughly 12–15% over the last month, but short-term momentum has started to slow around the $2,700–$2,800 area. �
Coinlib +1
The most important near-term question is:
Can ETH break and hold above $2,800?
A sustained move above that area would strengthen the bullish scenario. A rejection there could send ETH back toward its support zones.
📈 Bullish Scenario
$2,800 → $3,000
This is the first major upside scenario.
Current technical commentary is also watching $2,800 resistance, with a successful breakout potentially opening the way toward $3,000. �
CoinMarketCap +1
If ETH breaks $2,800 with strong volume and holds it as support:
Possible path:
$2,800 → $2,900 → $3,000 → $3,050
The $3,000–$3,100 region could produce another period of profit-taking or consolidation.
Above $3,100
If ETH establishes itself above approximately $3,050–$3,100, the next major technical areas from your monthly chart become approximately:
$3,500
$4,100
$4,956 — previous major high on your chart
These are scenario levels, not guaranteed targets.
📉 Bearish Scenario
If ETH repeatedly fails around $2,750–$2,800 and Bitcoin/overall crypto sentiment weakens, ETH could experience a pullback.
First support: $2,500–$2,600
This is currently one of the important short-term areas to monitor. CMC's current analysis also identifies approximately $2,500 as near-term support and $2,800 as resistance.#BitcoinFundingRateTriplesTo10% #ETH🔥🔥🔥🔥🔥🔥
59
$BITCOIN
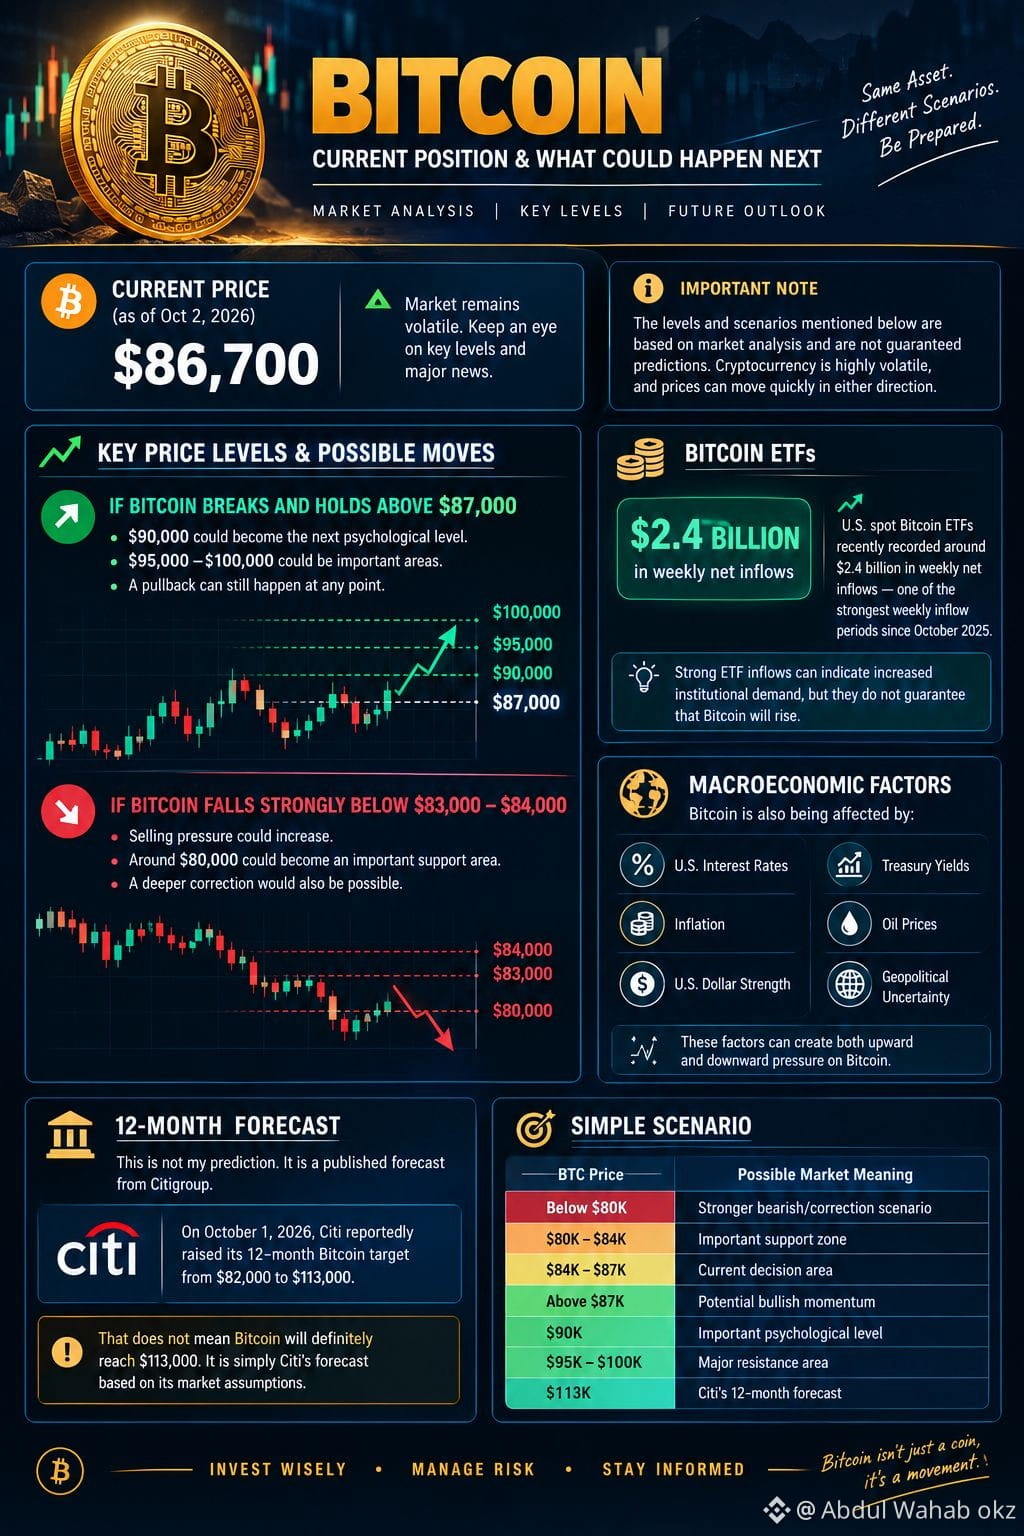
Si Bitcoin franchit et se maintient au-dessus de 87 000 $ :
90 000 $ pourrait devenir le prochain niveau psychologique.
Après cela, 95 000 $–100 000 $ pourrait devenir des zones importantes.
Une correction à la baisse peut encore survenir à tout moment.
Si Bitcoin chute fortement en dessous de 83 000 $–84 000 $ :
La pression vendeuse pourrait augmenter.
Vers 80 000 $ pourrait se situer une zone de support importante.
Une correction plus profonde serait également possible.
Il s’agit de niveaux de référence, pas de prédictions garanties.
🏦 FNB Bitcoin
Les FNB américains au comptant sur le Bitcoin ont récemment enregistré environ 2,4 milliards de dollars de flux nets hebdomadaires, l’une des périodes de flux entrants hebdomadaires les plus fortes depuis octobre 2025.
Des afflux importants de FNB peuvent indiquer une demande accrue des institutions, mais cela ne garantit pas que le Bitcoin montera.
💵 Taux d’intérêt & économie mondiale
Le Bitcoin est aussi influencé par :
Les taux d’intérêt américains
L’inflation
La force du dollar américain
Les rendements des bons du Trésor
Les prix du pétrole
L’incertitude géopolitique
Ces facteurs peuvent créer à la fois des pressions à la hausse et à la baisse sur le Bitcoin.
🔮 Prévision sur 12 mois
Ce n’est pas ma prédiction. Il s’agit d’une prévision publiée par Citigroup.
Le 1er octobre 2026, Citi aurait relevé son objectif Bitcoin à 12 mois de 82 000 $ à 113 000 $.
Cela ne signifie pas que le Bitcoin atteindra forcément 113 000 $. C’est simplement la prévision de Citi, basée sur ses hypothèses de marché.
Scénario simple
Prix du BTC
Signification possible du marché
Sous 80K
Scénario baissier/correction plus fort
80K–84K
Zone de support importante
84K–87K
Zone de décision actuelle
Au-dessus de 87K
Élan haussier potentiel
90K
Niveau psychologique important
95K–100K
Zone de résistance majeure
113K
Prévision à 12 mois de Citi
Important : Les cryptos sont extrêmement volatiles. Ces niveaux doivent être considérés comme une analyse plutôt que comme des résultats garantis.
Si vous me donnez votre montant d’investissement (par ex. 100 $, 500 $, 1 000 $) et si vous souhaitez du Spot ou des Futures, je peux expliquer des zones d’entrée possibles, les niveaux de risque et différents scénarios pour le BTC.#EthereumFoundationLaunchesZkAPIOnMainnet #bitcoin
$BITCOIN
Si Bitcoin franchit et se maintient au-dessus de 87 000 $ :
90 000 $ pourrait devenir le prochain niveau psychologique.
Après cela, 95 000 $–100 000 $ pourrait devenir des zones importantes.
Une correction à la baisse peut encore survenir à tout moment.
Si Bitcoin chute fortement en dessous de 83 000 $–84 000 $ :
La pression vendeuse pourrait augmenter.
Vers 80 000 $ pourrait se situer une zone de support importante.
Une correction plus profonde serait également possible.
Il s’agit de niveaux de référence, pas de prédictions garanties.
🏦 FNB Bitcoin
Les FNB américains au comptant sur le Bitcoin ont récemment enregistré environ 2,4 milliards de dollars de flux nets hebdomadaires, l’une des périodes de flux entrants hebdomadaires les plus fortes depuis octobre 2025.
Des afflux importants de FNB peuvent indiquer une demande accrue des institutions, mais cela ne garantit pas que le Bitcoin montera.
💵 Taux d’intérêt & économie mondiale
Le Bitcoin est aussi influencé par :
Les taux d’intérêt américains
L’inflation
La force du dollar américain
Les rendements des bons du Trésor
Les prix du pétrole
L’incertitude géopolitique
Ces facteurs peuvent créer à la fois des pressions à la hausse et à la baisse sur le Bitcoin.
🔮 Prévision sur 12 mois
Ce n’est pas ma prédiction. Il s’agit d’une prévision publiée par Citigroup.
Le 1er octobre 2026, Citi aurait relevé son objectif Bitcoin à 12 mois de 82 000 $ à 113 000 $.
Cela ne signifie pas que le Bitcoin atteindra forcément 113 000 $. C’est simplement la prévision de Citi, basée sur ses hypothèses de marché.
Scénario simple
Prix du BTC
Signification possible du marché
Sous 80K
Scénario baissier/correction plus fort
80K–84K
Zone de support importante
84K–87K
Zone de décision actuelle
Au-dessus de 87K
Élan haussier potentiel
90K
Niveau psychologique important
95K–100K
Zone de résistance majeure
113K
Prévision à 12 mois de Citi
Important : Les cryptos sont extrêmement volatiles. Ces niveaux doivent être considérés comme une analyse plutôt que comme des résultats garantis.
Si vous me donnez votre montant d’investissement (par ex. 100 $, 500 $, 1 000 $) et si vous souhaitez du Spot ou des Futures, je peux expliquer des zones d’entrée possibles, les niveaux de risque et différents scénarios pour le BTC.#EthereumFoundationLaunchesZkAPIOnMainnet #bitcoin
Si Bitcoin franchit et se maintient au-dessus de 87 000 $ :
90 000 $ pourrait devenir le prochain niveau psychologique.
Après cela, 95 000 $–100 000 $ pourrait devenir des zones importantes.
Une correction à la baisse peut encore survenir à tout moment.
Si Bitcoin chute fortement en dessous de 83 000 $–84 000 $ :
La pression vendeuse pourrait augmenter.
Vers 80 000 $ pourrait se situer une zone de support importante.
Une correction plus profonde serait également possible.
Il s’agit de niveaux de référence, pas de prédictions garanties.
🏦 FNB Bitcoin
Les FNB américains au comptant sur le Bitcoin ont récemment enregistré environ 2,4 milliards de dollars de flux nets hebdomadaires, l’une des périodes de flux entrants hebdomadaires les plus fortes depuis octobre 2025.
Des afflux importants de FNB peuvent indiquer une demande accrue des institutions, mais cela ne garantit pas que le Bitcoin montera.
💵 Taux d’intérêt & économie mondiale
Le Bitcoin est aussi influencé par :
Les taux d’intérêt américains
L’inflation
La force du dollar américain
Les rendements des bons du Trésor
Les prix du pétrole
L’incertitude géopolitique
Ces facteurs peuvent créer à la fois des pressions à la hausse et à la baisse sur le Bitcoin.
🔮 Prévision sur 12 mois
Ce n’est pas ma prédiction. Il s’agit d’une prévision publiée par Citigroup.
Le 1er octobre 2026, Citi aurait relevé son objectif Bitcoin à 12 mois de 82 000 $ à 113 000 $.
Cela ne signifie pas que le Bitcoin atteindra forcément 113 000 $. C’est simplement la prévision de Citi, basée sur ses hypothèses de marché.
Scénario simple
Prix du BTC
Signification possible du marché
Sous 80K
Scénario baissier/correction plus fort
80K–84K
Zone de support importante
84K–87K
Zone de décision actuelle
Au-dessus de 87K
Élan haussier potentiel
90K
Niveau psychologique important
95K–100K
Zone de résistance majeure
113K
Prévision à 12 mois de Citi
Important : Les cryptos sont extrêmement volatiles. Ces niveaux doivent être considérés comme une analyse plutôt que comme des résultats garantis.
Si vous me donnez votre montant d’investissement (par ex. 100 $, 500 $, 1 000 $) et si vous souhaitez du Spot ou des Futures, je peux expliquer des zones d’entrée possibles, les niveaux de risque et différents scénarios pour le BTC.#EthereumFoundationLaunchesZkAPIOnMainnet #bitcoin
89
Voir la traduction
🔥 Ethereum ($ETH) — More Than Just a Coin
Ethereum remains one of the most important blockchain networks in the crypto space.
It powers:
✅ Smart Contracts
✅ DeFi
✅ NFTs
✅ Thousands of blockchain applications
💡 My Opinion: I believe Ethereum’s real strength is not just the ETH token, but the huge ecosystem being built on its blockchain. 🚀
ETH is definitely a project worth keeping on your watchlist. 👀
❓ What do you think — Can Ethereum outperform Bitcoin in the next major crypto move?
#ETH #Ethereum #Crypto #BinanceSquare $ETH
{spot}(ETHUSDT)
💡My Opinion: I believe Ethereum's real strength is not just the ETH token, but the huge ecosystem being built on its blockchain.
🔥 Ethereum ($ETH ) — More Than Just a Coin
Ethereum remains one of the most important blockchain networks in the crypto space.
It powers:
✅ Smart Contracts
✅ DeFi
✅ NFTs
✅ Thousands of blockchain applications
💡 My Opinion: I believe Ethereum’s real strength is not just the ETH token, but the huge ecosystem being built on its blockchain. 🚀
ETH is definitely a project worth keeping on your watchlist. 👀
❓ What do you think — Can Ethereum outperform Bitcoin in the next major crypto move?
#ETH #Ethereum #Crypto #BinanceSquare $ETH
💡My Opinion: I believe Ethereum's real strength is not just the ETH token, but the huge ecosystem being built on its blockchain.
Ethereum remains one of the most important blockchain networks in the crypto space.
It powers:
✅ Smart Contracts
✅ DeFi
✅ NFTs
✅ Thousands of blockchain applications
💡 My Opinion: I believe Ethereum’s real strength is not just the ETH token, but the huge ecosystem being built on its blockchain. 🚀
ETH is definitely a project worth keeping on your watchlist. 👀
❓ What do you think — Can Ethereum outperform Bitcoin in the next major crypto move?
#ETH #Ethereum #Crypto #BinanceSquare $ETH
💡My Opinion: I believe Ethereum's real strength is not just the ETH token, but the huge ecosystem being built on its blockchain.
47
·
--
Haussier
Voir la traduction
🚨 Bitcoin ($BTC) — The King of Crypto 👑
Bitcoin remains the #1 cryptocurrency by market cap and continues to dominate the crypto market.
📌 Why watch BTC?
• Largest crypto ecosystem
• Strongest market liquidity
• Often sets the direction for the wider market
The big question is:
🔥 Will BTC continue its next major move?
What do you think? 🐂 Bullish or 🐻 Bearish?
#BTC #Bitcoin
{spot}(BTCUSDT)
🚨 Bitcoin ($BTC) — The King of Crypto 👑
Bitcoin remains the #1 cryptocurrency by market cap and continues to dominate the crypto market.
📌 Why watch BTC?
• Largest crypto ecosystem
• Strongest market liquidity
• Often sets the direction for the wider market
The big question is:
🔥 Will BTC continue its next major move?
What do you think? 🐂 Bullish or 🐻 Bearish?
#BTC #Bitcoin
Bitcoin remains the #1 cryptocurrency by market cap and continues to dominate the crypto market.
📌 Why watch BTC?
• Largest crypto ecosystem
• Strongest market liquidity
• Often sets the direction for the wider market
The big question is:
🔥 Will BTC continue its next major move?
What do you think? 🐂 Bullish or 🐻 Bearish?
#BTC #Bitcoin
55
Voir la traduction
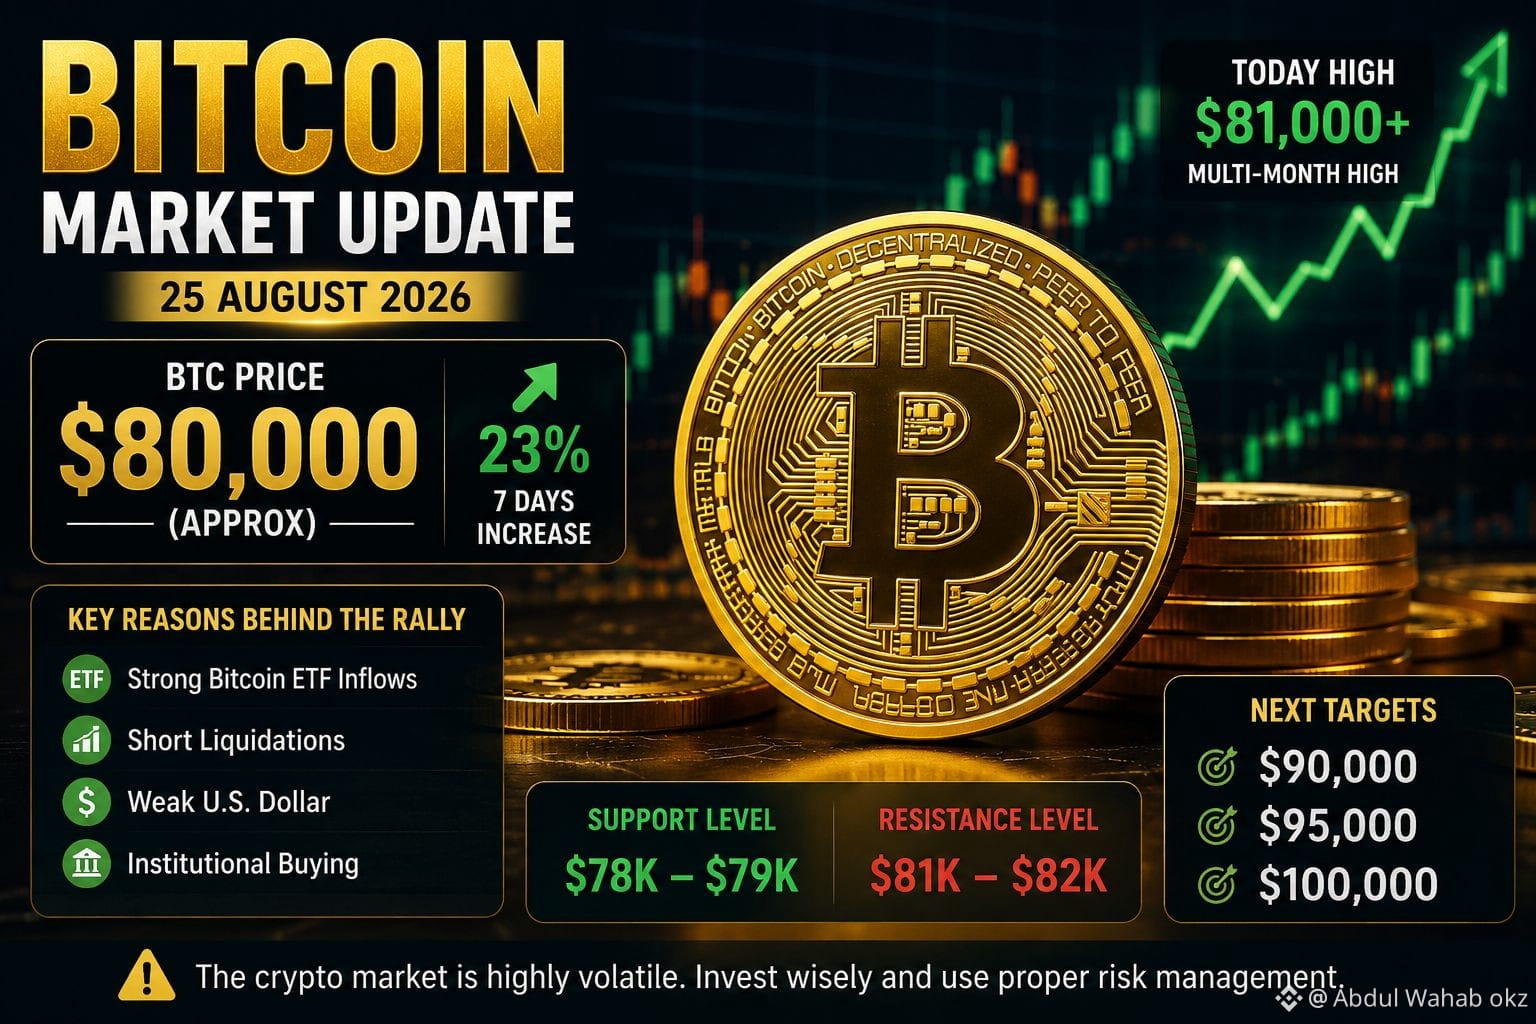
Bitcoin Update – August 25, 2026
#Bitcoin (BTC) is currently trading around $80,000.
Today, it also touched approximately $81,000+, reaching a multi-month high.
Over the past 7 days, Bitcoin has shown an increase of around 23%.
Major reasons behind this upward movement include Bitcoin ETF inflows, short liquidations, a weaker U.S. dollar, and institutional buying.
My Short Opinion
📈 The short-term trend is currently bullish, but since Bitcoin is near the $80K–$81K resistance zone, a sudden correction is also possible.
Important Levels
🔴 Resistance: $81K–$82K
🟢 Support: $78K–$79K
If a strong breakout continues, the next psychological targets could be $90K, followed by $95K–$100K.
Bitcoin Update – August 25, 2026
#Bitcoin (BTC) is currently trading around $80,000.
Today, it also touched approximately $81,000+, reaching a multi-month high.
Over the past 7 days, Bitcoin has shown an increase of around 23%.
Major reasons behind this upward movement include Bitcoin ETF inflows, short liquidations, a weaker U.S. dollar, and institutional buying.
My Short Opinion
📈 The short-term trend is currently bullish, but since Bitcoin is near the $80K–$81K resistance zone, a sudden correction is also possible.
Important Levels
🔴 Resistance: $81K–$82K
🟢 Support: $78K–$79K
If a strong breakout continues, the next psychological targets could be $90K, followed by $95K–$100K.
#Bitcoin (BTC) is currently trading around $80,000.
Today, it also touched approximately $81,000+, reaching a multi-month high.
Over the past 7 days, Bitcoin has shown an increase of around 23%.
Major reasons behind this upward movement include Bitcoin ETF inflows, short liquidations, a weaker U.S. dollar, and institutional buying.
My Short Opinion
📈 The short-term trend is currently bullish, but since Bitcoin is near the $80K–$81K resistance zone, a sudden correction is also possible.
Important Levels
🔴 Resistance: $81K–$82K
🟢 Support: $78K–$79K
If a strong breakout continues, the next psychological targets could be $90K, followed by $95K–$100K.
71
Voir la traduction
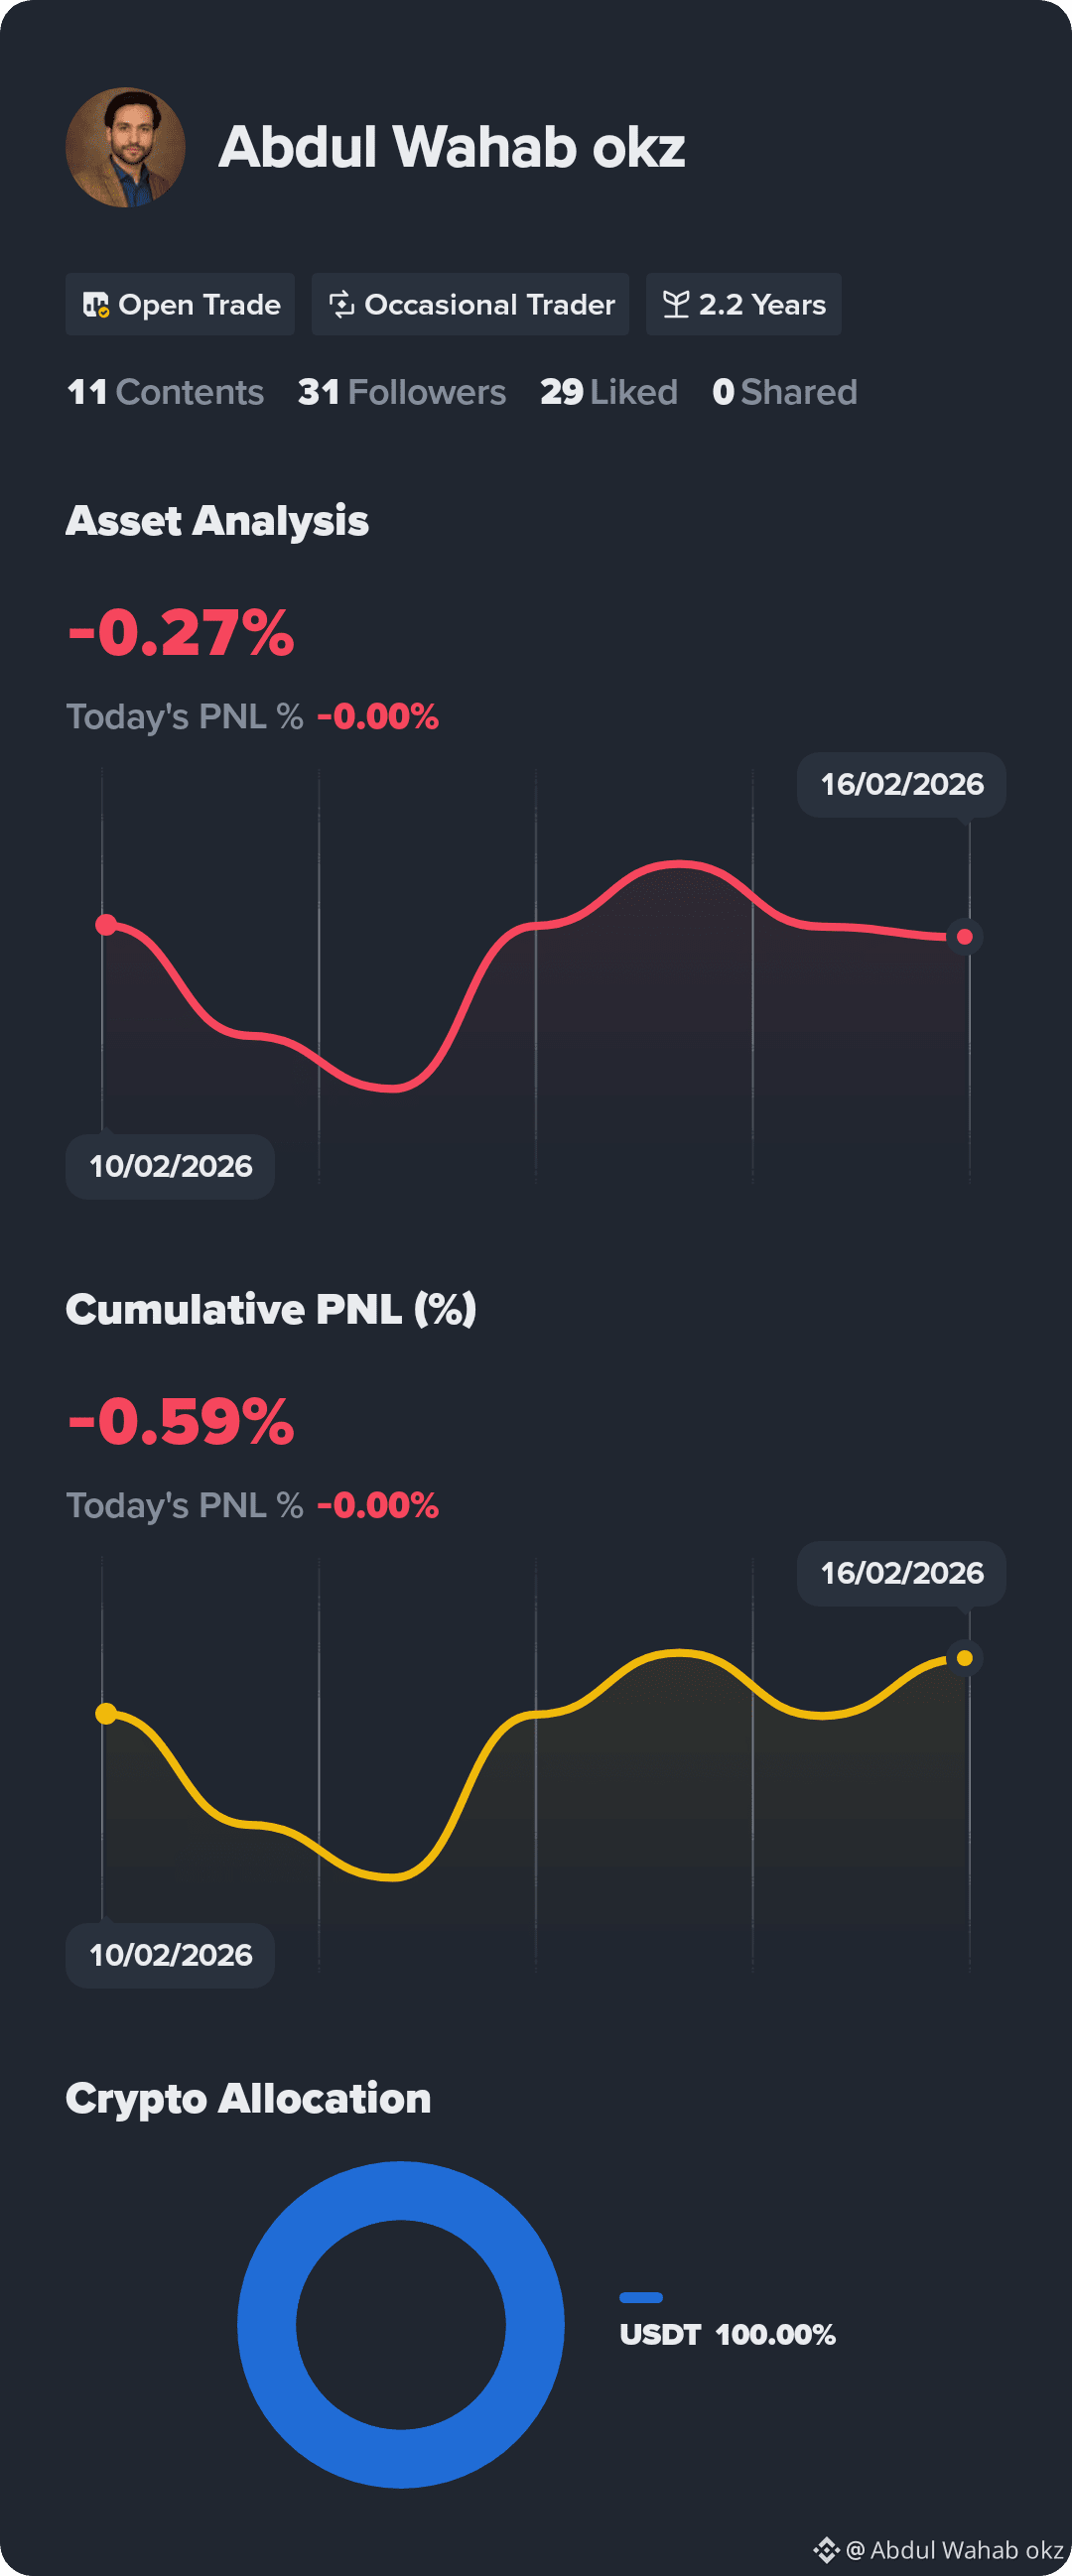
See my returns and portfolio breakdown. Follow for investment tips
See my returns and portfolio breakdown. Follow for investment tips
2
Voir la traduction
Current Market Situation
Right now, Bitcoin has been falling from recent highs and is much lower📉 Current Market Situation
$BTC Right now, Bitcoin has been falling from recent highs and is much lower than its peak from late 2025. This is part of what analysts call a bear market — a period where prices fall and stay lower for some time. Prices could continue to stay low or go lower before rising again.
Some experts even warn it could drop further before stabilizing.
📈 Long-Term Predictions — Very Mixed
Different analysts have very different forecasts for Bitcoin’s price:
📊 Bearish / Cautious Views
Some think BTC could drop toward lower levels before any big rise.
In the short term, demand may weaken, delaying a rally.
📊 Bullish / Optimistic Views
Other analysts have higher price predictions years ahead:
Some forecasts suggest Bitcoin could reach over $100,000 or $140,000+ by 2025–2026 if adoption increases.
In long-term scenarios (several years), some predict even much higher prices because supply is limited and demand may grow.
❗ But remember: These are all predictions, not guarantees.
📅 When Could Bitcoin Go Up?
Nobody can say exactly when BTC will go up. Price direction depends on many unpredictable factors like:
🔹 Global economy and interest rates
🔹 Institutional buying (big companies investing)
🔹 Legal regulations and crypto laws
🔹 Market sentiment (whether people are afraid or confident)
Some people think:
🟢 If prices find a bottom (lowest point) this year, a rise might start later in 2026–2027.
🔴 But in the near term (months only), price might stay sideways or decline further before any big rally.
💼 Investment Advice — Simple, Clear Logic
Here’s how most experienced investors think about Bitcoin:
✔️ If You Are a Long-Term Investor
You can invest small amounts regularly (called DCA — dollar cost averaging),
Do not invest money you might need soon,
Think in terms of years, not weeks or months.
Long-term investors believe BTC could grow over several years because supply is limited and institutional adoption may increase.
❌ If You Want Quick Profit
Short-term price predictions are very unreliable.
BTC could go up, but it could also stay down or fall again. Short-term trading is risky.
📌 Bottom Line (Simple Truth)
✅ Bitcoin has potential over the long term due to limited supply and adoption.
❌ Bitcoin is very volatile, and short-term price movements are unpredictable.
📉 It may go lower before it goes higher.
📈 It could rise significantly in the next few years, but no one knows for sure.
🧠 Smart Investment Rules
👉 Never invest money you can’t afford to lose
👉 Spread investments — don’t put all in one asset
👉 Learn basic chart and risk management skills
👉 Think long-term (years, not days)$BTC
{spot}(BTCUSDT)
#BTCFellBelow$69,000Again #OpenClawFounderJoinsOpenAI #PEPEBrokeThroughDowntrendLine #TradeCryptosOnX
Current Market Situation Right now, Bitcoin has been falling from recent highs and is much lower
📉 Current Market Situation
$BTC Right now, Bitcoin has been falling from recent highs and is much lower than its peak from late 2025. This is part of what analysts call a bear market — a period where prices fall and stay lower for some time. Prices could continue to stay low or go lower before rising again.
Some experts even warn it could drop further before stabilizing.
📈 Long-Term Predictions — Very Mixed
Different analysts have very different forecasts for Bitcoin’s price:
📊 Bearish / Cautious Views
Some think BTC could drop toward lower levels before any big rise.
In the short term, demand may weaken, delaying a rally.
📊 Bullish / Optimistic Views
Other analysts have higher price predictions years ahead:
Some forecasts suggest Bitcoin could reach over $100,000 or $140,000+ by 2025–2026 if adoption increases.
In long-term scenarios (several years), some predict even much higher prices because supply is limited and demand may grow.
❗ But remember: These are all predictions, not guarantees.
📅 When Could Bitcoin Go Up?
Nobody can say exactly when BTC will go up. Price direction depends on many unpredictable factors like:
🔹 Global economy and interest rates
🔹 Institutional buying (big companies investing)
🔹 Legal regulations and crypto laws
🔹 Market sentiment (whether people are afraid or confident)
Some people think:
🟢 If prices find a bottom (lowest point) this year, a rise might start later in 2026–2027.
🔴 But in the near term (months only), price might stay sideways or decline further before any big rally.
💼 Investment Advice — Simple, Clear Logic
Here’s how most experienced investors think about Bitcoin:
✔️ If You Are a Long-Term Investor
You can invest small amounts regularly (called DCA — dollar cost averaging),
Do not invest money you might need soon,
Think in terms of years, not weeks or months.
Long-term investors believe BTC could grow over several years because supply is limited and institutional adoption may increase.
❌ If You Want Quick Profit
Short-term price predictions are very unreliable.
BTC could go up, but it could also stay down or fall again. Short-term trading is risky.
📌 Bottom Line (Simple Truth)
✅ Bitcoin has potential over the long term due to limited supply and adoption.
❌ Bitcoin is very volatile, and short-term price movements are unpredictable.
📉 It may go lower before it goes higher.
📈 It could rise significantly in the next few years, but no one knows for sure.
🧠 Smart Investment Rules
👉 Never invest money you can’t afford to lose
👉 Spread investments — don’t put all in one asset
👉 Learn basic chart and risk management skills
👉 Think long-term (years, not days)$BTC
#BTCFellBelow$69,000Again #OpenClawFounderJoinsOpenAI #PEPEBrokeThroughDowntrendLine #TradeCryptosOnX
$BTC Right now, Bitcoin has been falling from recent highs and is much lower than its peak from late 2025. This is part of what analysts call a bear market — a period where prices fall and stay lower for some time. Prices could continue to stay low or go lower before rising again.
Some experts even warn it could drop further before stabilizing.
📈 Long-Term Predictions — Very Mixed
Different analysts have very different forecasts for Bitcoin’s price:
📊 Bearish / Cautious Views
Some think BTC could drop toward lower levels before any big rise.
In the short term, demand may weaken, delaying a rally.
📊 Bullish / Optimistic Views
Other analysts have higher price predictions years ahead:
Some forecasts suggest Bitcoin could reach over $100,000 or $140,000+ by 2025–2026 if adoption increases.
In long-term scenarios (several years), some predict even much higher prices because supply is limited and demand may grow.
❗ But remember: These are all predictions, not guarantees.
📅 When Could Bitcoin Go Up?
Nobody can say exactly when BTC will go up. Price direction depends on many unpredictable factors like:
🔹 Global economy and interest rates
🔹 Institutional buying (big companies investing)
🔹 Legal regulations and crypto laws
🔹 Market sentiment (whether people are afraid or confident)
Some people think:
🟢 If prices find a bottom (lowest point) this year, a rise might start later in 2026–2027.
🔴 But in the near term (months only), price might stay sideways or decline further before any big rally.
💼 Investment Advice — Simple, Clear Logic
Here’s how most experienced investors think about Bitcoin:
✔️ If You Are a Long-Term Investor
You can invest small amounts regularly (called DCA — dollar cost averaging),
Do not invest money you might need soon,
Think in terms of years, not weeks or months.
Long-term investors believe BTC could grow over several years because supply is limited and institutional adoption may increase.
❌ If You Want Quick Profit
Short-term price predictions are very unreliable.
BTC could go up, but it could also stay down or fall again. Short-term trading is risky.
📌 Bottom Line (Simple Truth)
✅ Bitcoin has potential over the long term due to limited supply and adoption.
❌ Bitcoin is very volatile, and short-term price movements are unpredictable.
📉 It may go lower before it goes higher.
📈 It could rise significantly in the next few years, but no one knows for sure.
🧠 Smart Investment Rules
👉 Never invest money you can’t afford to lose
👉 Spread investments — don’t put all in one asset
👉 Learn basic chart and risk management skills
👉 Think long-term (years, not days)$BTC
#BTCFellBelow$69,000Again #OpenClawFounderJoinsOpenAI #PEPEBrokeThroughDowntrendLine #TradeCryptosOnX
2
$Vanar$BTC vanarVanar
La chaîne redéfinit l'avenir de l'infrastructure Web3 🚀
@vanar n'est pas juste un autre projet de blockchain — il construit un écosystème Layer-1 dédié optimisé pour l'IA, le jeu, le métavers et les expériences numériques immersives. Dans un espace où de nombreuses chaînes éprouvent des difficultés avec la scalabilité et l'adoption dans le monde réel, Vanar Chain se concentre sur la haute performance, la faible latence et des outils conviviaux pour les développeurs, ce qui le rend idéal pour les applications de prochaine génération.
Ce qui rend Vanar unique, c'est sa vision claire : habiliter les créateurs, les développeurs et les entreprises à construire des mondes virtuels alimentés par l'IA sans limitations techniques. De la création d'actifs sans couture aux interactions efficaces sur la chaîne, l'écosystème Vanar est conçu pour une adoption de masse, pas pour la spéculation.
$Vanar
$BTC vanarVanar
La chaîne redéfinit l'avenir de l'infrastructure Web3 🚀
@vanar n'est pas juste un autre projet de blockchain — il construit un écosystème Layer-1 dédié optimisé pour l'IA, le jeu, le métavers et les expériences numériques immersives. Dans un espace où de nombreuses chaînes éprouvent des difficultés avec la scalabilité et l'adoption dans le monde réel, Vanar Chain se concentre sur la haute performance, la faible latence et des outils conviviaux pour les développeurs, ce qui le rend idéal pour les applications de prochaine génération.
Ce qui rend Vanar unique, c'est sa vision claire : habiliter les créateurs, les développeurs et les entreprises à construire des mondes virtuels alimentés par l'IA sans limitations techniques. De la création d'actifs sans couture aux interactions efficaces sur la chaîne, l'écosystème Vanar est conçu pour une adoption de masse, pas pour la spéculation.
La chaîne redéfinit l'avenir de l'infrastructure Web3 🚀
@vanar n'est pas juste un autre projet de blockchain — il construit un écosystème Layer-1 dédié optimisé pour l'IA, le jeu, le métavers et les expériences numériques immersives. Dans un espace où de nombreuses chaînes éprouvent des difficultés avec la scalabilité et l'adoption dans le monde réel, Vanar Chain se concentre sur la haute performance, la faible latence et des outils conviviaux pour les développeurs, ce qui le rend idéal pour les applications de prochaine génération.
Ce qui rend Vanar unique, c'est sa vision claire : habiliter les créateurs, les développeurs et les entreprises à construire des mondes virtuels alimentés par l'IA sans limitations techniques. De la création d'actifs sans couture aux interactions efficaces sur la chaîne, l'écosystème Vanar est conçu pour une adoption de masse, pas pour la spéculation.
3
11
Voir la traduction
#vanar $VANRY
Vanar ($VANRY) is building strong momentum in the Web3 gaming & AI space. With growing ecosystem adoption, real utility, and increasing community engagement, VANRY is positioning itself as a long-term infrastructure player rather than a hype token. Keep an eye on volume and key resistance levels.
#vanar $VANRY
Vanar ($VANRY) is building strong momentum in the Web3 gaming & AI space. With growing ecosystem adoption, real utility, and increasing community engagement, VANRY is positioning itself as a long-term infrastructure player rather than a hype token. Keep an eye on volume and key resistance levels.
Vanar ($VANRY) is building strong momentum in the Web3 gaming & AI space. With growing ecosystem adoption, real utility, and increasing community engagement, VANRY is positioning itself as a long-term infrastructure player rather than a hype token. Keep an eye on volume and key resistance levels.
2
4
$BTC chart
Leader du marché. Structure haussière forte à long terme. L'adoption des ETF et l'effet de halving soutiennent une croissance stable.
$BTC chart
Leader du marché. Structure haussière forte à long terme. L'adoption des ETF et l'effet de halving soutiennent une croissance stable.
Leader du marché. Structure haussière forte à long terme. L'adoption des ETF et l'effet de halving soutiennent une croissance stable.
13
·
--
Haussier
$ASTER
{spot}(ASTERUSDT)
Aster est le token natif de l'échange décentralisé Aster et de l'écosystème de trading perpétuel. Il vise à combiner le trading de dérivés au comptant + perpétuels avec des fonctionnalités avancées sur la chaîne, comme une exécution sans MEV, des ordres cachés et un support multi-chaînes. Le protocole prend en charge une utilisation efficace du capital (comme les tokens de staking liquide) et est soutenu par YZI Labs (anciennement Binance Labs). �
Date O H L C
--------------------------------
Jan 12 $0.72 0.75 0.70 0.74
Jan 13 $0.74 0.76 0.71 0.72
Jan 14 $0.72 0.75 0.69 0.70
Jan 15 $0.70 0.75 0.70 0.74
Jan 16 $0.74 0.75 0.71 0.73
$ASTER
Aster est le token natif de l'échange décentralisé Aster et de l'écosystème de trading perpétuel. Il vise à combiner le trading de dérivés au comptant + perpétuels avec des fonctionnalités avancées sur la chaîne, comme une exécution sans MEV, des ordres cachés et un support multi-chaînes. Le protocole prend en charge une utilisation efficace du capital (comme les tokens de staking liquide) et est soutenu par YZI Labs (anciennement Binance Labs). �
Date O H L C
--------------------------------
Jan 12 $0.72 0.75 0.70 0.74
Jan 13 $0.74 0.76 0.71 0.72
Jan 14 $0.72 0.75 0.69 0.70
Jan 15 $0.70 0.75 0.70 0.74
Jan 16 $0.74 0.75 0.71 0.73
Aster est le token natif de l'échange décentralisé Aster et de l'écosystème de trading perpétuel. Il vise à combiner le trading de dérivés au comptant + perpétuels avec des fonctionnalités avancées sur la chaîne, comme une exécution sans MEV, des ordres cachés et un support multi-chaînes. Le protocole prend en charge une utilisation efficace du capital (comme les tokens de staking liquide) et est soutenu par YZI Labs (anciennement Binance Labs). �
Date O H L C
--------------------------------
Jan 12 $0.72 0.75 0.70 0.74
Jan 13 $0.74 0.76 0.71 0.72
Jan 14 $0.72 0.75 0.69 0.70
Jan 15 $0.70 0.75 0.70 0.74
Jan 16 $0.74 0.75 0.71 0.73
14
$BTC
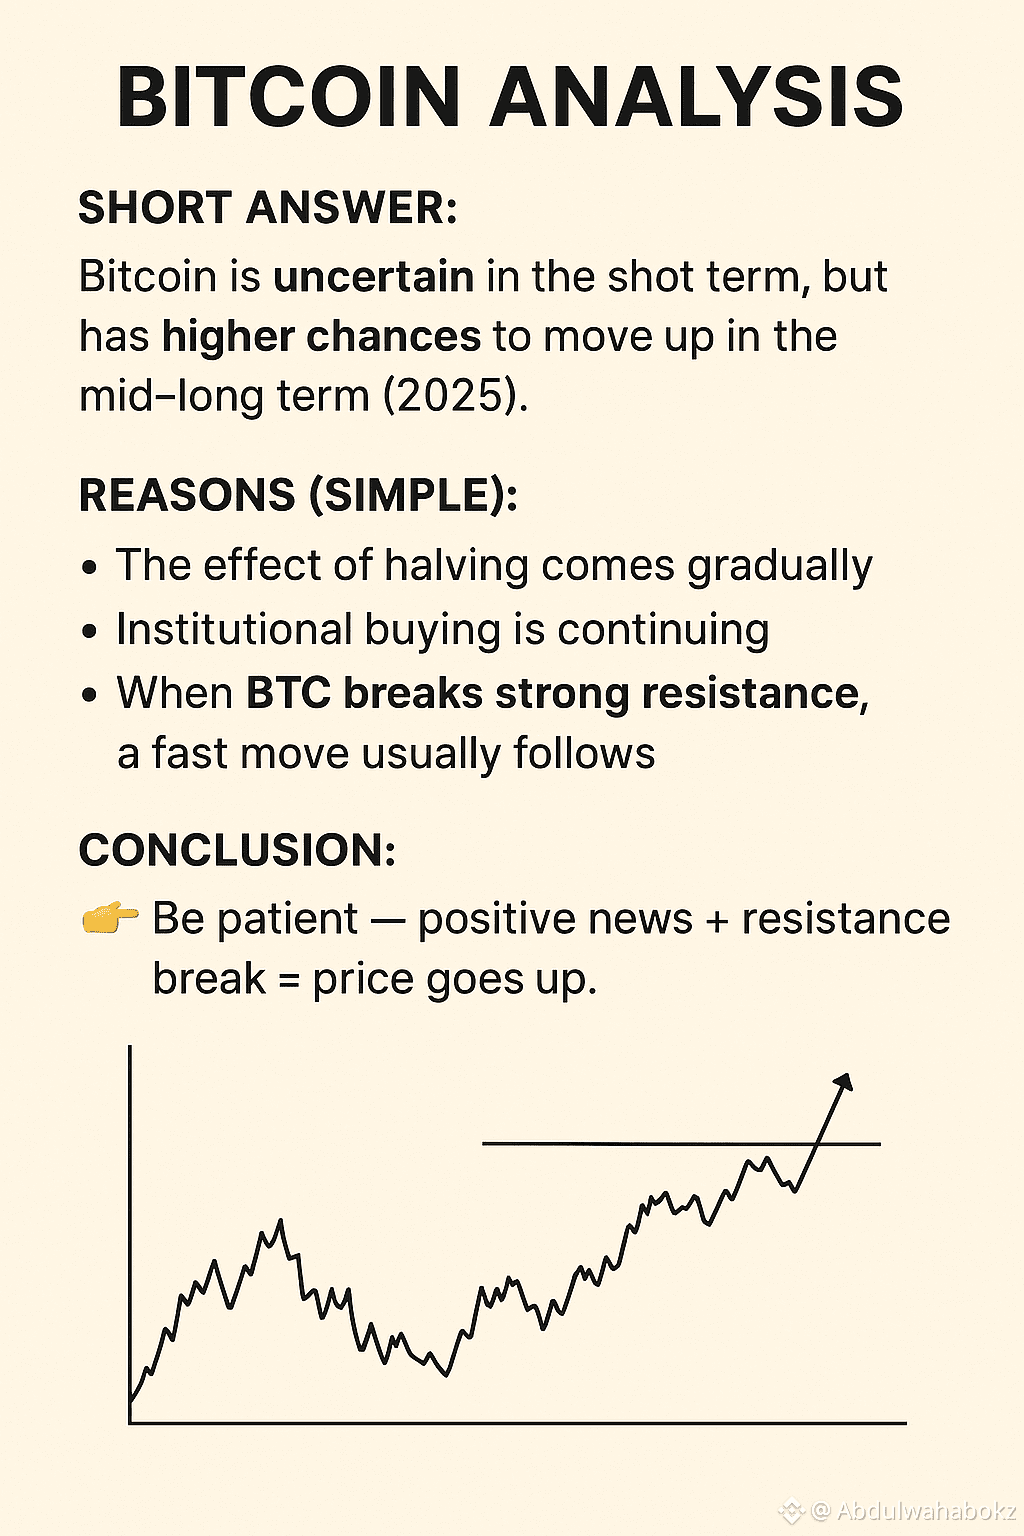
Réponse courte :
Le Bitcoin est incertain à court terme, mais a de meilleures chances d'augmenter à moyen–long terme (2025).
Raisons (simple) :
L'effet de la réduction des récompenses se fait sentir progressivement.
Les achats institutionnels continuent.
Lorsque le BTC franchit une forte résistance, un mouvement rapide suit généralement.
Conclusion :
👉 Soyez patient — nouvelles positives + rupture de résistance = augmentation du prix.
$BTC
Réponse courte :
Le Bitcoin est incertain à court terme, mais a de meilleures chances d'augmenter à moyen–long terme (2025).
Raisons (simple) :
L'effet de la réduction des récompenses se fait sentir progressivement.
Les achats institutionnels continuent.
Lorsque le BTC franchit une forte résistance, un mouvement rapide suit généralement.
Conclusion :
👉 Soyez patient — nouvelles positives + rupture de résistance = augmentation du prix.
Réponse courte :
Le Bitcoin est incertain à court terme, mais a de meilleures chances d'augmenter à moyen–long terme (2025).
Raisons (simple) :
L'effet de la réduction des récompenses se fait sentir progressivement.
Les achats institutionnels continuent.
Lorsque le BTC franchit une forte résistance, un mouvement rapide suit généralement.
Conclusion :
👉 Soyez patient — nouvelles positives + rupture de résistance = augmentation du prix.
17
Voir la traduction
$BTC
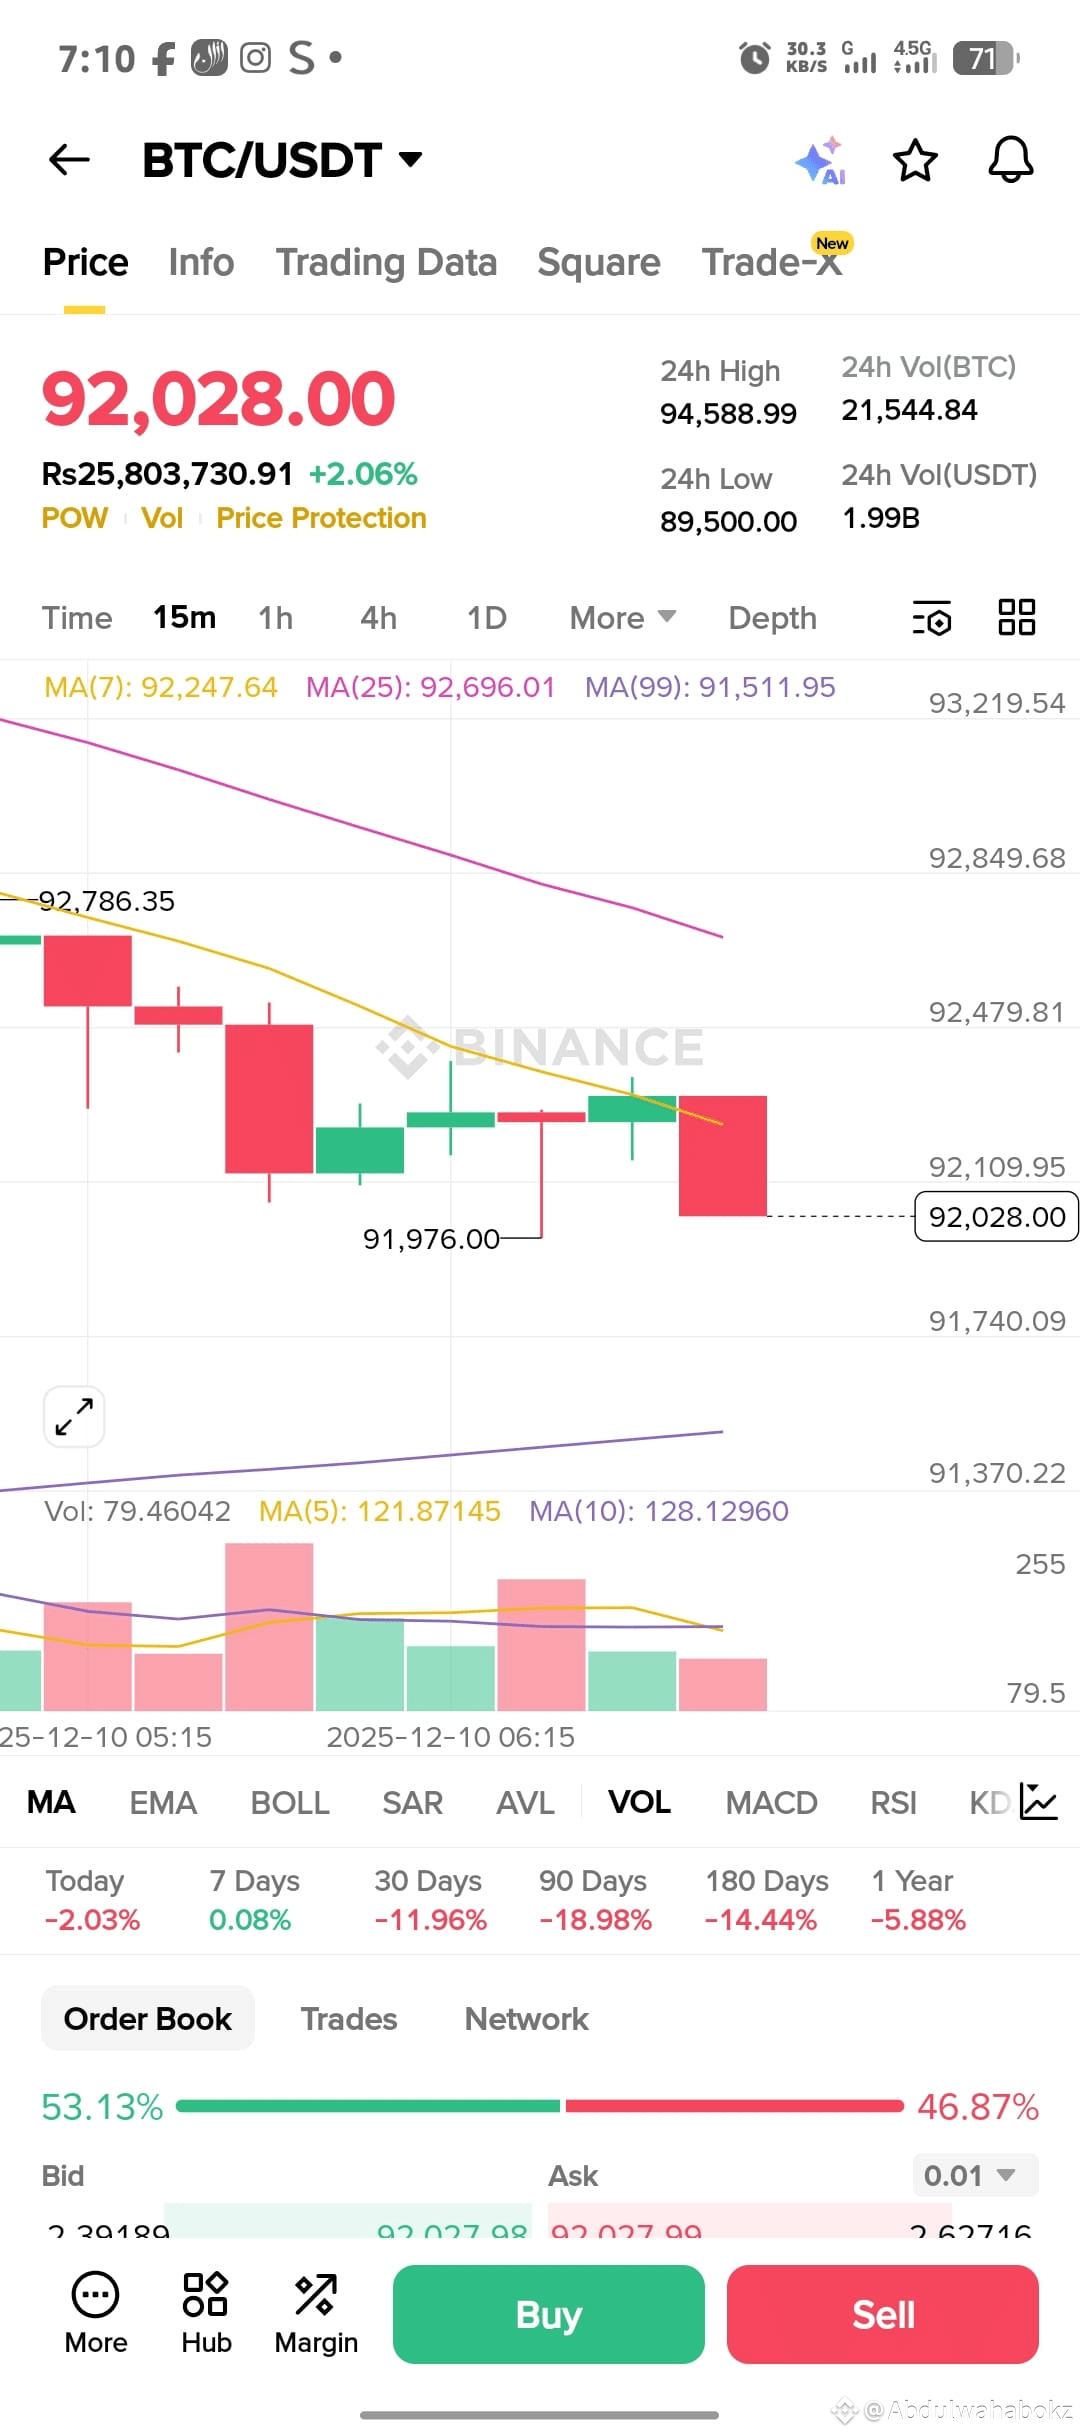
Bitcoin is a crypto asset, and its future price direction is uncertain — but here is the latest analysis on when it may “go up”.
✅ Current Situation & Short-Term Forecast
Right now, several models show a bearish or sideways trend.
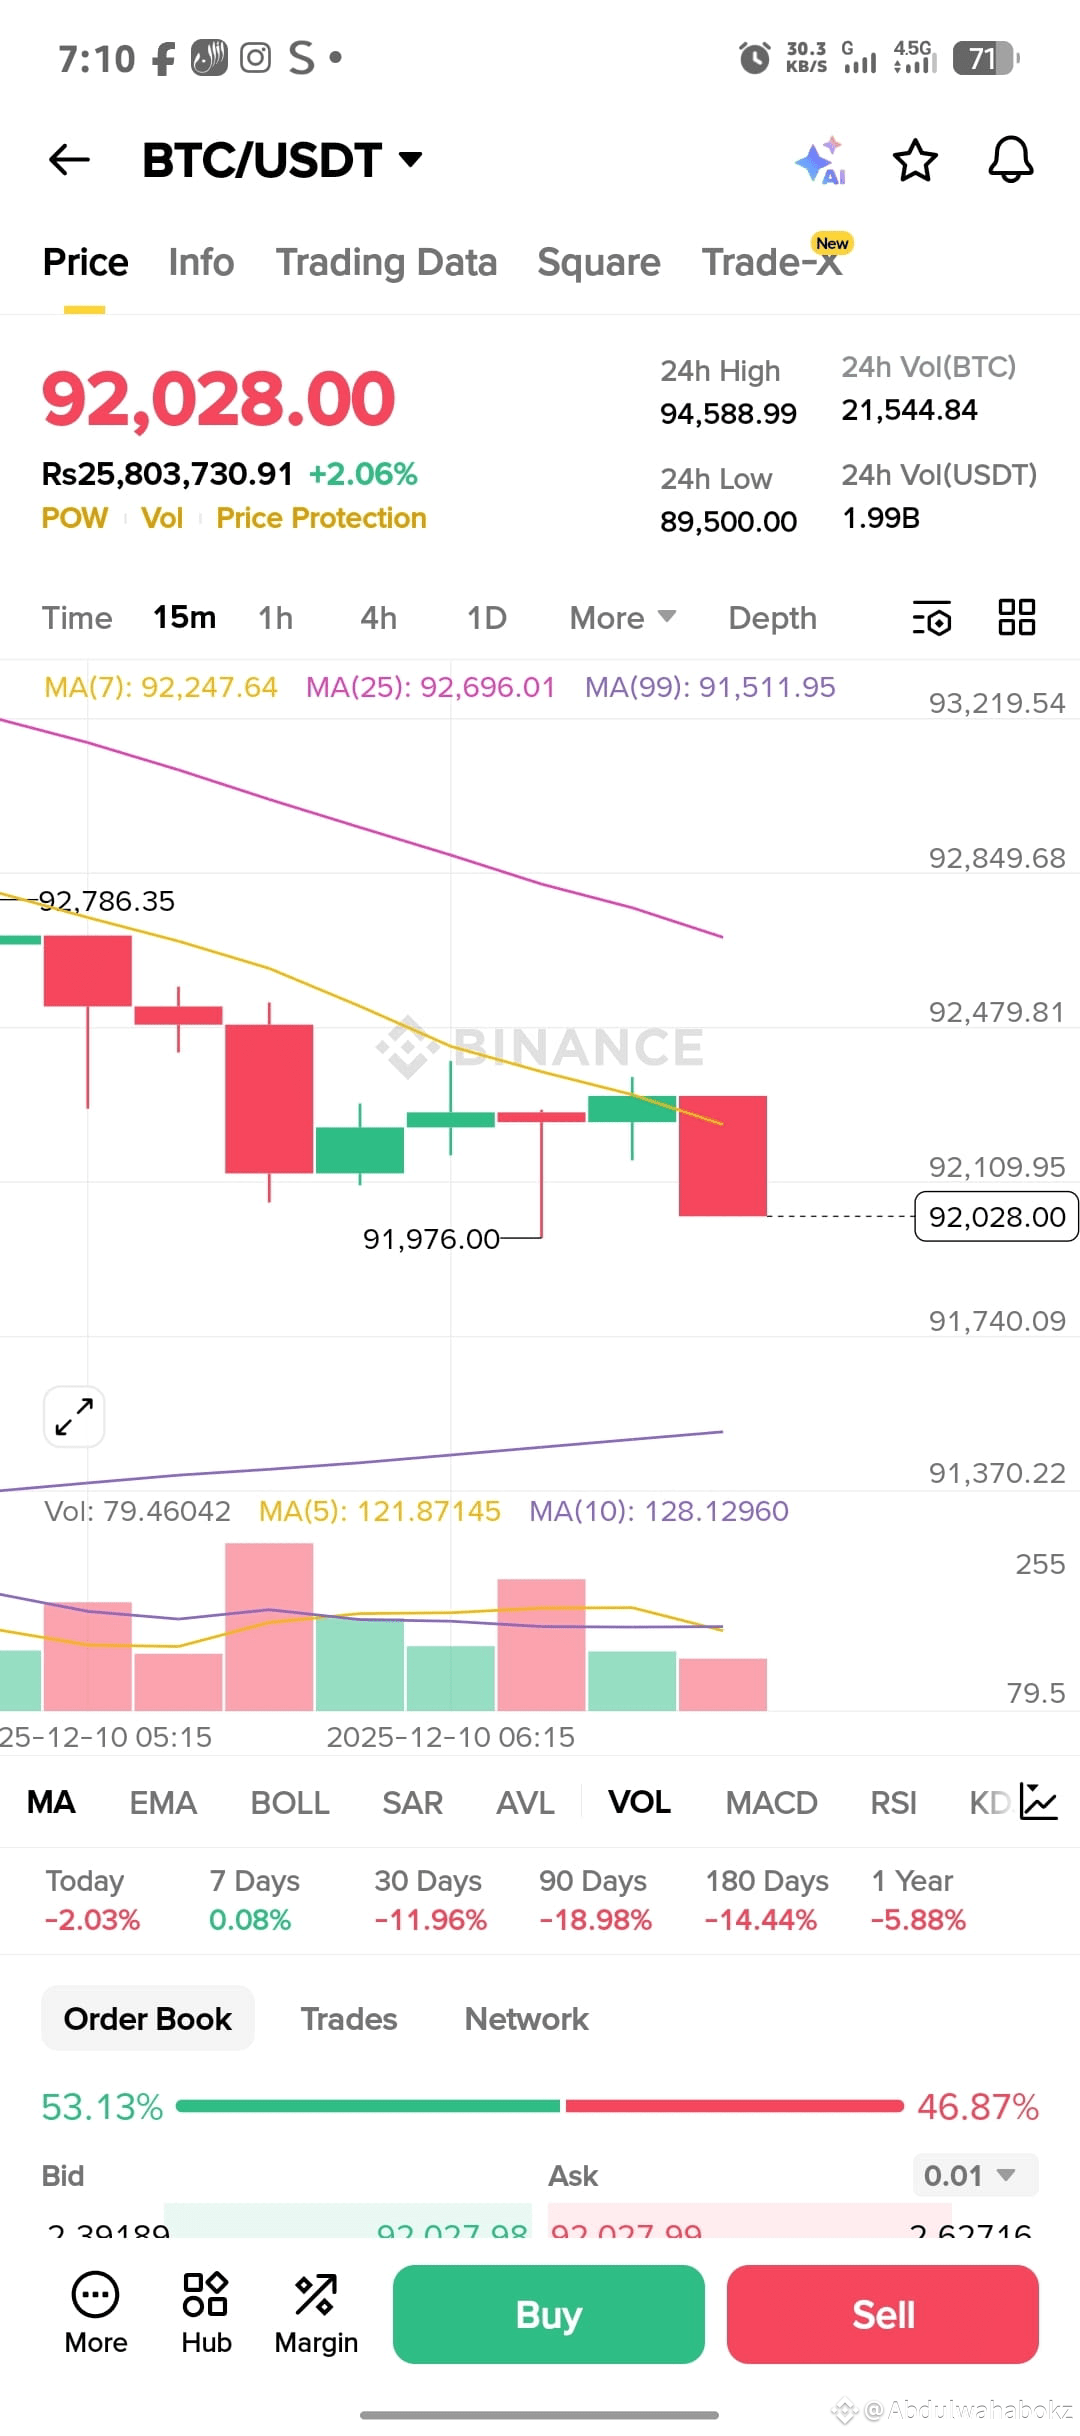
Most predictions suggest Bitcoin will trade between $91,000–$94,000 in the short term.
If a strong breakout happens, Bitcoin may move toward $110,000 again.
Technical indicators show the price is still stuck between support and resistance zones.
Meaning: A big jump is not expected immediately unless a positive market trigger appears.
---
🔭 Medium-Term Future (Possible Rise)
Analysts predict that in 2026 or later, Bitcoin could rise to $150,000–$250,000 if:
Institutional investors increase buying
Bitcoin ETFs attract more funds
Global market confidence improves
Some reports even give a $201,000 target for 2026.
---
⚠️ Why It May Not Rise Quickly
High volatility
Weak market sentiment
Global economic conditions
Regulations and interest rate changes
These factors slow down momentum.
---
🎯 My Simple Prediction
If things go well, Bitcoin has a higher chance of rising within the next 6–12 months (during 2026).
$BTC
Bitcoin is a crypto asset, and its future price direction is uncertain — but here is the latest analysis on when it may “go up”.
✅ Current Situation & Short-Term Forecast
Right now, several models show a bearish or sideways trend.
Most predictions suggest Bitcoin will trade between $91,000–$94,000 in the short term.
If a strong breakout happens, Bitcoin may move toward $110,000 again.
Technical indicators show the price is still stuck between support and resistance zones.
Meaning: A big jump is not expected immediately unless a positive market trigger appears.
---
🔭 Medium-Term Future (Possible Rise)
Analysts predict that in 2026 or later, Bitcoin could rise to $150,000–$250,000 if:
Institutional investors increase buying
Bitcoin ETFs attract more funds
Global market confidence improves
Some reports even give a $201,000 target for 2026.
---
⚠️ Why It May Not Rise Quickly
High volatility
Weak market sentiment
Global economic conditions
Regulations and interest rate changes
These factors slow down momentum.
---
🎯 My Simple Prediction
If things go well, Bitcoin has a higher chance of rising within the next 6–12 months (during 2026).
Bitcoin is a crypto asset, and its future price direction is uncertain — but here is the latest analysis on when it may “go up”.
✅ Current Situation & Short-Term Forecast
Right now, several models show a bearish or sideways trend.
Most predictions suggest Bitcoin will trade between $91,000–$94,000 in the short term.
If a strong breakout happens, Bitcoin may move toward $110,000 again.
Technical indicators show the price is still stuck between support and resistance zones.
Meaning: A big jump is not expected immediately unless a positive market trigger appears.
---
🔭 Medium-Term Future (Possible Rise)
Analysts predict that in 2026 or later, Bitcoin could rise to $150,000–$250,000 if:
Institutional investors increase buying
Bitcoin ETFs attract more funds
Global market confidence improves
Some reports even give a $201,000 target for 2026.
---
⚠️ Why It May Not Rise Quickly
High volatility
Weak market sentiment
Global economic conditions
Regulations and interest rate changes
These factors slow down momentum.
---
🎯 My Simple Prediction
If things go well, Bitcoin has a higher chance of rising within the next 6–12 months (during 2026).
2
$BTC 📈 Quelles prévisions font les analystes et les experts (2025–2030 et au-delà)
Les différentes analyses et prévisions varient beaucoup, montrant à quel point l'avenir reste incertain. Voici un aperçu illustratif de ce qui est disponible :
Prévisions / Source Cible de Prix / Perspectives
Certaines prévisions de "cycle haussier" pour 2025 Le BTC pourrait atteindre ~ 180 000 $ lors d'un rallye en 2025.
Scénarios "neutres à haussiers" à moyen terme (2026–2027) Les estimations varient de ~ 110 000 $ à 165 000 $ pour 2026, avec une croissance potentielle supplémentaire en 2027 dans des conditions favorables.
Chemins optimistes à long terme (2030) Certains voient 240 000 $ à 340 000 $ d'ici 2030 sous une forte demande et adoption.
Croyants très haussiers / "or numérique" Si l'adoption continue d'accélérer — institutionnelle, de détail, mondiale — le BTC pourrait surperformer de nombreux actifs (bien que de telles prévisions soient accompagnées d'une grande incertitude).
Une étude académique publiée récemment montre que des modèles de prévision avancés (utilisant des techniques comme VMD + LSTM) peuvent prédire les mouvements de prix du BTC à court terme (≈30 jours) avec plus de fiabilité que des modèles plus simples — suggérant que les techniques analytiques peuvent s'améliorer, mais que le prix reste difficile à prédire à long terme. #BTCVSGOLD #BinanceBlockchainWeek #TrumpTariffs #USJobsData #CPIWatch
$BTC 📈 Quelles prévisions font les analystes et les experts (2025–2030 et au-delà)
Les différentes analyses et prévisions varient beaucoup, montrant à quel point l'avenir reste incertain. Voici un aperçu illustratif de ce qui est disponible :
Prévisions / Source Cible de Prix / Perspectives
Certaines prévisions de "cycle haussier" pour 2025 Le BTC pourrait atteindre ~ 180 000 $ lors d'un rallye en 2025.
Scénarios "neutres à haussiers" à moyen terme (2026–2027) Les estimations varient de ~ 110 000 $ à 165 000 $ pour 2026, avec une croissance potentielle supplémentaire en 2027 dans des conditions favorables.
Chemins optimistes à long terme (2030) Certains voient 240 000 $ à 340 000 $ d'ici 2030 sous une forte demande et adoption.
Croyants très haussiers / "or numérique" Si l'adoption continue d'accélérer — institutionnelle, de détail, mondiale — le BTC pourrait surperformer de nombreux actifs (bien que de telles prévisions soient accompagnées d'une grande incertitude).
Une étude académique publiée récemment montre que des modèles de prévision avancés (utilisant des techniques comme VMD + LSTM) peuvent prédire les mouvements de prix du BTC à court terme (≈30 jours) avec plus de fiabilité que des modèles plus simples — suggérant que les techniques analytiques peuvent s'améliorer, mais que le prix reste difficile à prédire à long terme. #BTCVSGOLD #BinanceBlockchainWeek #TrumpTariffs #USJobsData #CPIWatch
Les différentes analyses et prévisions varient beaucoup, montrant à quel point l'avenir reste incertain. Voici un aperçu illustratif de ce qui est disponible :
Prévisions / Source Cible de Prix / Perspectives
Certaines prévisions de "cycle haussier" pour 2025 Le BTC pourrait atteindre ~ 180 000 $ lors d'un rallye en 2025.
Scénarios "neutres à haussiers" à moyen terme (2026–2027) Les estimations varient de ~ 110 000 $ à 165 000 $ pour 2026, avec une croissance potentielle supplémentaire en 2027 dans des conditions favorables.
Chemins optimistes à long terme (2030) Certains voient 240 000 $ à 340 000 $ d'ici 2030 sous une forte demande et adoption.
Croyants très haussiers / "or numérique" Si l'adoption continue d'accélérer — institutionnelle, de détail, mondiale — le BTC pourrait surperformer de nombreux actifs (bien que de telles prévisions soient accompagnées d'une grande incertitude).
Une étude académique publiée récemment montre que des modèles de prévision avancés (utilisant des techniques comme VMD + LSTM) peuvent prédire les mouvements de prix du BTC à court terme (≈30 jours) avec plus de fiabilité que des modèles plus simples — suggérant que les techniques analytiques peuvent s'améliorer, mais que le prix reste difficile à prédire à long terme. #BTCVSGOLD #BinanceBlockchainWeek #TrumpTariffs #USJobsData #CPIWatch
12
Voir la traduction
$$BTC recently dipped below $88,000 — a notable support level — before rebounding.
As of early December 2025, the market appears cautiously optimistic: some analysts see a recovery toward $98,000–$102,000 by year-end.
#BTCVSGOLD #BinanceBlockchainWeek #TrumpTariffs #USJobsData #CPIWatch
$
$BTC recently dipped below $88,000 — a notable support level — before rebounding.
As of early December 2025, the market appears cautiously optimistic: some analysts see a recovery toward $98,000–$102,000 by year-end.
#BTCVSGOLD #BinanceBlockchainWeek #TrumpTariffs #USJobsData #CPIWatch
As of early December 2025, the market appears cautiously optimistic: some analysts see a recovery toward $98,000–$102,000 by year-end.
#BTCVSGOLD #BinanceBlockchainWeek #TrumpTariffs #USJobsData #CPIWatch
6
8
Voir la traduction
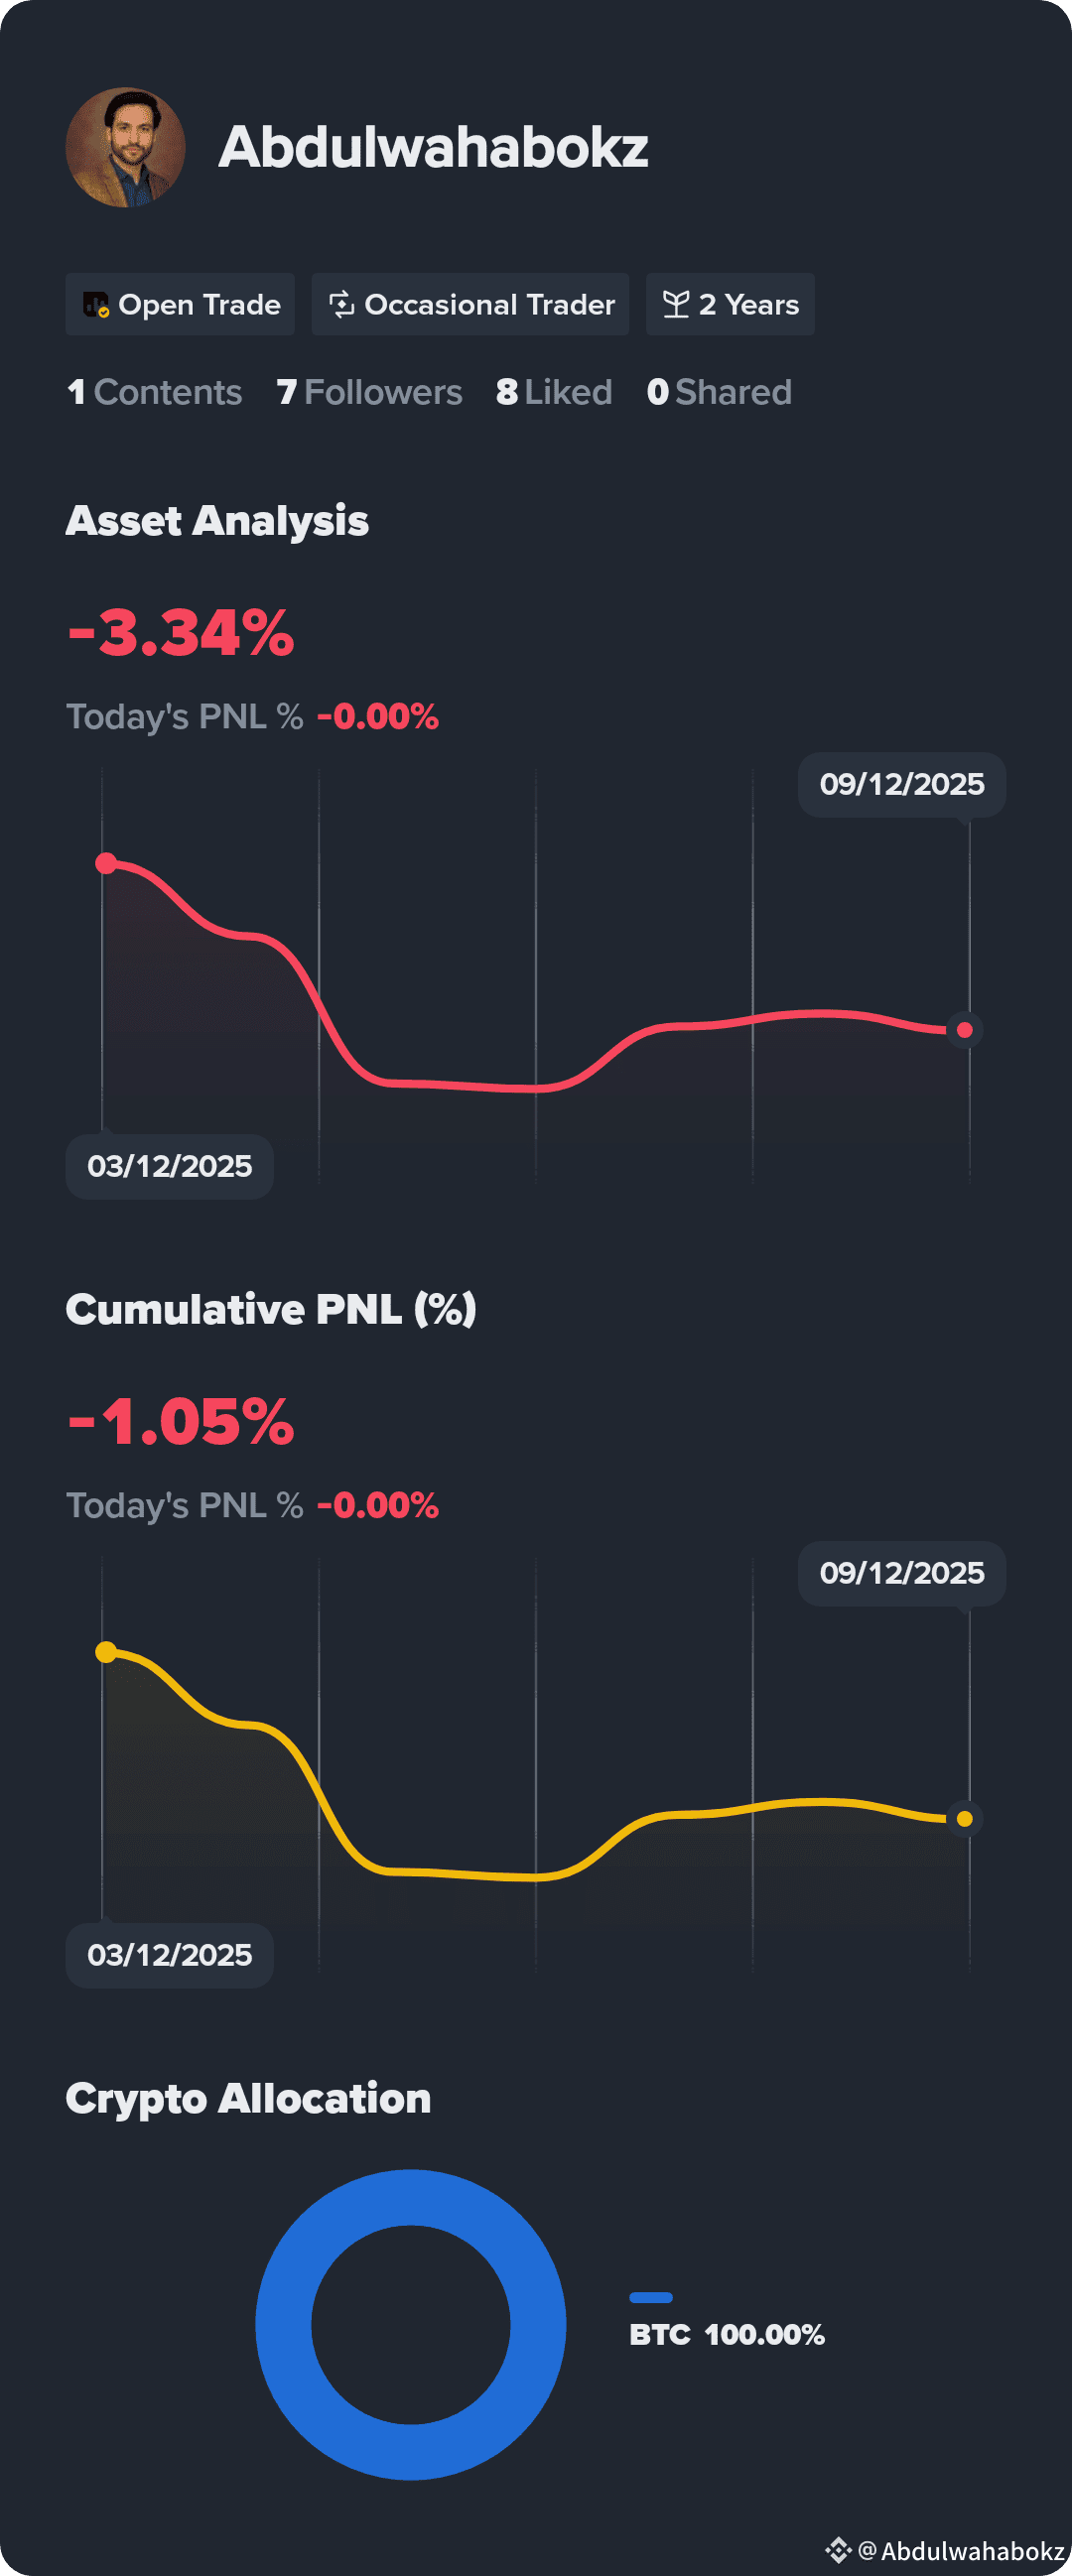
See my returns and portfolio breakdown. Follow for investment tips
See my returns and portfolio breakdown. Follow for investment tips
10
10
Connectez-vous pour découvrir plus de contenu
Rejoignez la communauté mondiale des adeptes de cryptomonnaies sur Binance Square
⚡️ Suviez les dernières informations importantes sur les cryptomonnaies.
💬 Jugé digne de confiance par la plus grande plateforme d’échange de cryptomonnaies au monde.
👍 Découvrez les connaissances que partagent les créateurs vérifiés.
Adresse e-mail/Nº de téléphone
Sujets d’actualité
BinanceLaunchesBinanceIntelligence
231,596 vues
2,045 mentions
Pourquoi Binance Intelligence et la stabilité du BTC dominent le mois d’octobre
hk_Spot
·0 mentions J’aime
·645 vues
StriveBuys2000BTCFor$169M
10,252 vues
96 mentions
EvernorthXRPTreasuryCompletesSPACMerger
120,223 vues
1,210 mentions