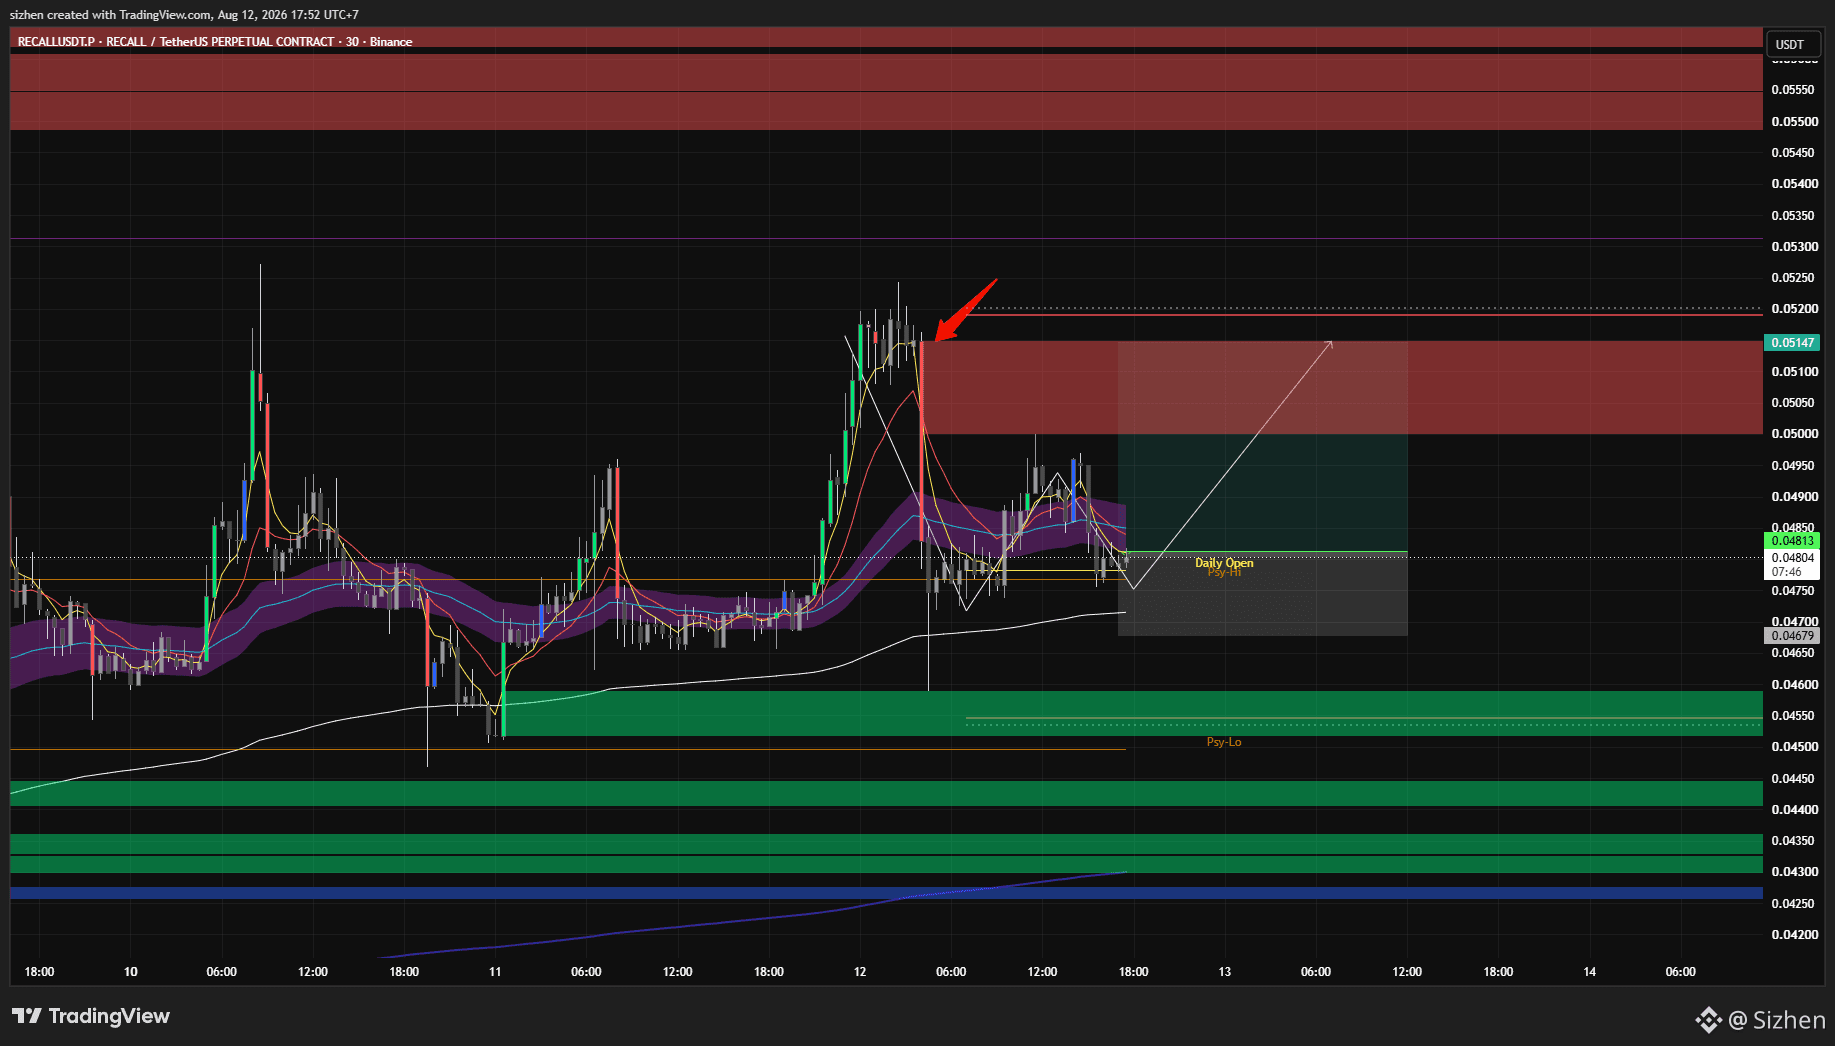
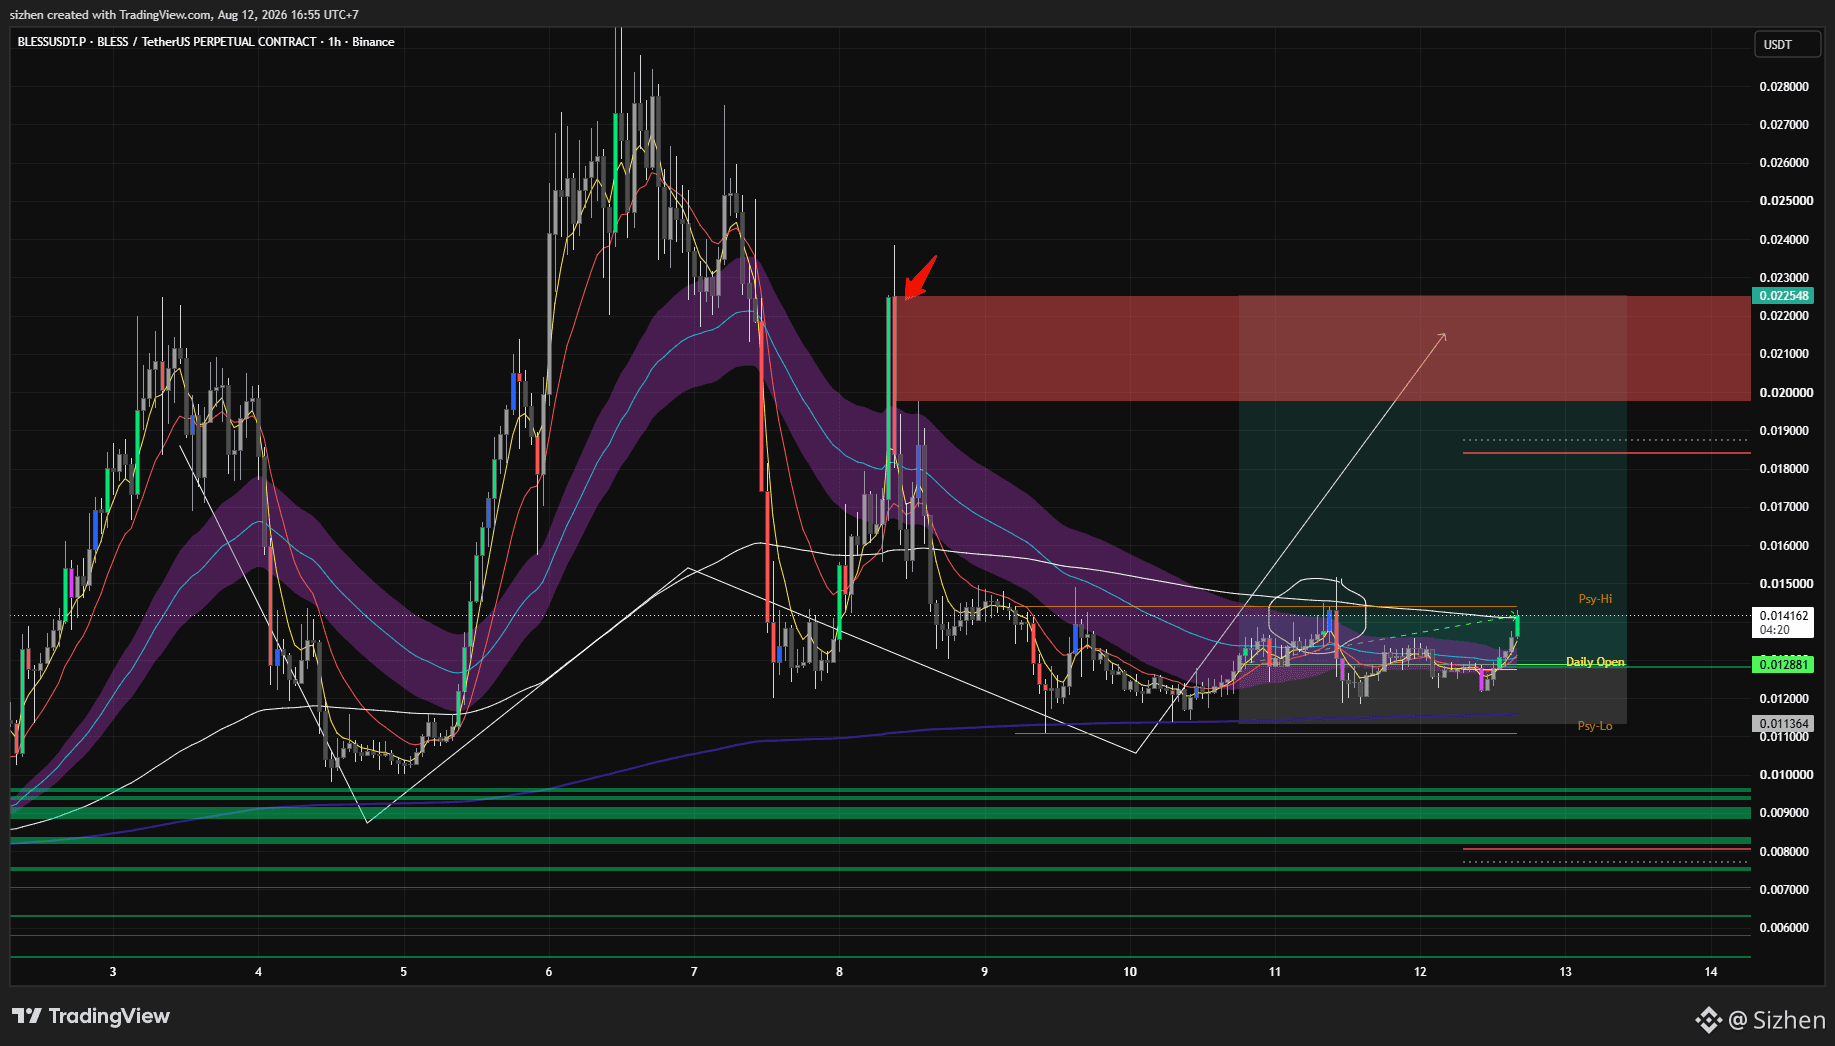
After I closed my long position on $RECALL , the price continued to rise by 8% and almost reached the full take-profit level. Congratulations to those who made a profit from this analysis
Sizhen
·
--
$RECALL is almost at its target on the violet vector; from here, I’ll be closing the position. If anyone is still holding it, simply move the stop-loss to the entry point
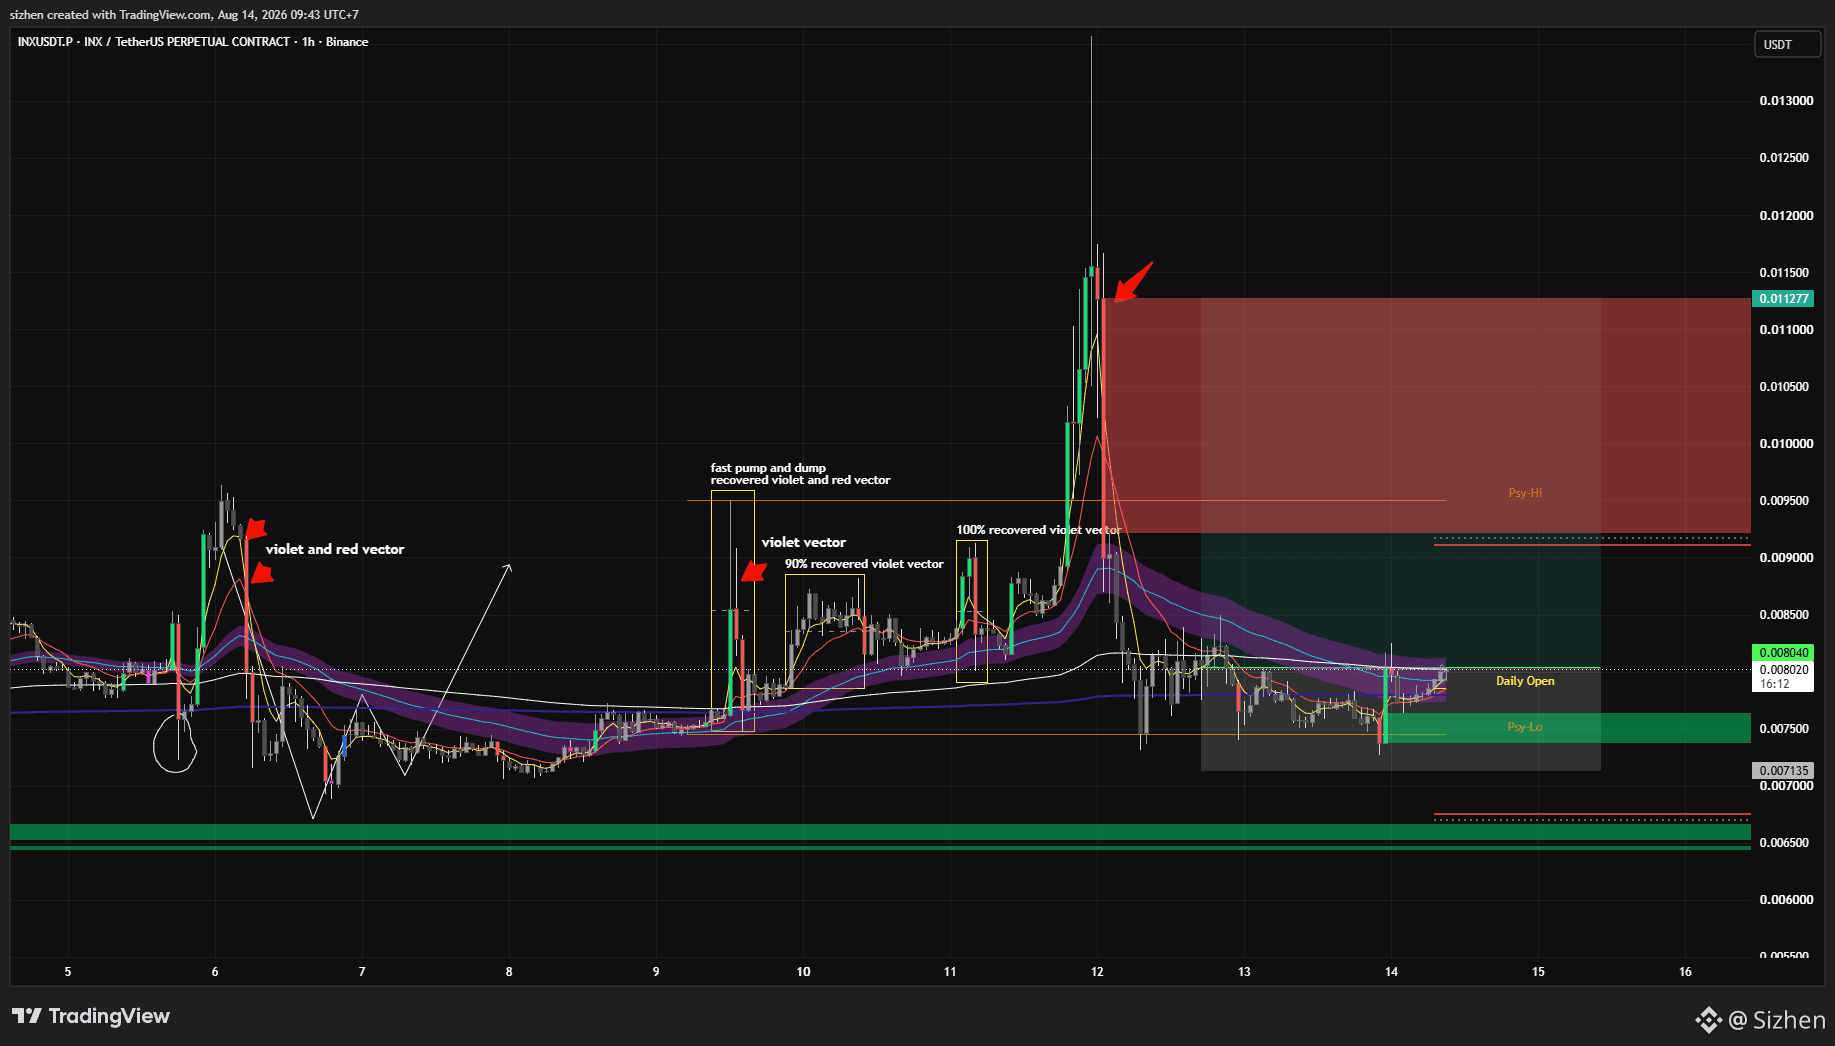
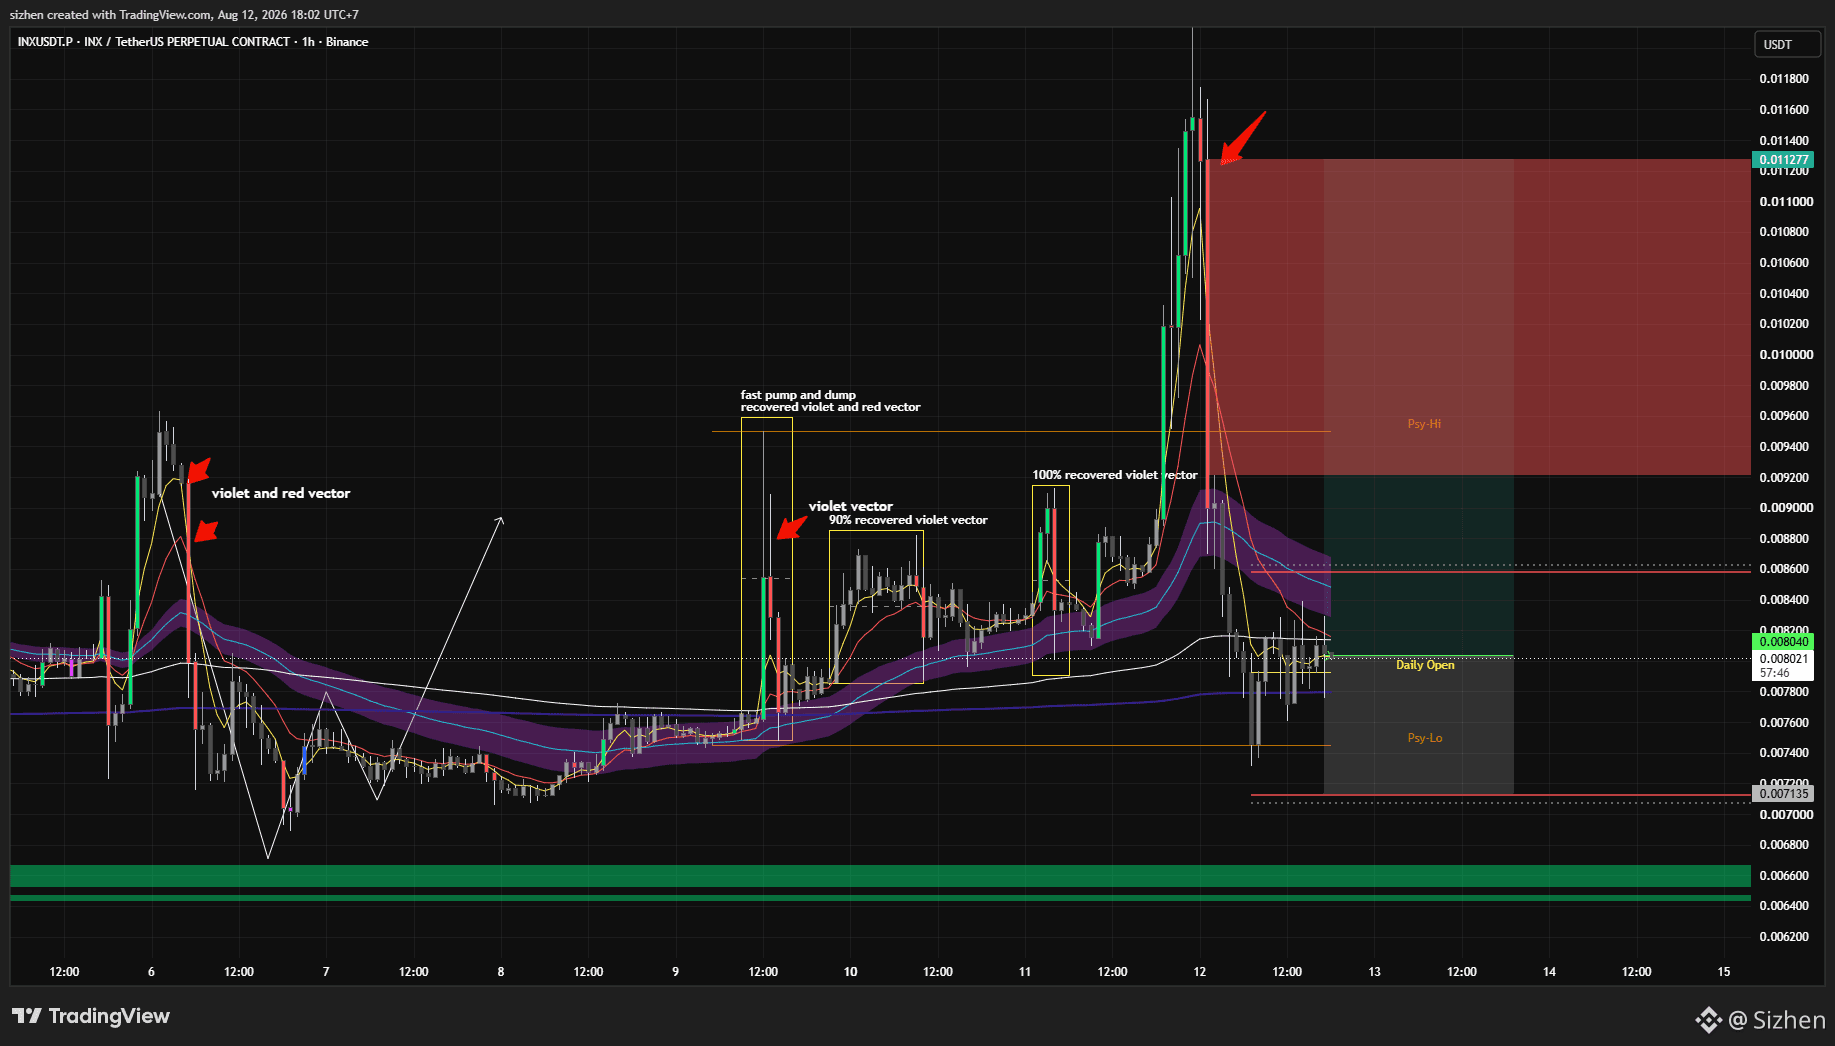
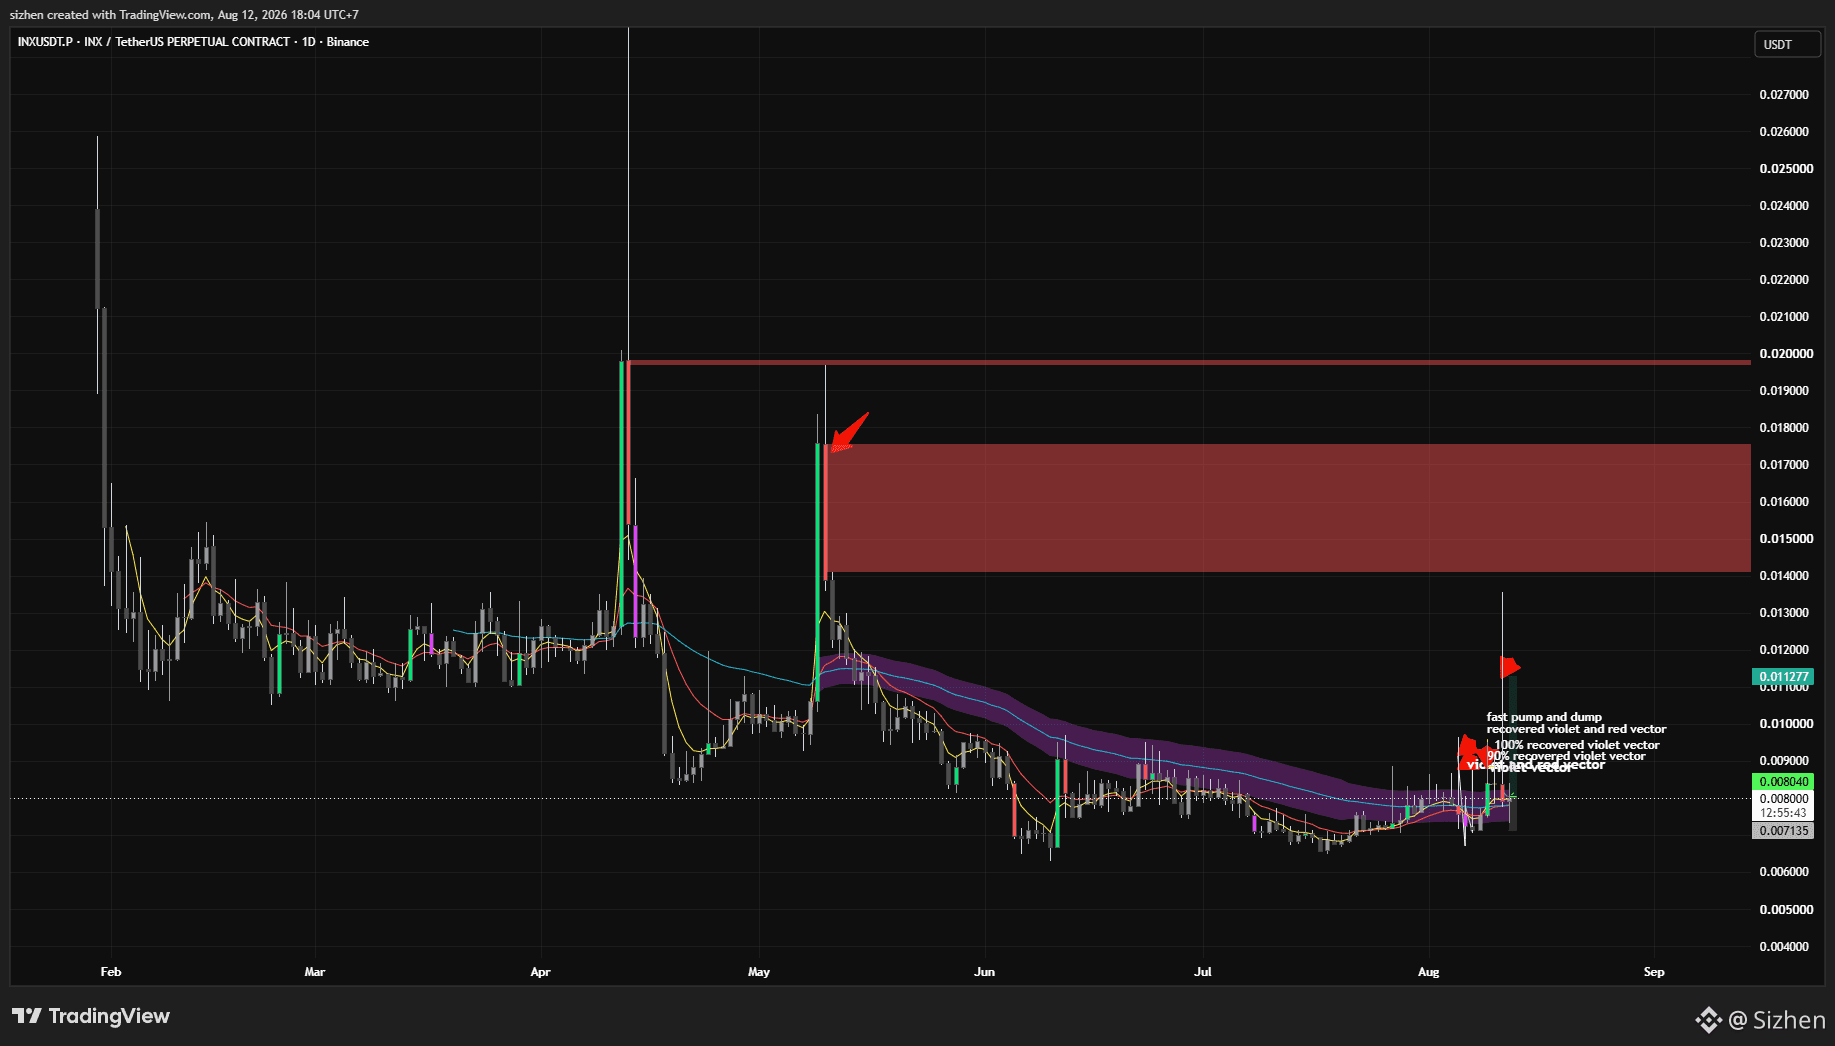
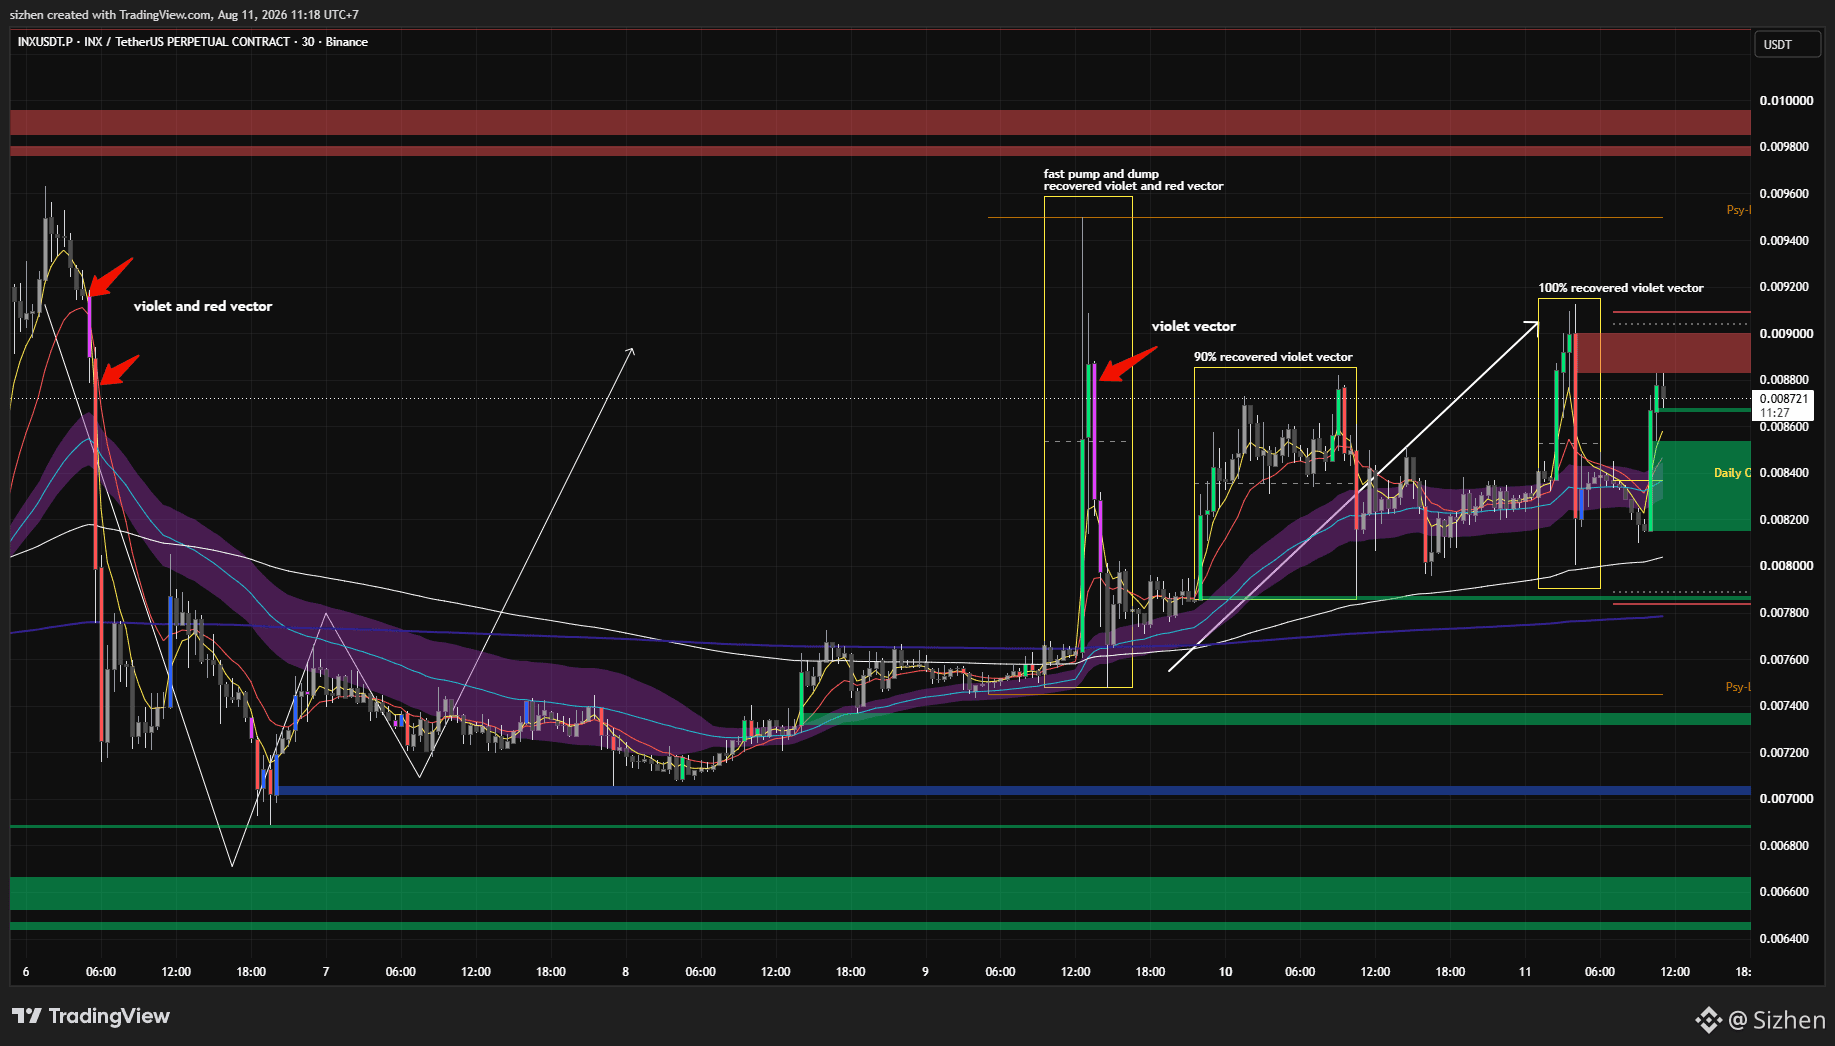
$INX TP is full and has recovered all the vectors listed above, Congratulations for those who have been following
Sizhen
·
--
Haussier
I had closed my position on the $INX due to a rejection at the EMA, and it has now fully broken through the 50 EMA this breakout was signalled by a green vector candle, which provides sufficient confidence to reopen a long position on the $INX
$RECALL is almost at its target on the violet vector; from here, I’ll be closing the position. If anyone is still holding it, simply move the stop-loss to the entry point
Sizhen
·
--
Haussier
$RECALL is already in play and is approaching the violet vector candle area once the violet vector candle is reached, you can move your stop
$RECALL is already in play and is approaching the violet vector candle area once the violet vector candle is reached, you can move your stop loss to the entry point or to 50% of your ROI
Sizhen
·
--
Haussier
$RECALL is quite interesting; if the price manages to hold above the 50 EMA (the purple line), there is a chance it could rise to the daily open or higher
On the 4-hour timeframe I’ve shared, there is a vector that could serve as our upside target, let’s assume the price will rise to that area
For the entry, stop-loss and take-profit levels, please refer to the chart I’ve shared
$RECALL is quite interesting; if the price manages to hold above the 50 EMA (the purple line), there is a chance it could rise to the daily open or higher
On the 4-hour timeframe I’ve shared, there is a vector that could serve as our upside target, let’s assume the price will rise to that area
For the entry, stop-loss and take-profit levels, please refer to the chart I’ve shared
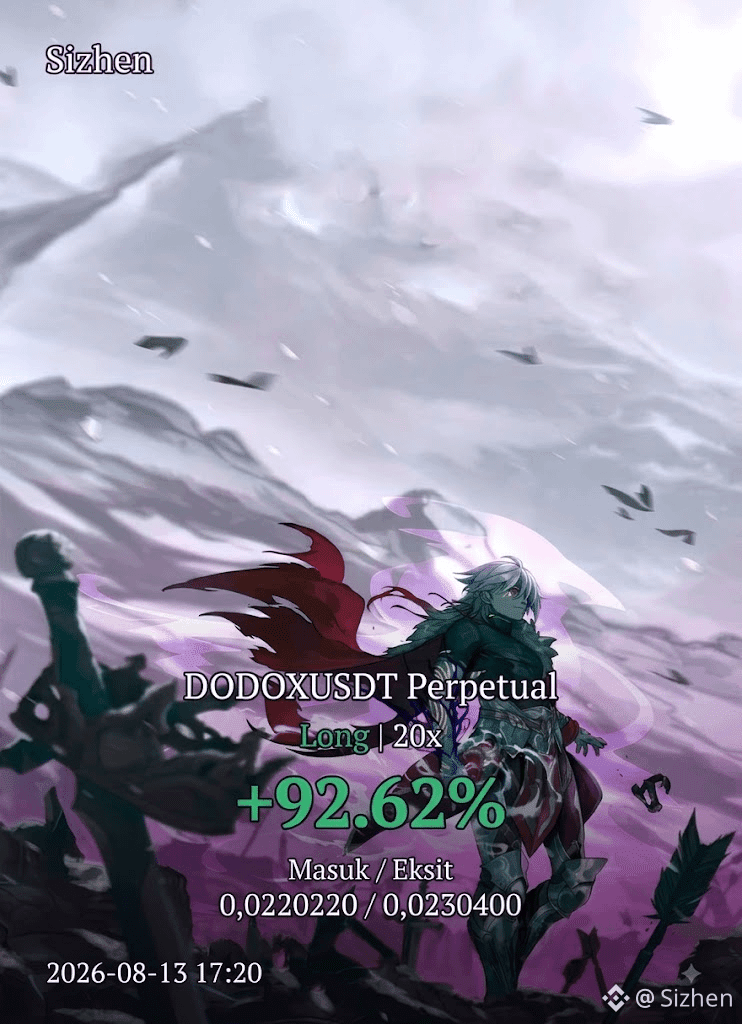
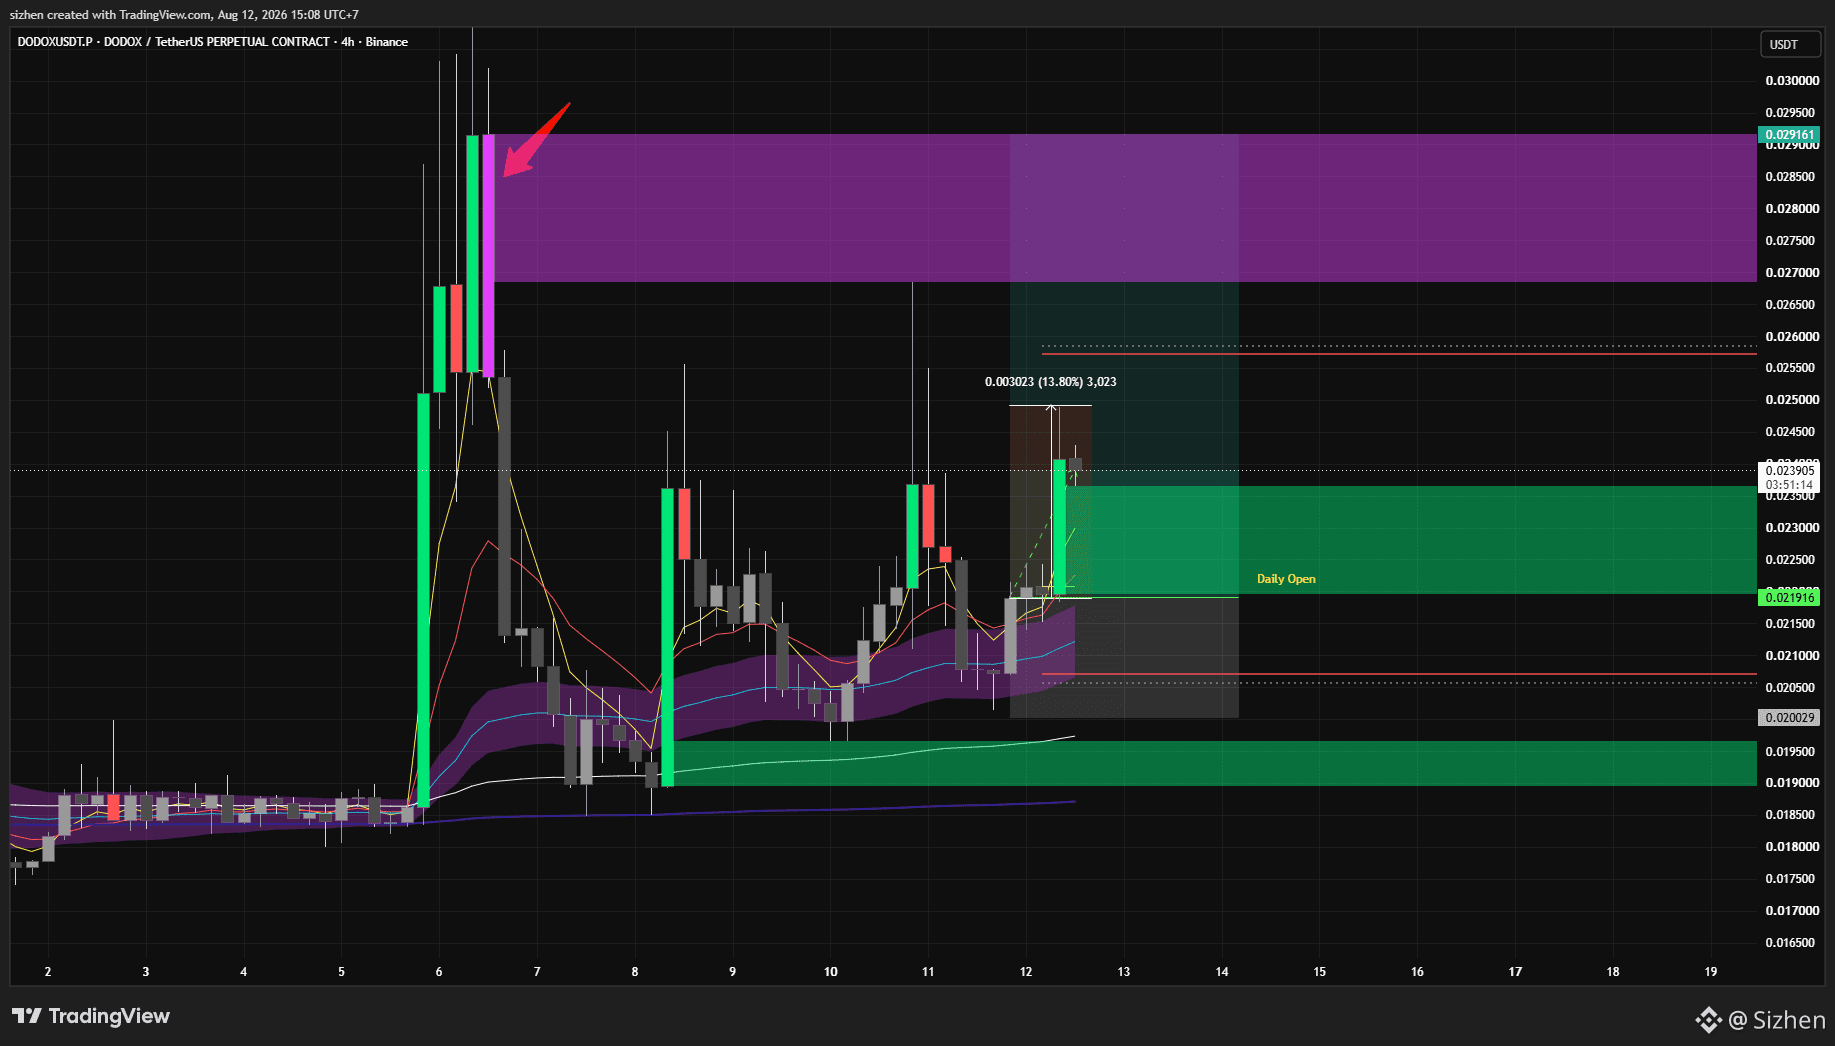
$DODOX a augmenté de 24 % depuis que je l’ai partagé
Sizhen
·
--
Haussier
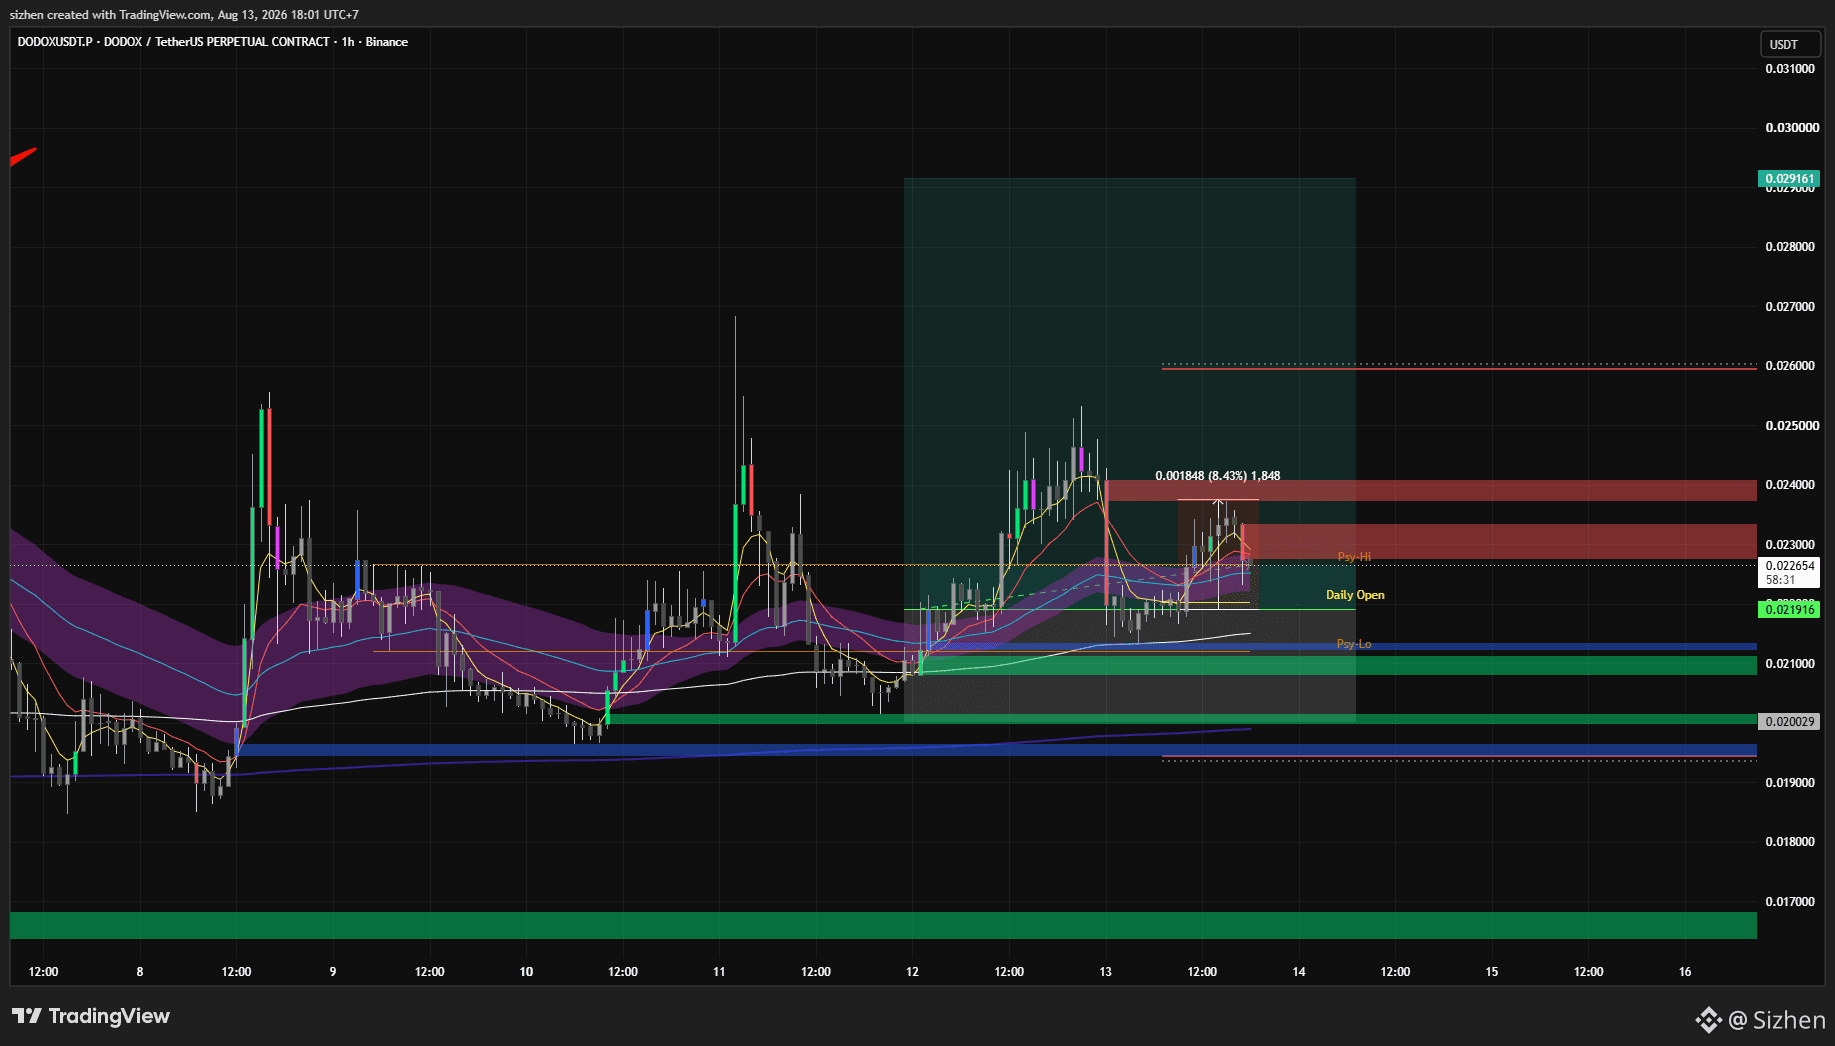
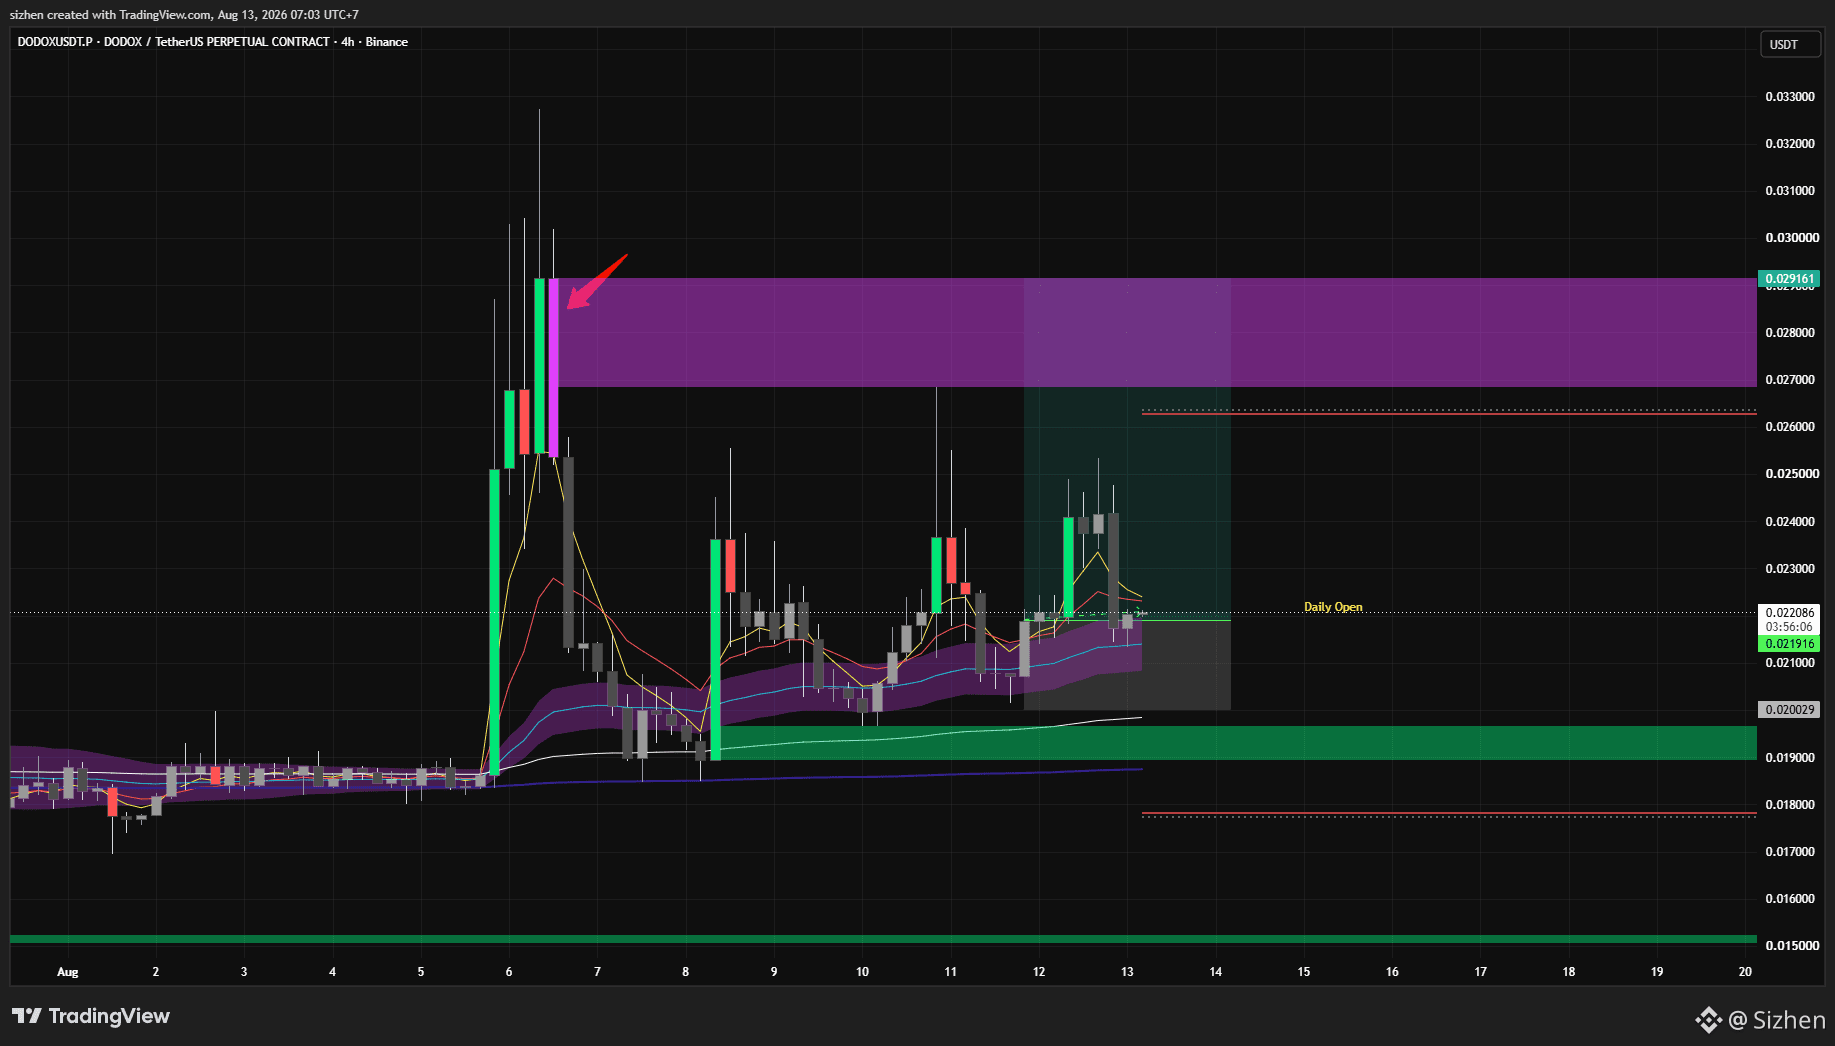
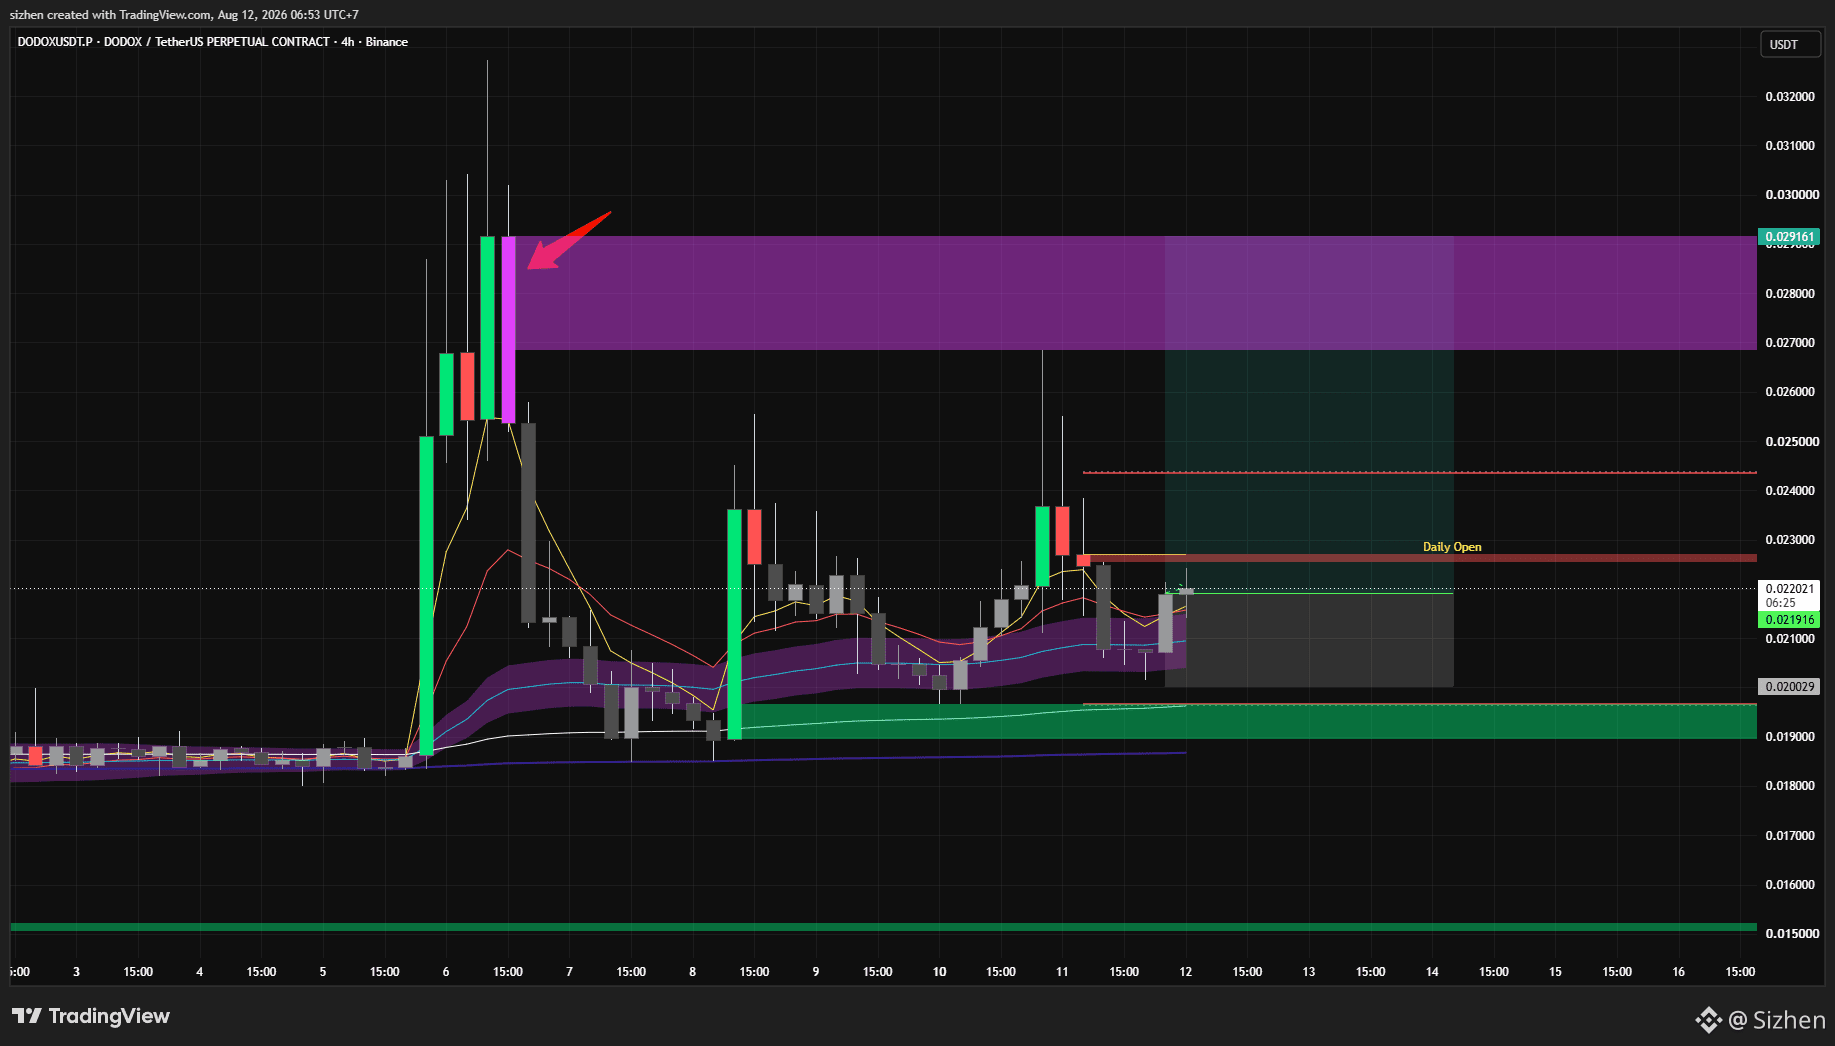
$DODOX Je regarde ça depuis un moment, mais il semble qu’alors que je m’étais absenté un instant, le prix ait augmenté. Cependant, tant que le prix ne redescend pas sous l’ouverture du jour, ça vaut le coup de surveiller, et j’ai ouvert une position longue même si ça a légèrement monté. Notre objectif est le vecteur violet ci-dessus
Formation W sur $HEI : si le prix augmente et que la bougie en chandelier vert franchit l’ouverture du jour, il est très probable que nous voyions une nouvelle hausse au-dessus du vecteur rouge sur $HEI
I had closed my position on the $INX due to a rejection at the EMA, and it has now fully broken through the 50 EMA this breakout was signalled by a green vector candle, which provides sufficient confidence to reopen a long position on the $INX
Sizhen
·
--
Haussier
$INX I’m still holding onto my long position if the price starts to break above the level I’ve marked, it could rise to the red vector candle that hasn’t yet been filled, and if it’s rejected by the 50 EMA, I’ll close the position
$DODOX has already risen quite a bit from here; will it reach the target level? I closed the position too quickly out of habit I’m a bit regretful, but never mind, I’ll take this as a lesson for next time
Sizhen
·
--
Haussier
$DODOX Je regarde ça depuis un moment, mais il semble qu’alors que je m’étais absenté un instant, le prix ait augmenté. Cependant, tant que le prix ne redescend pas sous l’ouverture du jour, ça vaut le coup de surveiller, et j’ai ouvert une position longue même si ça a légèrement monté. Notre objectif est le vecteur violet ci-dessus
$AIO On the 1h timeframe, the price should be able to rise to the two target levels I’ve marked, so I’ve opened another long position – this is the third time I’ve opened one
And on the 4h timeframe, if the price breaks through the 50 EMA and bounces off the 50 EMA, we could see a full recovery upwards and a retrace of all the existing red vector candles
Sizhen
·
--
Haussier
D’après l’analyse que je t’ai partagée hier, $AIO a évolué plus haut à partir d’ici. Tu pourrais déplacer ton stop loss au point d’entrée ou prendre des profits partiels et laisser le reste continuer à courir
$INX I’m still holding onto my long position if the price starts to break above the level I’ve marked, it could rise to the red vector candle that hasn’t yet been filled, and if it’s rejected by the 50 EMA, I’ll close the position
Sizhen
·
--
Haussier
If $INX can bounce within this range, the price may target the red vector marked there
There are also entry points, stoploss and take profit levels there as well
It looks as though $HEI needs a bit more time to bounce back up
Sizhen
·
--
Haussier
$HEI Celle-ci est aussi intéressante ; tant qu’elle reste au-dessus de l’ouverture quotidienne d’hier – ou de la nouvelle, qui doit apparaître, il y a des chances qu’elle remonte à nouveau
$KGEN a déjà augmenté de 7 % depuis que j’ai publié à propos de $KGEN pouvant éventuellement connaître un autre flash pump à la hausse
Pour ceux qui suivent ce setup, vous pouvez soit déplacer le stoploss au point d’entrée, soit clôturer la position maintenant
Sizhen
·
--
Haussier
Comme le prix de $KGEN a rebondi après avoir touché la moyenne mobile exponentielle (EMA) 50 et l’ouverture du jour, y aura-t-il un flash pump à la suite de la baisse précédente ?