
TheCryptoOnur
3.1k Publications

TheCryptoOnur
Signaler
Bloquer l’utilisateur
Social Media Content Creator / Full Stack Developer www.cryptoonur.xyz
57 Suivis
3.5K+ Abonnés
1.1K+ J’aime
Publications
Tous
Citations
Vidéos
Voir la traduction
🚨🚨 DELISTING
Binance Futures Will Delist PTBUSDT and MITOUSDT USDⓈ-M Perpetual Contracts (2026-10-23)
#Binance
🚨🚨 DELISTING
Binance Futures Will Delist PTBUSDT and MITOUSDT USDⓈ-M Perpetual Contracts (2026-10-23)
#Binance
Binance Futures Will Delist PTBUSDT and MITOUSDT USDⓈ-M Perpetual Contracts (2026-10-23)
#Binance
19
Voir la traduction
🔴 $TRX · 1H
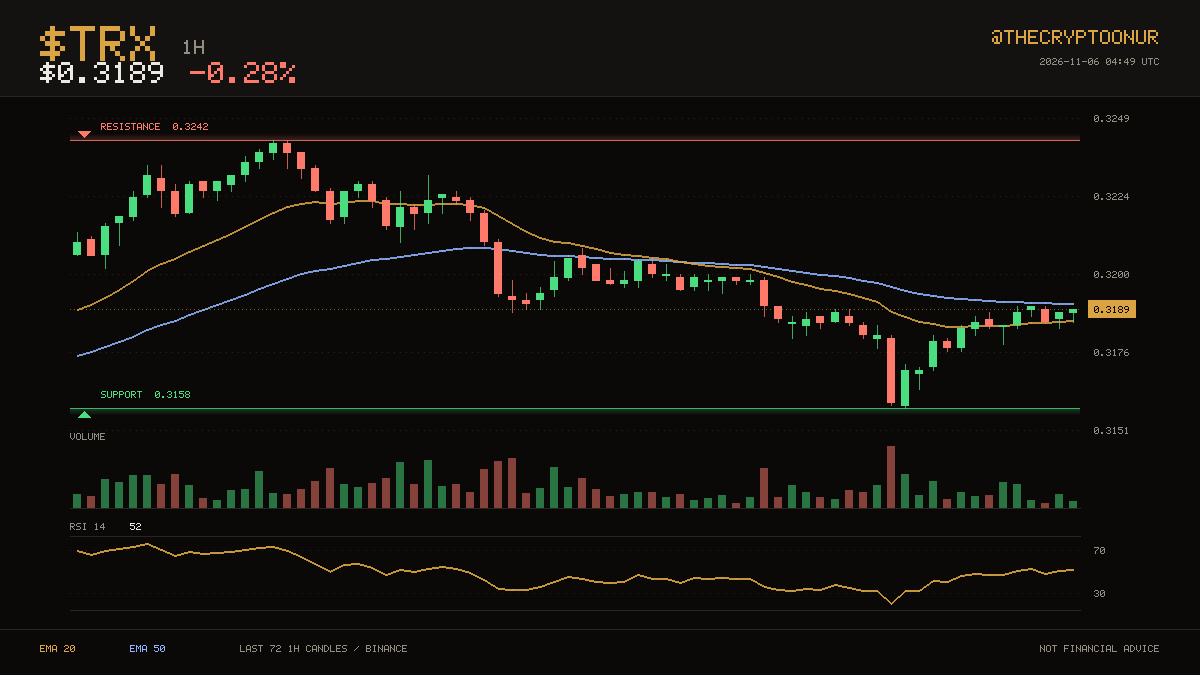
At $0.3189, $TRX is sitting right in the middle of its hourly averages. $0.3158 on the low side and $0.3242 on the high side have contained the last three days. That puts price in the middle of the range. There is only 1.0% between price and support. The 20 has stayed below the 50 for 29 candles. RSI at 52 is neutral, so momentum is not blocking a move either way. Over the past day it has traded between $0.3158 and $0.3200, sitting near the top of it now. Participation is light at about 0.6x average volume. Down 0.3% over 24 hours.
DYOR
$TRX #TechnicalAnalysis
🔴 $TRX · 1H
At $0.3189, $TRX is sitting right in the middle of its hourly averages. $0.3158 on the low side and $0.3242 on the high side have contained the last three days. That puts price in the middle of the range. There is only 1.0% between price and support. The 20 has stayed below the 50 for 29 candles. RSI at 52 is neutral, so momentum is not blocking a move either way. Over the past day it has traded between $0.3158 and $0.3200, sitting near the top of it now. Participation is light at about 0.6x average volume. Down 0.3% over 24 hours.
DYOR
$TRX #TechnicalAnalysis
At $0.3189, $TRX is sitting right in the middle of its hourly averages. $0.3158 on the low side and $0.3242 on the high side have contained the last three days. That puts price in the middle of the range. There is only 1.0% between price and support. The 20 has stayed below the 50 for 29 candles. RSI at 52 is neutral, so momentum is not blocking a move either way. Over the past day it has traded between $0.3158 and $0.3200, sitting near the top of it now. Participation is light at about 0.6x average volume. Down 0.3% over 24 hours.
DYOR
$TRX #TechnicalAnalysis
43
Voir la traduction
📉 $TRUMP · 1H
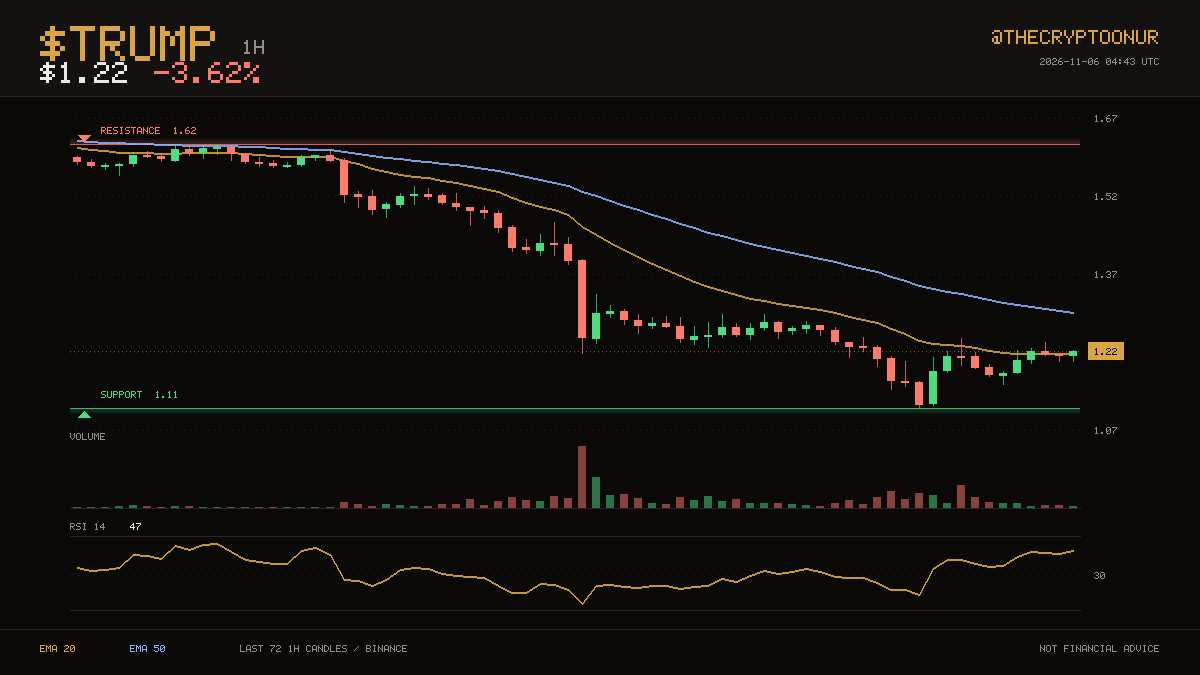
$TRUMP is at $1.22, with one average above price and one below. The three day range runs from $1.11 up to $1.62. It is sitting in the bottom third of the range. Support is the near one at 9.0% below; the range high is far above. Averages have been ordered the same way for a long stretch now, with the 20 below the 50. Momentum is mid range with RSI at 47. The 24 hour range runs $1.11 to $1.29, and price is around the middle of it. Volume over the past day is running about 1.8x the recent average, so there is real participation behind this. Down 3.6% over 24 hours.
DYOR
$TRUMP #Crypto
📉 $TRUMP · 1H
$TRUMP is at $1.22, with one average above price and one below. The three day range runs from $1.11 up to $1.62. It is sitting in the bottom third of the range. Support is the near one at 9.0% below; the range high is far above. Averages have been ordered the same way for a long stretch now, with the 20 below the 50. Momentum is mid range with RSI at 47. The 24 hour range runs $1.11 to $1.29, and price is around the middle of it. Volume over the past day is running about 1.8x the recent average, so there is real participation behind this. Down 3.6% over 24 hours.
DYOR
$TRUMP #Crypto
$TRUMP is at $1.22, with one average above price and one below. The three day range runs from $1.11 up to $1.62. It is sitting in the bottom third of the range. Support is the near one at 9.0% below; the range high is far above. Averages have been ordered the same way for a long stretch now, with the 20 below the 50. Momentum is mid range with RSI at 47. The 24 hour range runs $1.11 to $1.29, and price is around the middle of it. Volume over the past day is running about 1.8x the recent average, so there is real participation behind this. Down 3.6% over 24 hours.
DYOR
$TRUMP #Crypto
14
Voir la traduction
📉 $TRUMP · 1H
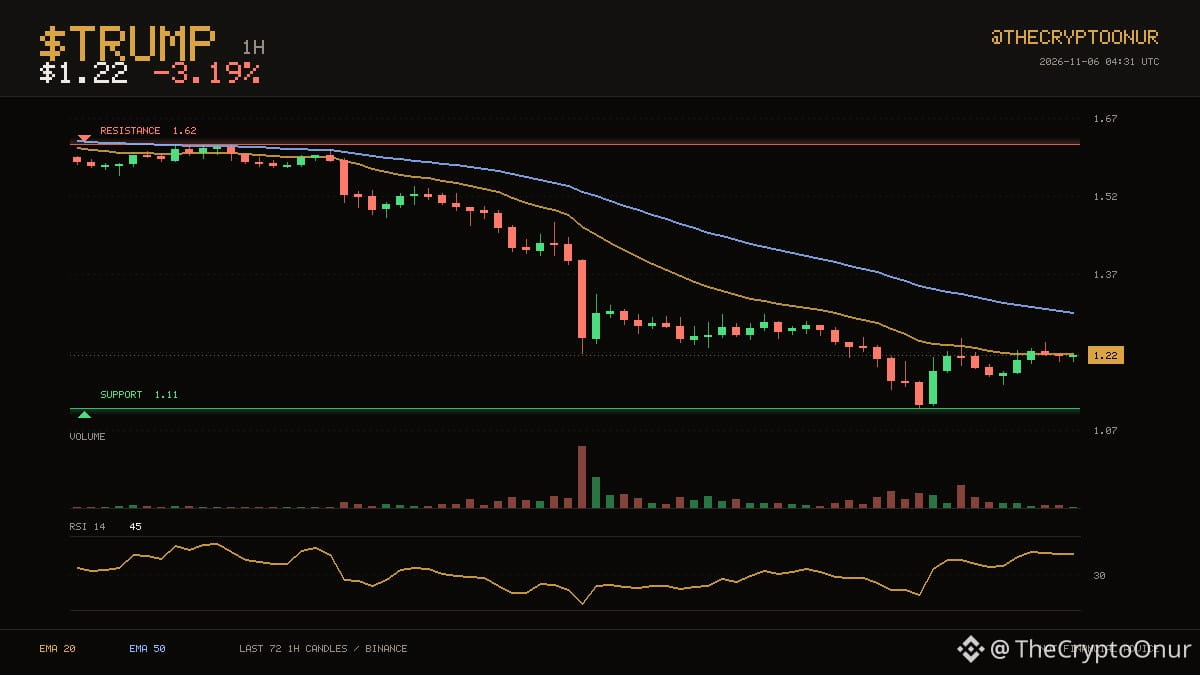
Price is $1.22 and $TRUMP remains below the averages that capped it earlier. $1.11 on the low side and $1.62 on the high side have contained the last three days. RSI at 45 is neutral, so momentum is not blocking a move either way. The floor is 8.4% away and the ceiling is nowhere close. Down 3.2% over 24 hours.
🔴 $PAXG · 1H
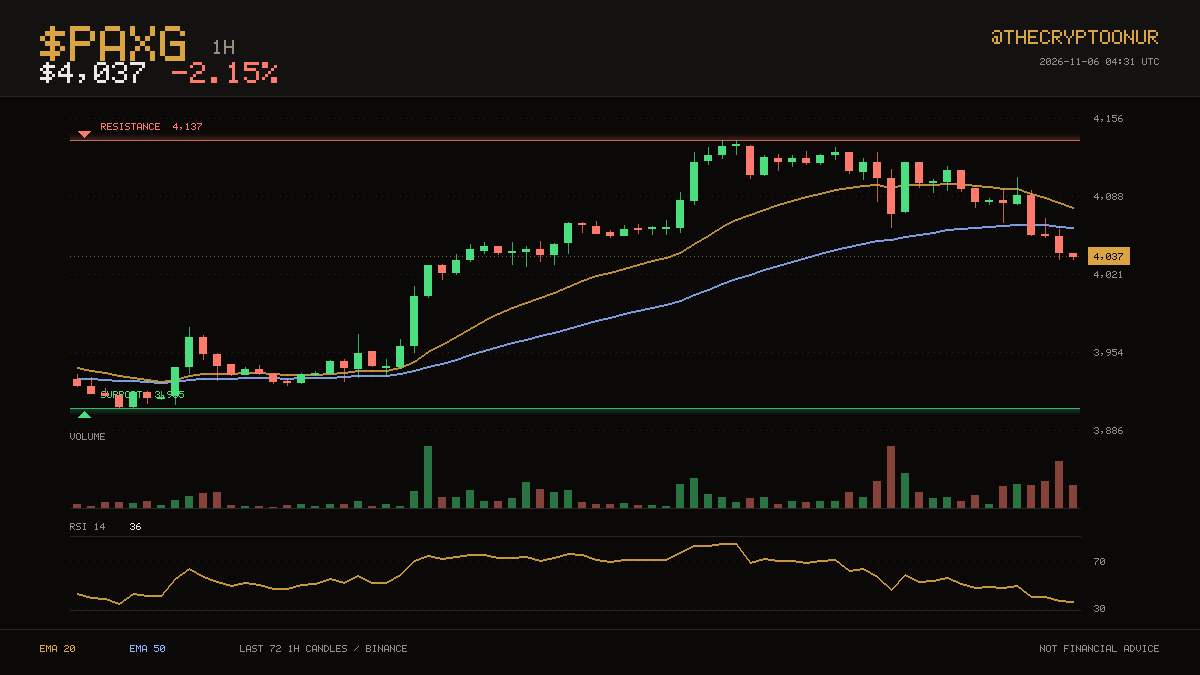
$PAXG trades at $4,037, still on the weak side of its hourly averages. The three day range runs from $3,905 up to $4,137. Momentum is mid range with RSI at 36. Resistance sits 2.5% above and support 3.3% below. Down 2.2% over 24 hours.
DYOR
$TRUMP $PAXG #Crypto
📉 $TRUMP · 1H
Price is $1.22 and $TRUMP remains below the averages that capped it earlier. $1.11 on the low side and $1.62 on the high side have contained the last three days. RSI at 45 is neutral, so momentum is not blocking a move either way. The floor is 8.4% away and the ceiling is nowhere close. Down 3.2% over 24 hours.
🔴 $PAXG · 1H
$PAXG trades at $4,037, still on the weak side of its hourly averages. The three day range runs from $3,905 up to $4,137. Momentum is mid range with RSI at 36. Resistance sits 2.5% above and support 3.3% below. Down 2.2% over 24 hours.
DYOR
$TRUMP $PAXG #Crypto
Price is $1.22 and $TRUMP remains below the averages that capped it earlier. $1.11 on the low side and $1.62 on the high side have contained the last three days. RSI at 45 is neutral, so momentum is not blocking a move either way. The floor is 8.4% away and the ceiling is nowhere close. Down 3.2% over 24 hours.
🔴 $PAXG · 1H
$PAXG trades at $4,037, still on the weak side of its hourly averages. The three day range runs from $3,905 up to $4,137. Momentum is mid range with RSI at 36. Resistance sits 2.5% above and support 3.3% below. Down 2.2% over 24 hours.
DYOR
$TRUMP $PAXG #Crypto
10
Voir la traduction
🔴 $CRCLB · 4H
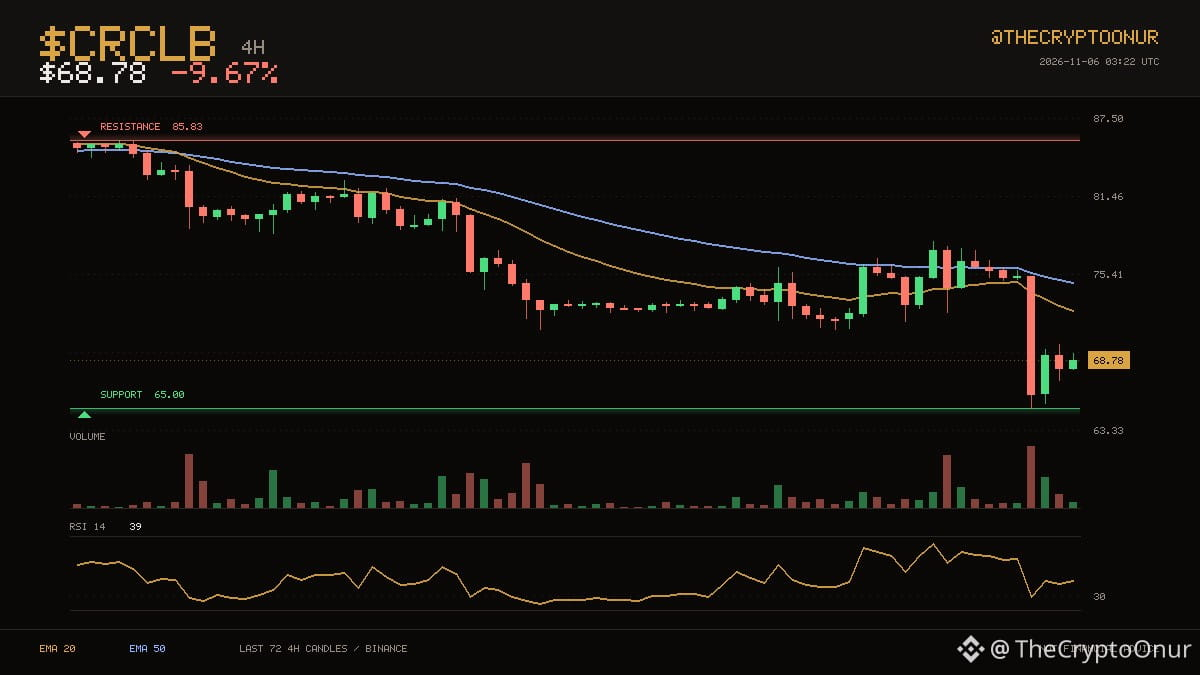
Price is $68.78 and $CRCLB remains below the averages that capped it earlier. Buyers have been showing up around $65.00, which is where price is sitting now. It is sitting in the bottom third of the range. Support is the near one at 5.5% below; the range high is far above. Averages have been ordered the same way for a long stretch now, with the 20 below the 50. Momentum is mid range with RSI at 39. The 24 hour range runs $65.00 to $76.43, and price is around the middle of it. Volume is close to normal at 1.3x the recent average. Down 9.7% over 24 hours.
DYOR
$CRCLB #Crypto
🔴 $CRCLB · 4H
Price is $68.78 and $CRCLB remains below the averages that capped it earlier. Buyers have been showing up around $65.00, which is where price is sitting now. It is sitting in the bottom third of the range. Support is the near one at 5.5% below; the range high is far above. Averages have been ordered the same way for a long stretch now, with the 20 below the 50. Momentum is mid range with RSI at 39. The 24 hour range runs $65.00 to $76.43, and price is around the middle of it. Volume is close to normal at 1.3x the recent average. Down 9.7% over 24 hours.
DYOR
$CRCLB #Crypto
Price is $68.78 and $CRCLB remains below the averages that capped it earlier. Buyers have been showing up around $65.00, which is where price is sitting now. It is sitting in the bottom third of the range. Support is the near one at 5.5% below; the range high is far above. Averages have been ordered the same way for a long stretch now, with the 20 below the 50. Momentum is mid range with RSI at 39. The 24 hour range runs $65.00 to $76.43, and price is around the middle of it. Volume is close to normal at 1.3x the recent average. Down 9.7% over 24 hours.
DYOR
$CRCLB #Crypto
12
Voir la traduction
📉 $SUI · 4H
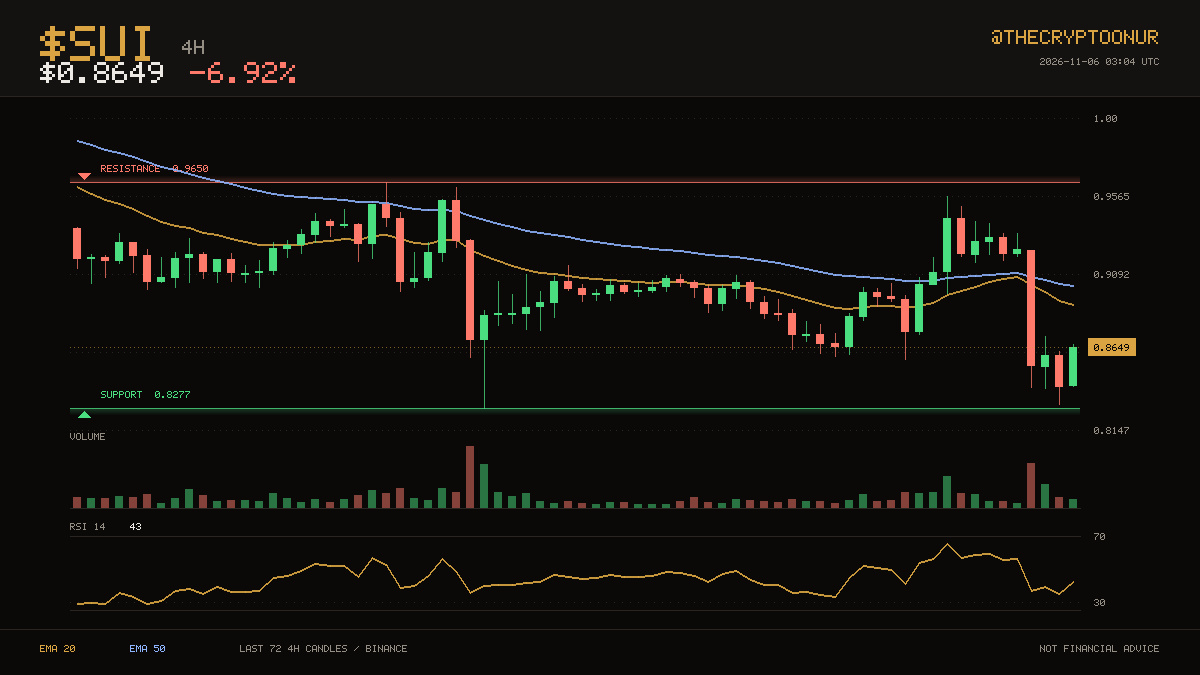
The action has stayed between $0.8277 and $0.9650 over the last two weeks. $SUI is at $0.8649, under both its 20 and 50 4-hour averages. It is sitting in the bottom third of the range. Resistance sits 11.6% above and support 4.3% below. Averages have been ordered the same way for a long stretch now, with the 20 below the 50. Momentum is mid range with RSI at 43. The 24 hour range runs $0.8304 to $0.9401, and price is around the middle of it. Volume is close to normal at 0.9x the recent average. Down 6.9% over 24 hours.
Binance spot data. DYOR
$SUI #Binance
📉 $SUI · 4H
The action has stayed between $0.8277 and $0.9650 over the last two weeks. $SUI is at $0.8649, under both its 20 and 50 4-hour averages. It is sitting in the bottom third of the range. Resistance sits 11.6% above and support 4.3% below. Averages have been ordered the same way for a long stretch now, with the 20 below the 50. Momentum is mid range with RSI at 43. The 24 hour range runs $0.8304 to $0.9401, and price is around the middle of it. Volume is close to normal at 0.9x the recent average. Down 6.9% over 24 hours.
Binance spot data. DYOR
$SUI #Binance
The action has stayed between $0.8277 and $0.9650 over the last two weeks. $SUI is at $0.8649, under both its 20 and 50 4-hour averages. It is sitting in the bottom third of the range. Resistance sits 11.6% above and support 4.3% below. Averages have been ordered the same way for a long stretch now, with the 20 below the 50. Momentum is mid range with RSI at 43. The 24 hour range runs $0.8304 to $0.9401, and price is around the middle of it. Volume is close to normal at 0.9x the recent average. Down 6.9% over 24 hours.
Binance spot data. DYOR
$SUI #Binance
14
Voir la traduction
📉 $PEPE · 1D
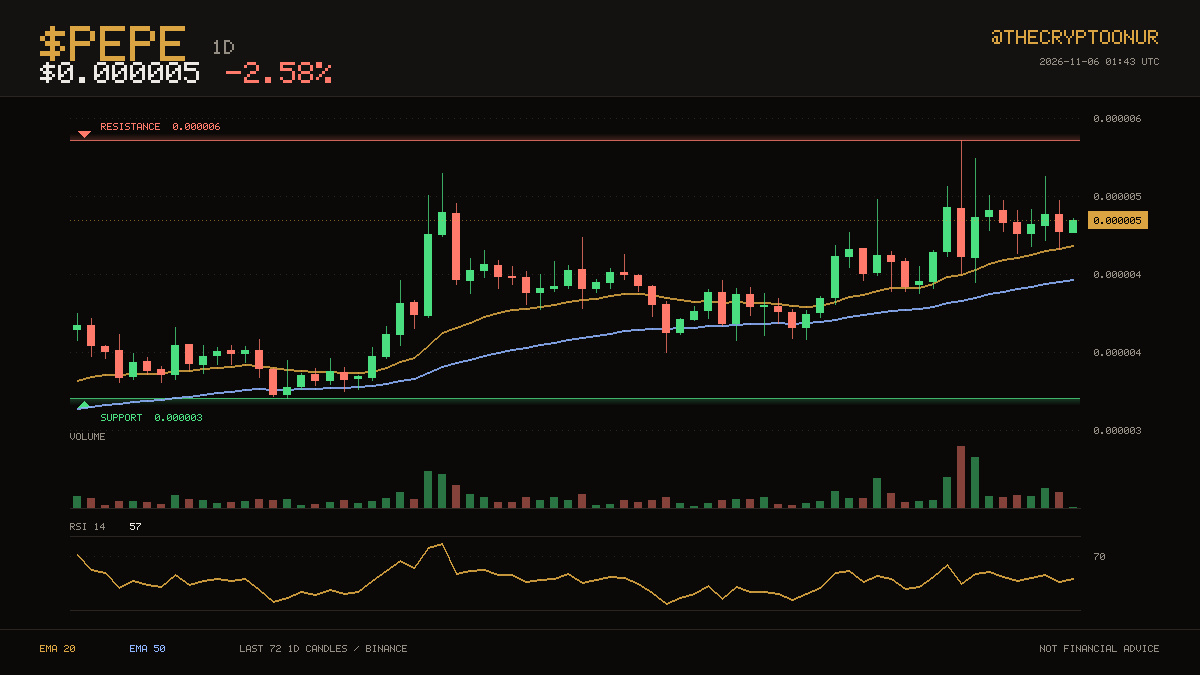
The action has stayed between $0.000003 and $0.000006 over the last two months. $PEPE is trading at $0.000005, above both its 20 and 50 daily averages. It is trading in the top third of the range right now. Both edges of the range are far from here, so neither is in play yet. Averages have been ordered the same way for a long stretch now, with the 20 above the 50. Momentum is mid range with RSI at 57. The 24 hour range runs $0.000005 to $0.000005, and price is around the middle of it. Volume over the past day is running about 2.2x the recent average, so there is real participation behind this. Down 2.6% over 24 hours.
Binance spot data. DYOR
$PEPE #Binance
📉 $PEPE · 1D
The action has stayed between $0.000003 and $0.000006 over the last two months. $PEPE is trading at $0.000005, above both its 20 and 50 daily averages. It is trading in the top third of the range right now. Both edges of the range are far from here, so neither is in play yet. Averages have been ordered the same way for a long stretch now, with the 20 above the 50. Momentum is mid range with RSI at 57. The 24 hour range runs $0.000005 to $0.000005, and price is around the middle of it. Volume over the past day is running about 2.2x the recent average, so there is real participation behind this. Down 2.6% over 24 hours.
Binance spot data. DYOR
$PEPE #Binance
The action has stayed between $0.000003 and $0.000006 over the last two months. $PEPE is trading at $0.000005, above both its 20 and 50 daily averages. It is trading in the top third of the range right now. Both edges of the range are far from here, so neither is in play yet. Averages have been ordered the same way for a long stretch now, with the 20 above the 50. Momentum is mid range with RSI at 57. The 24 hour range runs $0.000005 to $0.000005, and price is around the middle of it. Volume over the past day is running about 2.2x the recent average, so there is real participation behind this. Down 2.6% over 24 hours.
Binance spot data. DYOR
$PEPE #Binance
41
Voir la traduction
🔴 $XAUT · 1D
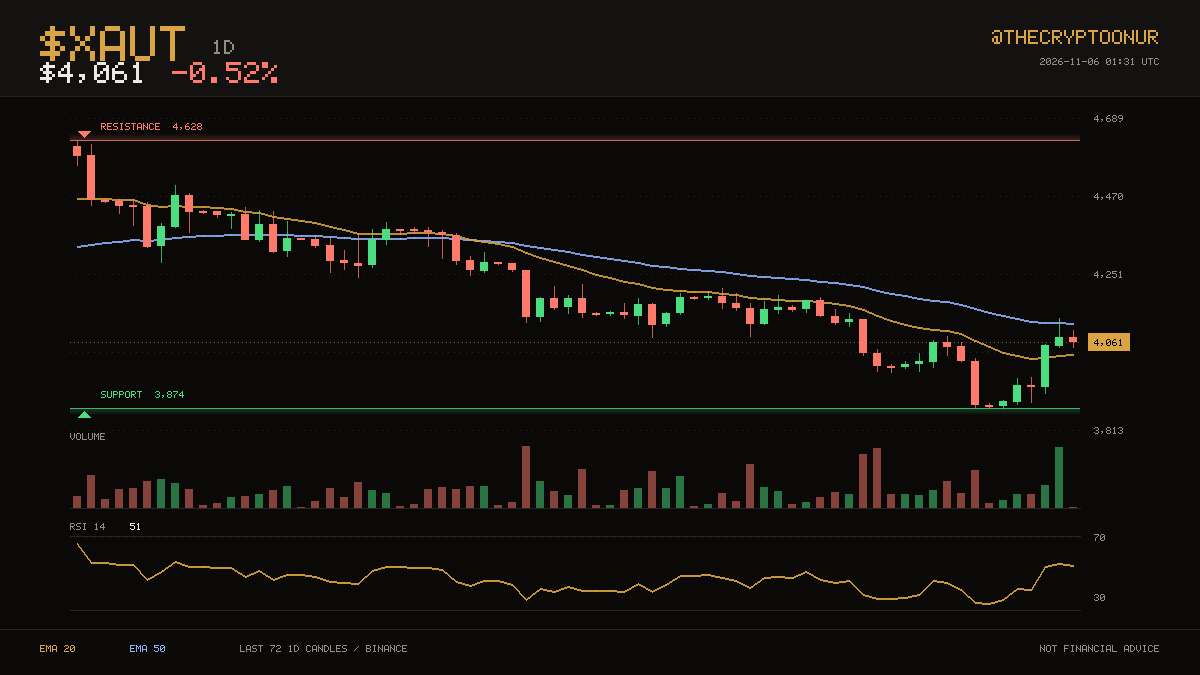
At $4,061, $XAUT is sitting right in the middle of its daily averages. $3,874 on the low side and $4,628 on the high side have contained the last two months. Price is down in the lower third of that range. That is 14.0% to the ceiling and 4.6% to the floor. The 20 has stayed below the 50 for 43 candles. RSI at 51 is neutral, so momentum is not blocking a move either way. Over the past day it has traded between $4,046 and $4,128, sitting near the bottom of it now. Turnover is unremarkable, running 1.3x the recent average. Down 0.5% over 24 hours.
DYOR
$XAUT #TechnicalAnalysis
🔴 $XAUT · 1D
At $4,061, $XAUT is sitting right in the middle of its daily averages. $3,874 on the low side and $4,628 on the high side have contained the last two months. Price is down in the lower third of that range. That is 14.0% to the ceiling and 4.6% to the floor. The 20 has stayed below the 50 for 43 candles. RSI at 51 is neutral, so momentum is not blocking a move either way. Over the past day it has traded between $4,046 and $4,128, sitting near the bottom of it now. Turnover is unremarkable, running 1.3x the recent average. Down 0.5% over 24 hours.
DYOR
$XAUT #TechnicalAnalysis
At $4,061, $XAUT is sitting right in the middle of its daily averages. $3,874 on the low side and $4,628 on the high side have contained the last two months. Price is down in the lower third of that range. That is 14.0% to the ceiling and 4.6% to the floor. The 20 has stayed below the 50 for 43 candles. RSI at 51 is neutral, so momentum is not blocking a move either way. Over the past day it has traded between $4,046 and $4,128, sitting near the bottom of it now. Turnover is unremarkable, running 1.3x the recent average. Down 0.5% over 24 hours.
DYOR
$XAUT #TechnicalAnalysis
32
Voir la traduction
🔴 $QQQB · 1H
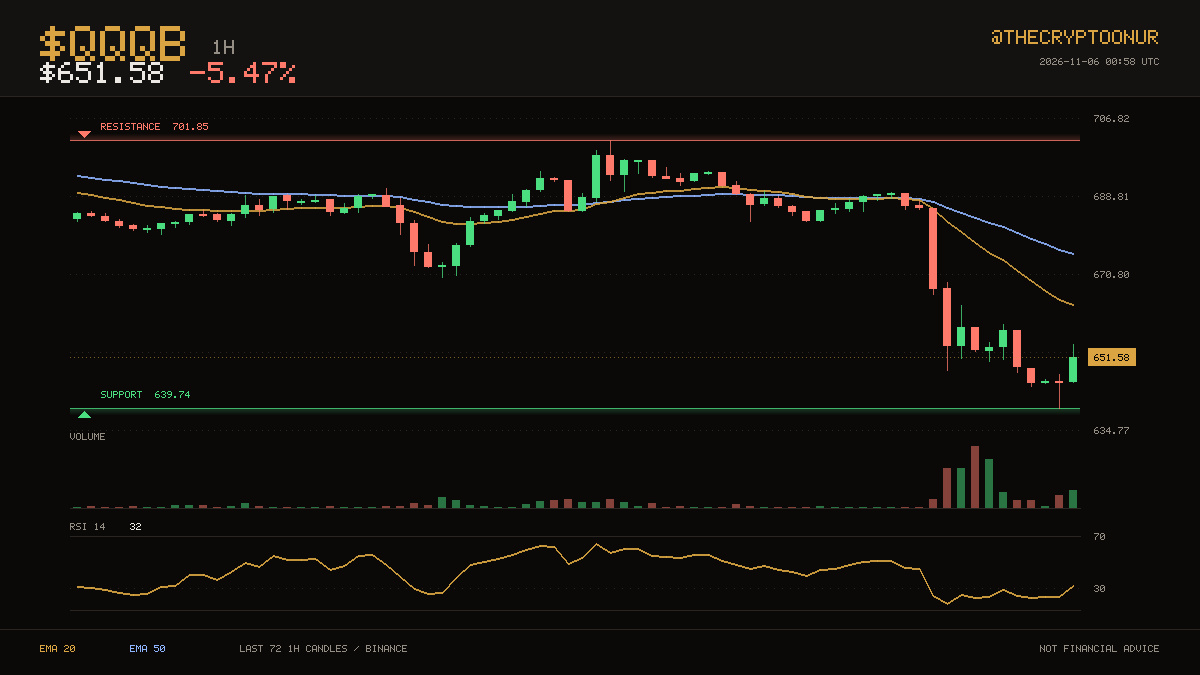
Price is $651.58 and $QQQB remains below the averages that capped it earlier. Buyers have been showing up around $639.74, which is where price is sitting now. It is sitting in the bottom third of the range. Resistance sits 7.7% above and support 1.8% below. Averages have been ordered the same way for only 19 candles, with the 20 below the 50. Momentum is mid range with RSI at 32. The 24 hour range runs $639.74 to $690.05, and price is near the bottom of it. Volume over the past day is running about 5.6x the recent average, so there is real participation behind this. Down 5.5% over 24 hours.
DYOR
$QQQB #Crypto
🔴 $QQQB · 1H
Price is $651.58 and $QQQB remains below the averages that capped it earlier. Buyers have been showing up around $639.74, which is where price is sitting now. It is sitting in the bottom third of the range. Resistance sits 7.7% above and support 1.8% below. Averages have been ordered the same way for only 19 candles, with the 20 below the 50. Momentum is mid range with RSI at 32. The 24 hour range runs $639.74 to $690.05, and price is near the bottom of it. Volume over the past day is running about 5.6x the recent average, so there is real participation behind this. Down 5.5% over 24 hours.
DYOR
$QQQB #Crypto
Price is $651.58 and $QQQB remains below the averages that capped it earlier. Buyers have been showing up around $639.74, which is where price is sitting now. It is sitting in the bottom third of the range. Resistance sits 7.7% above and support 1.8% below. Averages have been ordered the same way for only 19 candles, with the 20 below the 50. Momentum is mid range with RSI at 32. The 24 hour range runs $639.74 to $690.05, and price is near the bottom of it. Volume over the past day is running about 5.6x the recent average, so there is real participation behind this. Down 5.5% over 24 hours.
DYOR
$QQQB #Crypto
51
📉 $ENA · 1H
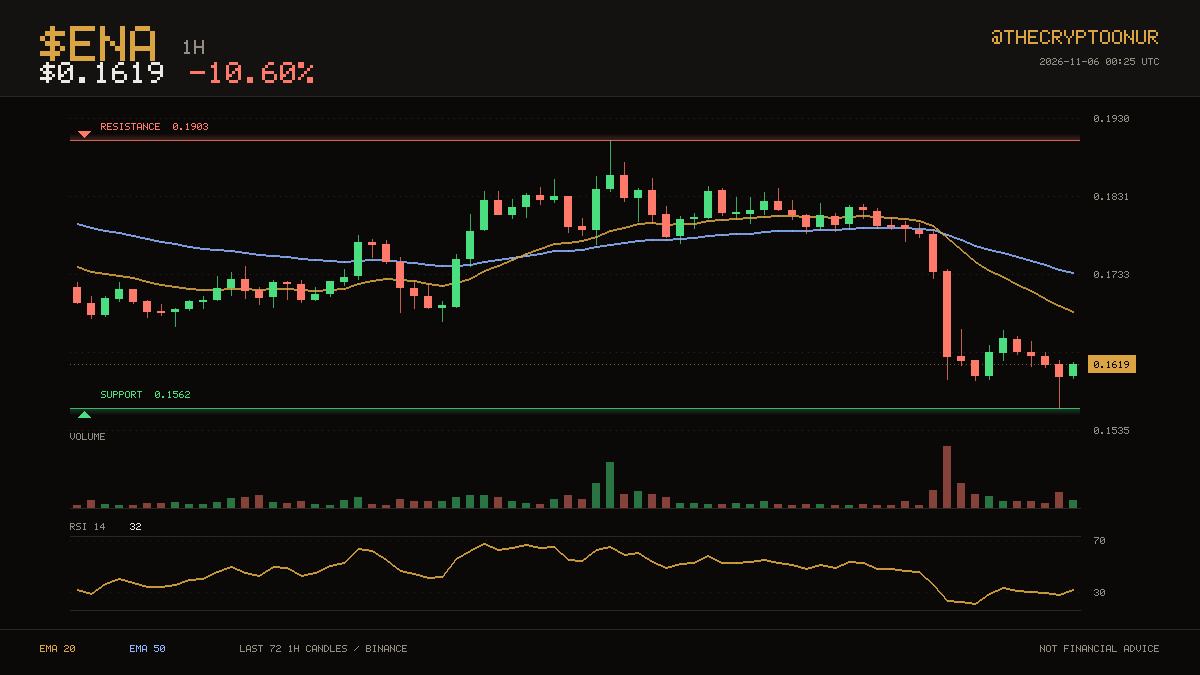
Les acheteurs se manifestent autour de 0,1562 $, où le prix se trouve actuellement. $ENA est à 0,1619 $, sous ses moyennes horaires à 20 et 50 périodes. Le prix se situe dans le tiers inférieur de la fourchette. Le support est le niveau le plus proche, à 3,5 % en dessous ; le haut de la fourchette est bien plus éloigné. Ce changement est récent : la moyenne à 20 périodes est sous celle à 50 périodes depuis seulement 10 bougies. La dynamique est à mi-parcours, avec un RSI à 32. La fourchette sur 24 heures va de 0,1562 $ à 0,1841 $, et le prix est près de son plancher. Le volume est proche de la normale, à 1,4 fois la moyenne récente. En baisse de 10,6 % sur 24 heures.
Données spot de Binance. Faites vos propres recherches.
$ENA #Binance
📉 $ENA · 1H
Les acheteurs se manifestent autour de 0,1562 $, où le prix se trouve actuellement. $ENA est à 0,1619 $, sous ses moyennes horaires à 20 et 50 périodes. Le prix se situe dans le tiers inférieur de la fourchette. Le support est le niveau le plus proche, à 3,5 % en dessous ; le haut de la fourchette est bien plus éloigné. Ce changement est récent : la moyenne à 20 périodes est sous celle à 50 périodes depuis seulement 10 bougies. La dynamique est à mi-parcours, avec un RSI à 32. La fourchette sur 24 heures va de 0,1562 $ à 0,1841 $, et le prix est près de son plancher. Le volume est proche de la normale, à 1,4 fois la moyenne récente. En baisse de 10,6 % sur 24 heures.
Données spot de Binance. Faites vos propres recherches.
$ENA #Binance
Les acheteurs se manifestent autour de 0,1562 $, où le prix se trouve actuellement. $ENA est à 0,1619 $, sous ses moyennes horaires à 20 et 50 périodes. Le prix se situe dans le tiers inférieur de la fourchette. Le support est le niveau le plus proche, à 3,5 % en dessous ; le haut de la fourchette est bien plus éloigné. Ce changement est récent : la moyenne à 20 périodes est sous celle à 50 périodes depuis seulement 10 bougies. La dynamique est à mi-parcours, avec un RSI à 32. La fourchette sur 24 heures va de 0,1562 $ à 0,1841 $, et le prix est près de son plancher. Le volume est proche de la normale, à 1,4 fois la moyenne récente. En baisse de 10,6 % sur 24 heures.
Données spot de Binance. Faites vos propres recherches.
$ENA #Binance
71
Voir la traduction
📉 $DOGE · 1H
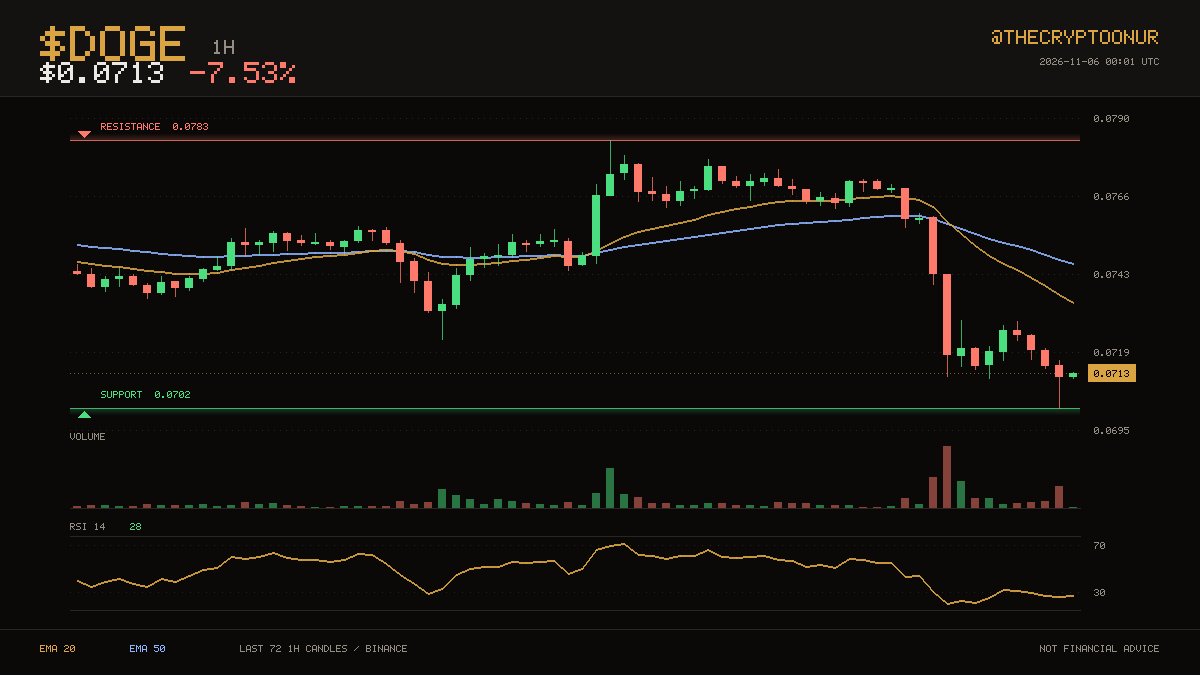
$DOGE trades at $0.0713, still on the weak side of its hourly averages. The $0.0702 area held twice over the last three days and is being tested again. Price is down in the lower third of that range. That is 9.9% to the ceiling and 1.5% to the floor. The 20 crossed below the 50 recently, for only 9 candles, so this leg is still young. RSI at 28 is deep in oversold territory. Over the past day it has traded between $0.0702 and $0.0775, sitting near the bottom of it now. The last 24 hours carried roughly 2.3x normal volume. Down 7.5% over 24 hours.
⚠️ DYOR
$DOGE #Trading
📉 $DOGE · 1H
$DOGE trades at $0.0713, still on the weak side of its hourly averages. The $0.0702 area held twice over the last three days and is being tested again. Price is down in the lower third of that range. That is 9.9% to the ceiling and 1.5% to the floor. The 20 crossed below the 50 recently, for only 9 candles, so this leg is still young. RSI at 28 is deep in oversold territory. Over the past day it has traded between $0.0702 and $0.0775, sitting near the bottom of it now. The last 24 hours carried roughly 2.3x normal volume. Down 7.5% over 24 hours.
⚠️ DYOR
$DOGE #Trading
$DOGE trades at $0.0713, still on the weak side of its hourly averages. The $0.0702 area held twice over the last three days and is being tested again. Price is down in the lower third of that range. That is 9.9% to the ceiling and 1.5% to the floor. The 20 crossed below the 50 recently, for only 9 candles, so this leg is still young. RSI at 28 is deep in oversold territory. Over the past day it has traded between $0.0702 and $0.0775, sitting near the bottom of it now. The last 24 hours carried roughly 2.3x normal volume. Down 7.5% over 24 hours.
⚠️ DYOR
$DOGE #Trading
83
🔴 $HYPE · 4 h
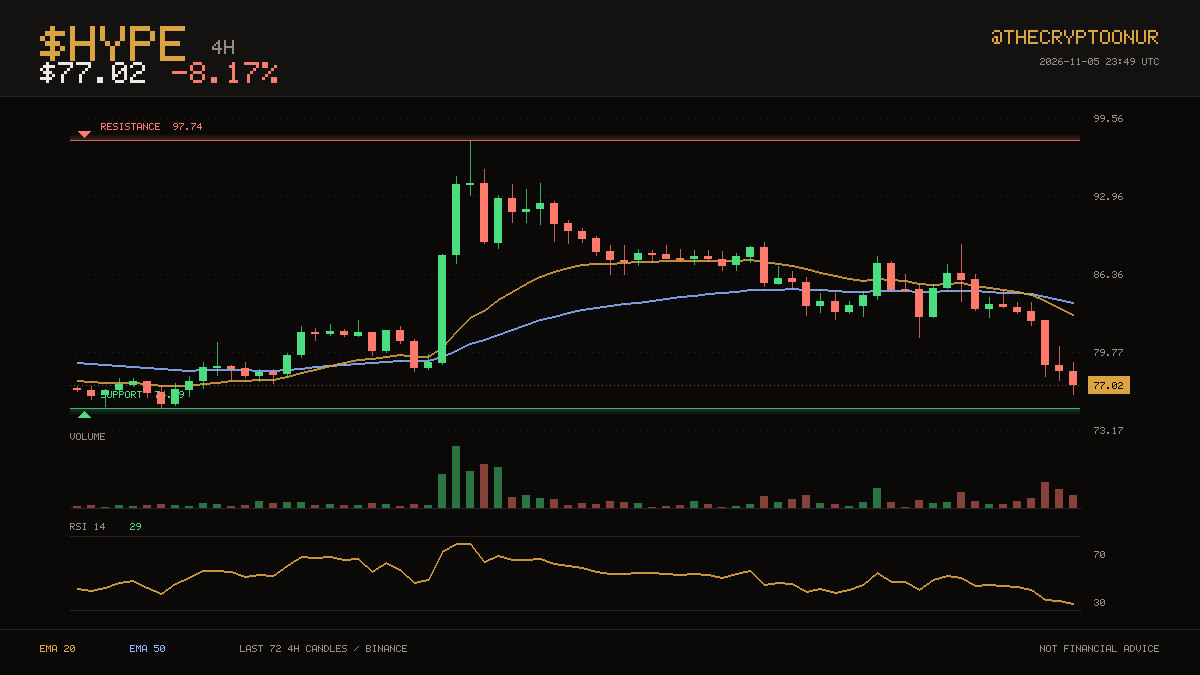
Le prix est de 77,02 $ et $HYPE reste sous les moyennes qui l’avaient plafonné plus tôt. La zone des 74,99 $ a tenu deux fois au cours des deux dernières semaines et est de nouveau mise à l’épreuve. Le prix se situe dans le tiers inférieur de cette fourchette. Le plancher est à 2,6 % et le plafond est encore loin. La moyenne mobile à 20 périodes est récemment passée sous celle à 50 périodes, mais depuis seulement 4 bougies : ce mouvement est donc encore récent. Avec un RSI à 29, le titre est profondément en zone de survente. Au cours des dernières 24 heures, il a évolué entre 76,25 $ et 84,90 $, et se trouve maintenant près du bas de cette fourchette. Le volume est ordinaire, à 1,2 fois la moyenne récente. En baisse de 8,2 % sur 24 heures.
⚠️ Faites vos propres recherches
$HYPE #AnalyseTechnique
🔴 $HYPE · 4 h
Le prix est de 77,02 $ et $HYPE reste sous les moyennes qui l’avaient plafonné plus tôt. La zone des 74,99 $ a tenu deux fois au cours des deux dernières semaines et est de nouveau mise à l’épreuve. Le prix se situe dans le tiers inférieur de cette fourchette. Le plancher est à 2,6 % et le plafond est encore loin. La moyenne mobile à 20 périodes est récemment passée sous celle à 50 périodes, mais depuis seulement 4 bougies : ce mouvement est donc encore récent. Avec un RSI à 29, le titre est profondément en zone de survente. Au cours des dernières 24 heures, il a évolué entre 76,25 $ et 84,90 $, et se trouve maintenant près du bas de cette fourchette. Le volume est ordinaire, à 1,2 fois la moyenne récente. En baisse de 8,2 % sur 24 heures.
⚠️ Faites vos propres recherches
$HYPE #AnalyseTechnique
Le prix est de 77,02 $ et $HYPE reste sous les moyennes qui l’avaient plafonné plus tôt. La zone des 74,99 $ a tenu deux fois au cours des deux dernières semaines et est de nouveau mise à l’épreuve. Le prix se situe dans le tiers inférieur de cette fourchette. Le plancher est à 2,6 % et le plafond est encore loin. La moyenne mobile à 20 périodes est récemment passée sous celle à 50 périodes, mais depuis seulement 4 bougies : ce mouvement est donc encore récent. Avec un RSI à 29, le titre est profondément en zone de survente. Au cours des dernières 24 heures, il a évolué entre 76,25 $ et 84,90 $, et se trouve maintenant près du bas de cette fourchette. Le volume est ordinaire, à 1,2 fois la moyenne récente. En baisse de 8,2 % sur 24 heures.
⚠️ Faites vos propres recherches
$HYPE #AnalyseTechnique
20
Voir la traduction
📉 $NEAR · 4H
Buyers have been showing up around $3.63, which is where price is sitting now. $NEAR is at $3.63, under both its 20 and 50 4-hour averages. It is sitting in the bottom third of the range. Support is the near one at 0.1% below; the range high is far above. Averages have been ordered the same way for a long stretch now, with the 20 below the 50. Momentum is mid range with RSI at 32. The 24 hour range runs $3.63 to $4.08, and price is near the bottom of it. Volume is close to normal at 0.7x the recent average. Down 9.8% over 24 hours.
Binance spot data. DYOR
$NEAR #Binance
📉 $NEAR · 4H
Buyers have been showing up around $3.63, which is where price is sitting now. $NEAR is at $3.63, under both its 20 and 50 4-hour averages. It is sitting in the bottom third of the range. Support is the near one at 0.1% below; the range high is far above. Averages have been ordered the same way for a long stretch now, with the 20 below the 50. Momentum is mid range with RSI at 32. The 24 hour range runs $3.63 to $4.08, and price is near the bottom of it. Volume is close to normal at 0.7x the recent average. Down 9.8% over 24 hours.
Binance spot data. DYOR
$NEAR #Binance
Buyers have been showing up around $3.63, which is where price is sitting now. $NEAR is at $3.63, under both its 20 and 50 4-hour averages. It is sitting in the bottom third of the range. Support is the near one at 0.1% below; the range high is far above. Averages have been ordered the same way for a long stretch now, with the 20 below the 50. Momentum is mid range with RSI at 32. The 24 hour range runs $3.63 to $4.08, and price is near the bottom of it. Volume is close to normal at 0.7x the recent average. Down 9.8% over 24 hours.
Binance spot data. DYOR
$NEAR #Binance
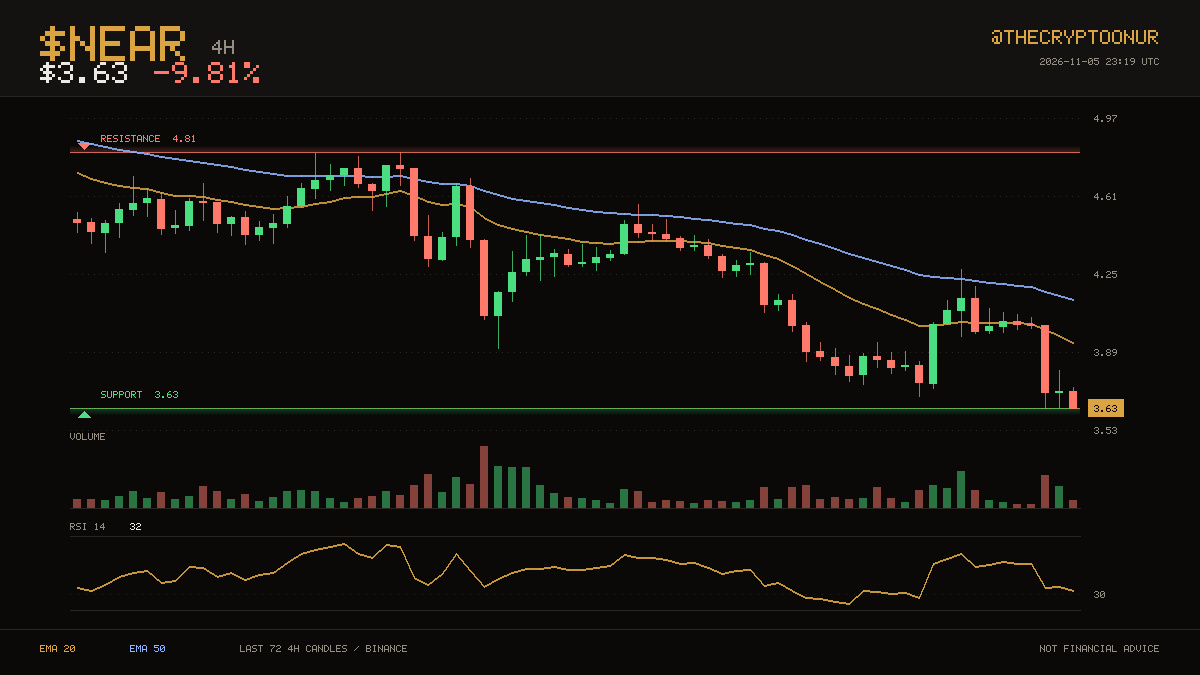
7
Voir la traduction
📉 $SOXLB · 4H
$SOXLB trades at $40.21, still on the weak side of its 4-hour averages. The $40.21 area held twice over the last two weeks and is being tested again. Price is down in the lower third of that range. The floor is 0.0% away and the ceiling is nowhere close. The 20 has stayed below the 50 for 40 candles. RSI at 24 is deep in oversold territory. Over the past day it has traded between $40.21 and $66.42, sitting near the bottom of it now. The last 24 hours carried roughly 1.9x normal volume. Down 38.8% over 24 hours.
⚠️ DYOR
$SOXLB #Trading
📉 $SOXLB · 4H
$SOXLB trades at $40.21, still on the weak side of its 4-hour averages. The $40.21 area held twice over the last two weeks and is being tested again. Price is down in the lower third of that range. The floor is 0.0% away and the ceiling is nowhere close. The 20 has stayed below the 50 for 40 candles. RSI at 24 is deep in oversold territory. Over the past day it has traded between $40.21 and $66.42, sitting near the bottom of it now. The last 24 hours carried roughly 1.9x normal volume. Down 38.8% over 24 hours.
⚠️ DYOR
$SOXLB #Trading
$SOXLB trades at $40.21, still on the weak side of its 4-hour averages. The $40.21 area held twice over the last two weeks and is being tested again. Price is down in the lower third of that range. The floor is 0.0% away and the ceiling is nowhere close. The 20 has stayed below the 50 for 40 candles. RSI at 24 is deep in oversold territory. Over the past day it has traded between $40.21 and $66.42, sitting near the bottom of it now. The last 24 hours carried roughly 1.9x normal volume. Down 38.8% over 24 hours.
⚠️ DYOR
$SOXLB #Trading
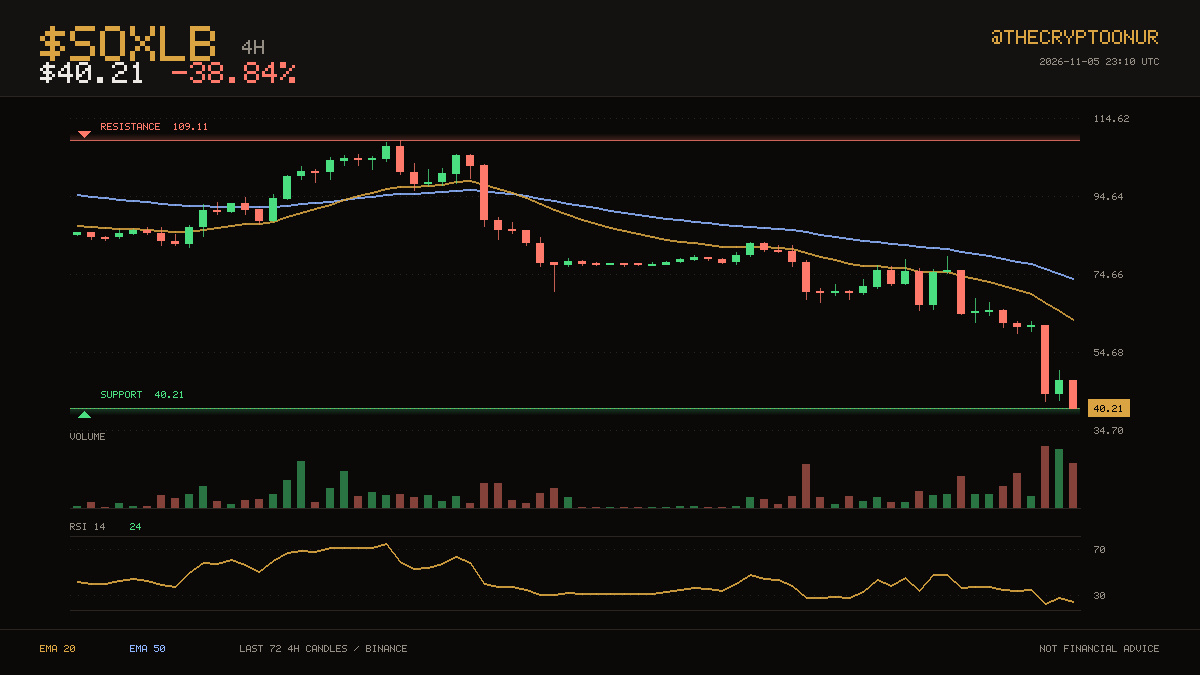
13
Voir la traduction
📉 $SNDKB · 1H
$SNDKB trades at $818.06, still on the weak side of its hourly averages. Buyers have been showing up around $794.03, which is where price is sitting now. It is sitting in the bottom third of the range. Support is the near one at 2.9% below; the range high is far above. Averages have been ordered the same way for a long stretch now, with the 20 below the 50. RSI has dropped to 27, the kind of reading that usually comes with a bounce attempt. The 24 hour range runs $794.03 to $1,044, and price is near the bottom of it. Volume over the past day is running about 3.2x the recent average, so there is real participation behind this. Down 21.6% over 24 hours.
⚠️ DYOR
$SNDKB #Crypto
📉 $SNDKB · 1H
$SNDKB trades at $818.06, still on the weak side of its hourly averages. Buyers have been showing up around $794.03, which is where price is sitting now. It is sitting in the bottom third of the range. Support is the near one at 2.9% below; the range high is far above. Averages have been ordered the same way for a long stretch now, with the 20 below the 50. RSI has dropped to 27, the kind of reading that usually comes with a bounce attempt. The 24 hour range runs $794.03 to $1,044, and price is near the bottom of it. Volume over the past day is running about 3.2x the recent average, so there is real participation behind this. Down 21.6% over 24 hours.
⚠️ DYOR
$SNDKB #Crypto
$SNDKB trades at $818.06, still on the weak side of its hourly averages. Buyers have been showing up around $794.03, which is where price is sitting now. It is sitting in the bottom third of the range. Support is the near one at 2.9% below; the range high is far above. Averages have been ordered the same way for a long stretch now, with the 20 below the 50. RSI has dropped to 27, the kind of reading that usually comes with a bounce attempt. The 24 hour range runs $794.03 to $1,044, and price is near the bottom of it. Volume over the past day is running about 3.2x the recent average, so there is real participation behind this. Down 21.6% over 24 hours.
⚠️ DYOR
$SNDKB #Crypto
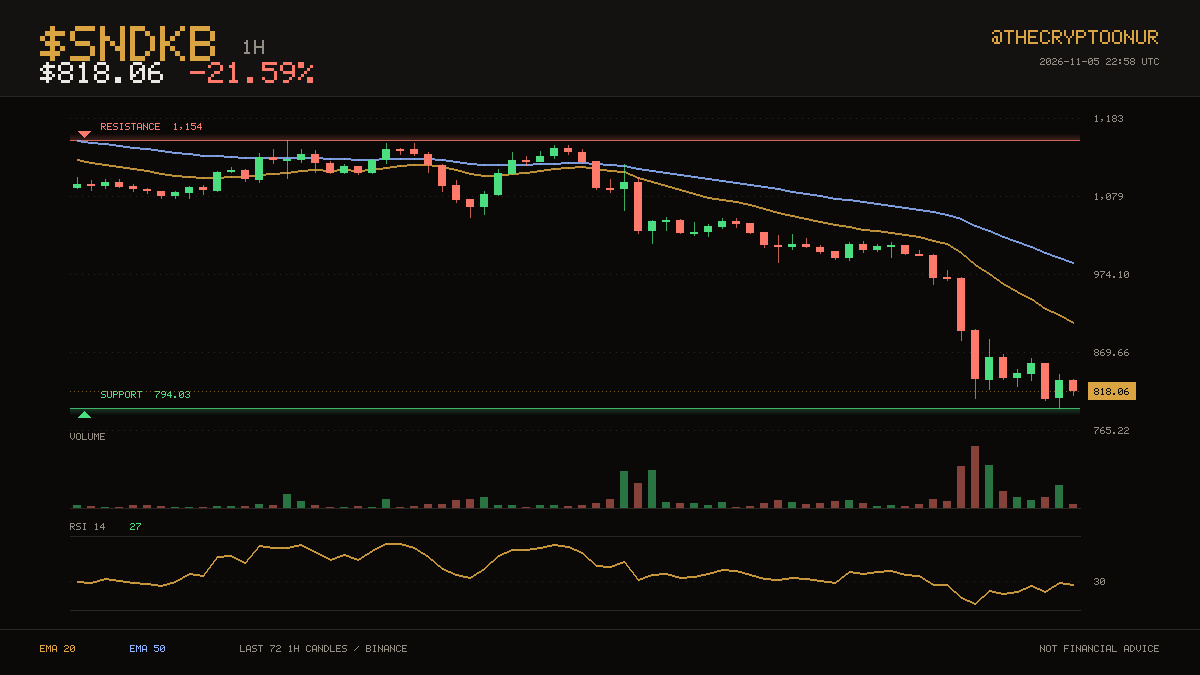
21
Voir la traduction
📉 $UNI · 1H
The $6.59 area held twice over the last three days and is being tested again. $UNI is at $6.78, under both its 20 and 50 hourly averages. Price is down in the lower third of that range. The floor is 2.9% away and the ceiling is nowhere close. The 20 crossed below the 50 recently, for only 7 candles, so this leg is still young. RSI at 28 is deep in oversold territory. Over the past day it has traded between $6.59 and $7.82, sitting near the bottom of it now. The last 24 hours carried roughly 2.2x normal volume. Down 12.6% over 24 hours.
⚠️ DYOR
$UNI #Binance
📉 $UNI · 1H
The $6.59 area held twice over the last three days and is being tested again. $UNI is at $6.78, under both its 20 and 50 hourly averages. Price is down in the lower third of that range. The floor is 2.9% away and the ceiling is nowhere close. The 20 crossed below the 50 recently, for only 7 candles, so this leg is still young. RSI at 28 is deep in oversold territory. Over the past day it has traded between $6.59 and $7.82, sitting near the bottom of it now. The last 24 hours carried roughly 2.2x normal volume. Down 12.6% over 24 hours.
⚠️ DYOR
$UNI #Binance
The $6.59 area held twice over the last three days and is being tested again. $UNI is at $6.78, under both its 20 and 50 hourly averages. Price is down in the lower third of that range. The floor is 2.9% away and the ceiling is nowhere close. The 20 crossed below the 50 recently, for only 7 candles, so this leg is still young. RSI at 28 is deep in oversold territory. Over the past day it has traded between $6.59 and $7.82, sitting near the bottom of it now. The last 24 hours carried roughly 2.2x normal volume. Down 12.6% over 24 hours.
⚠️ DYOR
$UNI #Binance
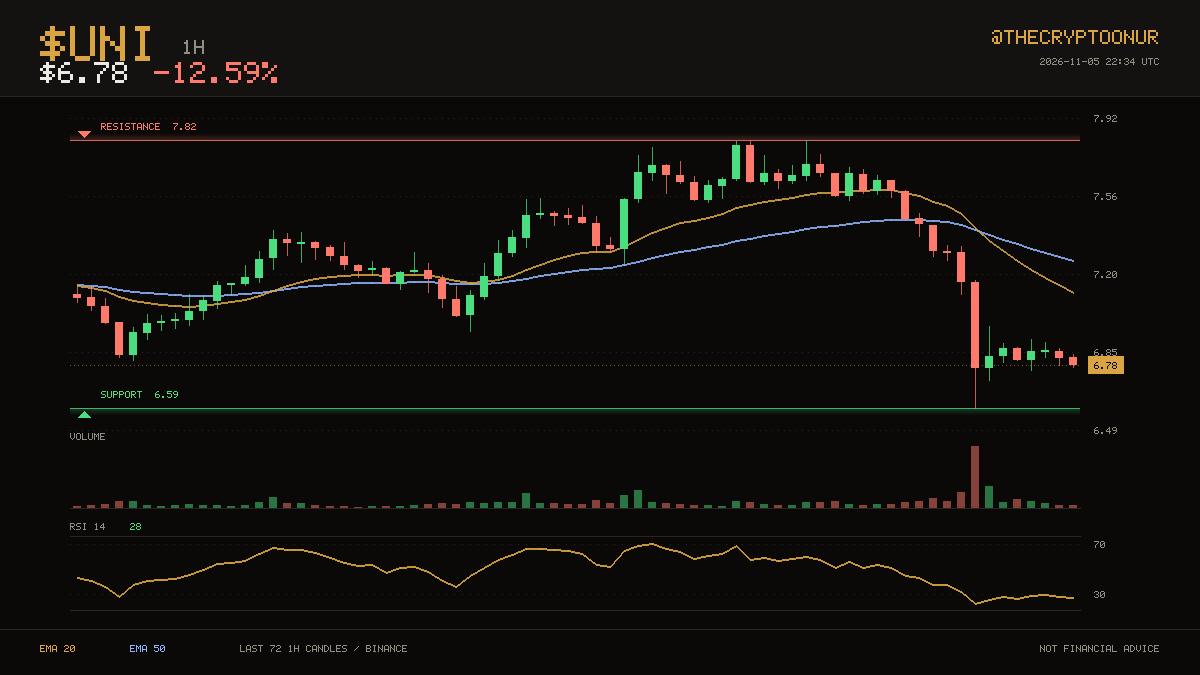
14
Voir la traduction
📉 $KORUB · 1H
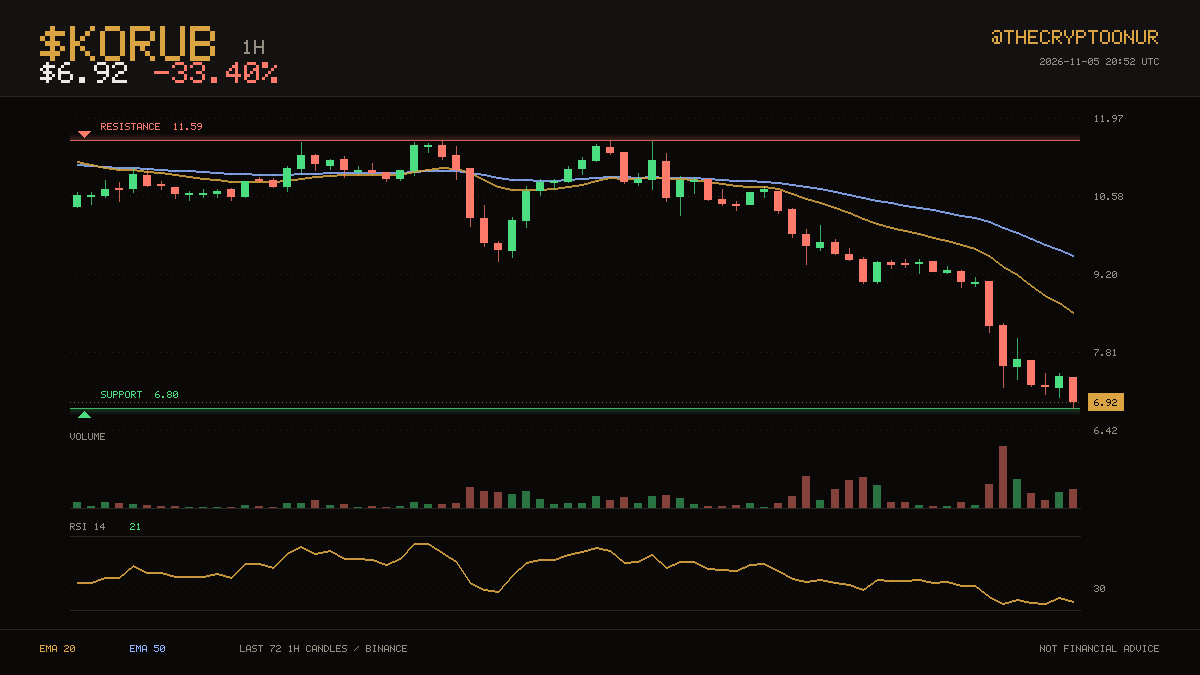
The $6.80 area held twice over the last three days and is being tested again. $KORUB is at $6.92, under both its 20 and 50 hourly averages. Price is down in the lower third of that range. The floor is 1.7% away and the ceiling is nowhere close. The 20 has stayed below the 50 for 44 candles. RSI at 21 is deep in oversold territory. Over the past day it has traded between $6.80 and $10.73, sitting near the bottom of it now. The last 24 hours carried roughly 4.6x normal volume. The 20 average is at $8.52 and the 50 at $9.53. Down 33.4% over 24 hours.
⚠️ DYOR
$KORUB #Binance
📉 $KORUB · 1H
The $6.80 area held twice over the last three days and is being tested again. $KORUB is at $6.92, under both its 20 and 50 hourly averages. Price is down in the lower third of that range. The floor is 1.7% away and the ceiling is nowhere close. The 20 has stayed below the 50 for 44 candles. RSI at 21 is deep in oversold territory. Over the past day it has traded between $6.80 and $10.73, sitting near the bottom of it now. The last 24 hours carried roughly 4.6x normal volume. The 20 average is at $8.52 and the 50 at $9.53. Down 33.4% over 24 hours.
⚠️ DYOR
$KORUB #Binance
The $6.80 area held twice over the last three days and is being tested again. $KORUB is at $6.92, under both its 20 and 50 hourly averages. Price is down in the lower third of that range. The floor is 1.7% away and the ceiling is nowhere close. The 20 has stayed below the 50 for 44 candles. RSI at 21 is deep in oversold territory. Over the past day it has traded between $6.80 and $10.73, sitting near the bottom of it now. The last 24 hours carried roughly 4.6x normal volume. The 20 average is at $8.52 and the 50 at $9.53. Down 33.4% over 24 hours.
⚠️ DYOR
$KORUB #Binance
8
📉 $LTC · 1H
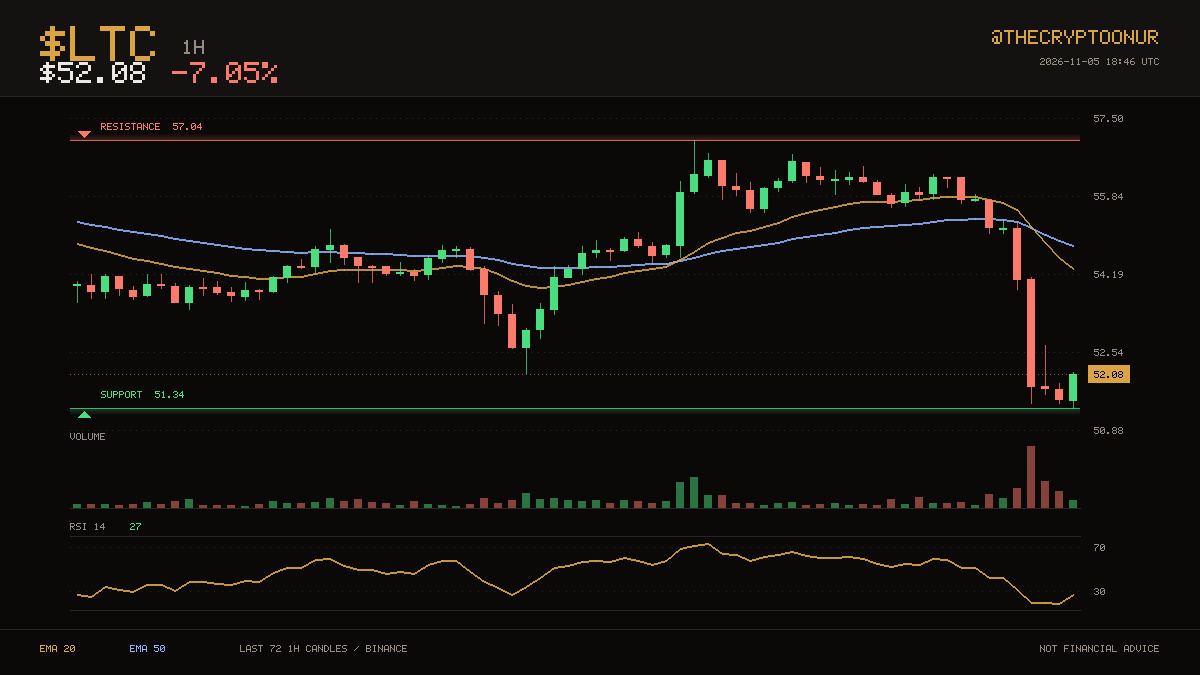
$LTC se négocie à 52,08 $, toujours sous ses moyennes horaires. La zone des 51,34 $ a tenu à deux reprises au cours des trois derniers jours et est de nouveau mise à l’épreuve. Le cours se situe dans le tiers inférieur de cette fourchette : il est à 9,5 % du plafond et à 1,4 % du plancher. La moyenne mobile à 20 périodes est récemment passée sous celle à 50 périodes, mais seulement depuis 3 bougies : ce mouvement est donc encore récent. Avec un RSI à 27, le titre est profondément en zone de survente. Au cours de la dernière journée, il a évolué entre 51,34 $ et 56,73 $ et se trouve actuellement près du bas de cette fourchette. Le volume des dernières 24 heures a été environ 1,8 fois supérieur à la normale. En baisse de 7,0 % sur 24 heures.
⚠️ Faites vos propres recherches (DYOR)
$LTC #Trading
📉 $LTC · 1H
$LTC se négocie à 52,08 $, toujours sous ses moyennes horaires. La zone des 51,34 $ a tenu à deux reprises au cours des trois derniers jours et est de nouveau mise à l’épreuve. Le cours se situe dans le tiers inférieur de cette fourchette : il est à 9,5 % du plafond et à 1,4 % du plancher. La moyenne mobile à 20 périodes est récemment passée sous celle à 50 périodes, mais seulement depuis 3 bougies : ce mouvement est donc encore récent. Avec un RSI à 27, le titre est profondément en zone de survente. Au cours de la dernière journée, il a évolué entre 51,34 $ et 56,73 $ et se trouve actuellement près du bas de cette fourchette. Le volume des dernières 24 heures a été environ 1,8 fois supérieur à la normale. En baisse de 7,0 % sur 24 heures.
⚠️ Faites vos propres recherches (DYOR)
$LTC #Trading
$LTC se négocie à 52,08 $, toujours sous ses moyennes horaires. La zone des 51,34 $ a tenu à deux reprises au cours des trois derniers jours et est de nouveau mise à l’épreuve. Le cours se situe dans le tiers inférieur de cette fourchette : il est à 9,5 % du plafond et à 1,4 % du plancher. La moyenne mobile à 20 périodes est récemment passée sous celle à 50 périodes, mais seulement depuis 3 bougies : ce mouvement est donc encore récent. Avec un RSI à 27, le titre est profondément en zone de survente. Au cours de la dernière journée, il a évolué entre 51,34 $ et 56,73 $ et se trouve actuellement près du bas de cette fourchette. Le volume des dernières 24 heures a été environ 1,8 fois supérieur à la normale. En baisse de 7,0 % sur 24 heures.
⚠️ Faites vos propres recherches (DYOR)
$LTC #Trading
38
📉 $LTC · 1H
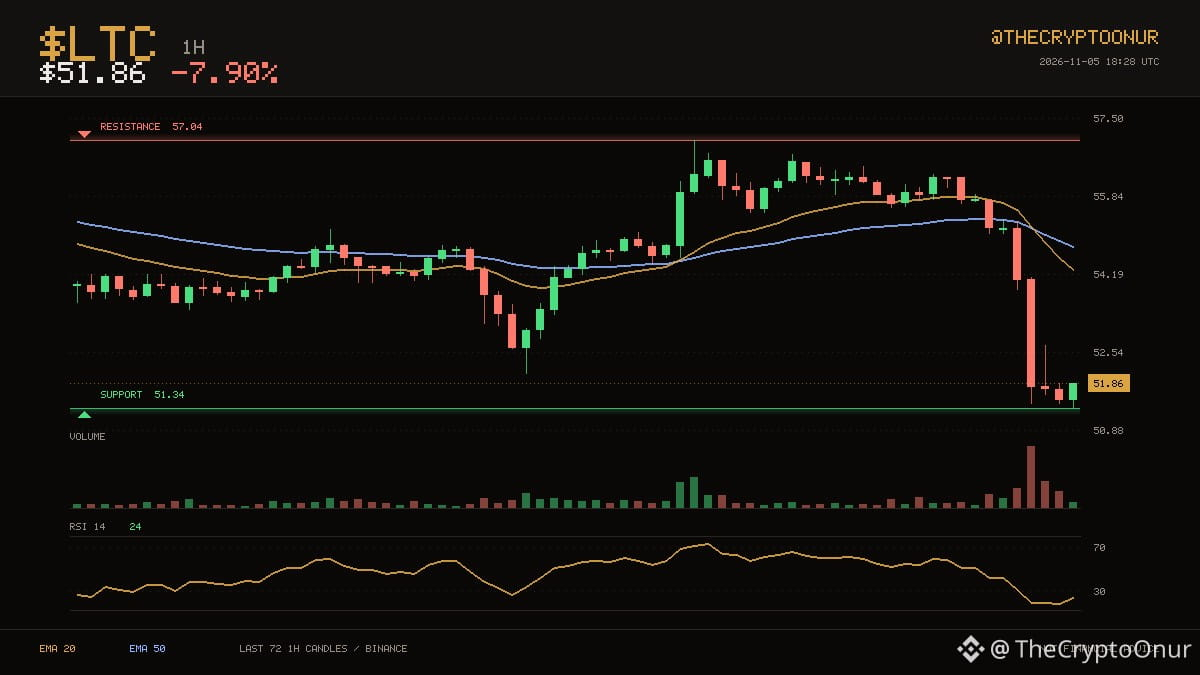
Le prix est de 51,86 $ et $LTC reste sous les moyennes qui l’avaient plafonné auparavant. La zone des 51,34 $ a tenu à deux reprises au cours des trois derniers jours et est de nouveau mise à l’épreuve. Avec un RSI à 24, le titre est profondément en zone de survente. Il n’y a que 1,0 % entre le prix et le support. En baisse de 7,9 % sur 24 heures.
🔴 $INTCB · 1H
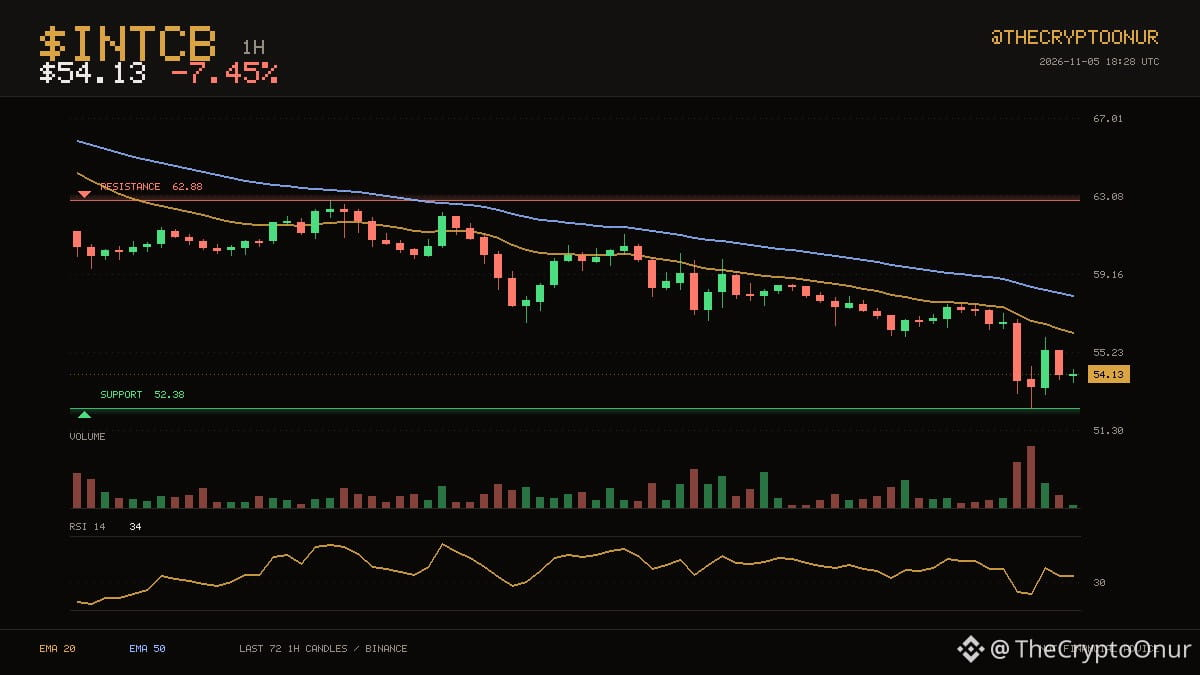
$INTCB s’échange à 54,13 $, toujours en dessous de ses moyennes horaires. Les acheteurs se manifestent autour de 52,38 $, niveau auquel le prix se trouve actuellement. Le momentum est dans la moyenne, avec un RSI à 34. Le support le plus proche se situe 3,2 % plus bas ; le sommet de la fourchette est bien plus haut. En baisse de 7,5 % sur 24 heures.
⚠️ Faites vos propres recherches
$LTC $INTCB #Crypto
📉 $LTC · 1H
Le prix est de 51,86 $ et $LTC reste sous les moyennes qui l’avaient plafonné auparavant. La zone des 51,34 $ a tenu à deux reprises au cours des trois derniers jours et est de nouveau mise à l’épreuve. Avec un RSI à 24, le titre est profondément en zone de survente. Il n’y a que 1,0 % entre le prix et le support. En baisse de 7,9 % sur 24 heures.
🔴 $INTCB · 1H
$INTCB s’échange à 54,13 $, toujours en dessous de ses moyennes horaires. Les acheteurs se manifestent autour de 52,38 $, niveau auquel le prix se trouve actuellement. Le momentum est dans la moyenne, avec un RSI à 34. Le support le plus proche se situe 3,2 % plus bas ; le sommet de la fourchette est bien plus haut. En baisse de 7,5 % sur 24 heures.
⚠️ Faites vos propres recherches
$LTC $INTCB #Crypto
Le prix est de 51,86 $ et $LTC reste sous les moyennes qui l’avaient plafonné auparavant. La zone des 51,34 $ a tenu à deux reprises au cours des trois derniers jours et est de nouveau mise à l’épreuve. Avec un RSI à 24, le titre est profondément en zone de survente. Il n’y a que 1,0 % entre le prix et le support. En baisse de 7,9 % sur 24 heures.
🔴 $INTCB · 1H
$INTCB s’échange à 54,13 $, toujours en dessous de ses moyennes horaires. Les acheteurs se manifestent autour de 52,38 $, niveau auquel le prix se trouve actuellement. Le momentum est dans la moyenne, avec un RSI à 34. Le support le plus proche se situe 3,2 % plus bas ; le sommet de la fourchette est bien plus haut. En baisse de 7,5 % sur 24 heures.
⚠️ Faites vos propres recherches
$LTC $INTCB #Crypto
27
Voir la traduction
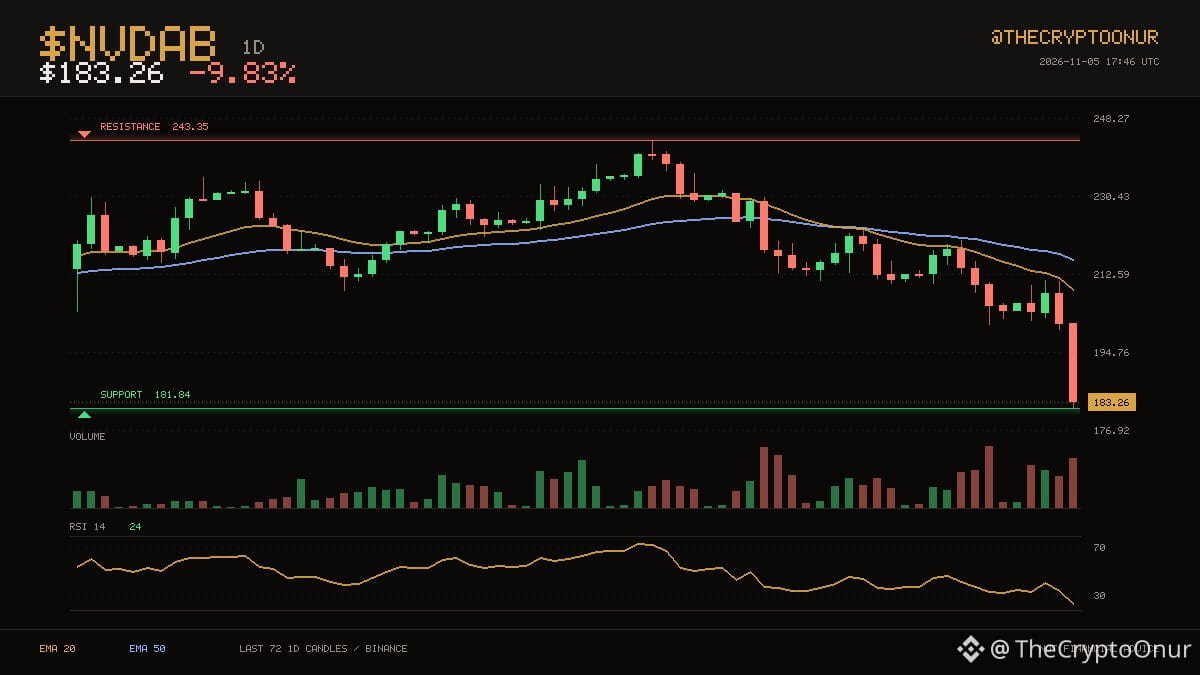
📉 $NVDAB · 1D
$NVDAB trades at $183.26, still on the weak side of its daily averages. The $181.84 area held twice over the last two months and is being tested again. Price is down in the lower third of that range. The floor is 0.8% away and the ceiling is nowhere close. The 20 has stayed below the 50 for only 18 candles. RSI at 24 is deep in oversold territory. Over the past day it has traded between $181.84 and $204.39, sitting near the bottom of it now. The last 24 hours carried roughly 3.7x normal volume. Down 9.8% over 24 hours.
⚠️ DYOR
$NVDAB #Trading
📉 $NVDAB · 1D
$NVDAB trades at $183.26, still on the weak side of its daily averages. The $181.84 area held twice over the last two months and is being tested again. Price is down in the lower third of that range. The floor is 0.8% away and the ceiling is nowhere close. The 20 has stayed below the 50 for only 18 candles. RSI at 24 is deep in oversold territory. Over the past day it has traded between $181.84 and $204.39, sitting near the bottom of it now. The last 24 hours carried roughly 3.7x normal volume. Down 9.8% over 24 hours.
⚠️ DYOR
$NVDAB #Trading
$NVDAB trades at $183.26, still on the weak side of its daily averages. The $181.84 area held twice over the last two months and is being tested again. Price is down in the lower third of that range. The floor is 0.8% away and the ceiling is nowhere close. The 20 has stayed below the 50 for only 18 candles. RSI at 24 is deep in oversold territory. Over the past day it has traded between $181.84 and $204.39, sitting near the bottom of it now. The last 24 hours carried roughly 3.7x normal volume. Down 9.8% over 24 hours.
⚠️ DYOR
$NVDAB #Trading
9
Connectez-vous pour découvrir plus de contenu
Rejoignez la communauté mondiale des adeptes de cryptomonnaies sur Binance Square
⚡️ Suviez les dernières informations importantes sur les cryptomonnaies.
💬 Jugé digne de confiance par la plus grande plateforme d’échange de cryptomonnaies au monde.
👍 Découvrez les connaissances que partagent les créateurs vérifiés.
Adresse e-mail/Nº de téléphone
Sujets d’actualité
BinanceReopensWithdrawalsForMoreAssets
1M vues
5,307 mentions
Mise à jour sur le rétablissement n° 9 : les retraits pour d’autres actifs vont reprendre (2026-11-06)
Binance Announcement
·84 mentions J’aime
·297.5k vues
AnthropicIPOValuationDoubts
5,334 vues
166 mentions
USStocksSlipandCryptoMarketUnderBroadPressure
80,683 vues
584 mentions