

Odunerd
54 Publications

Odunerd
Signaler
Bloquer l’utilisateur
BP-24948D0AD5FF
94 Suivis
432 Abonnés
1.3K+ J’aime
Publications
Tous
Citations
PINNED
·
--
Haussier
Il arrive souvent qu'on néglige nos convictions et quand ça se joue on crie 😬 oups.
Mis à part TA et FA
il y a quelque chose qui s'appelle l'analyse des sentiments
quels sont vos sentiments à propos d’un récit particulier dans l’espace cryptographique et quel effet vos sentiments vous apportent-ils BON ou MAUVAIS ?
Je veux dire, qu'il soit haussier ou baissier, ce qui compte, c'est votre état d'esprit et pas seulement ce que le graphique ou MM publie.
RESTEZ CONCENTRÉ🤳
Jetons, je conduis mes convictions vers rn
#memes
#L2s
#AI
#exchtokens
Il arrive souvent qu'on néglige nos convictions et quand ça se joue on crie 😬 oups.
Mis à part TA et FA
il y a quelque chose qui s'appelle l'analyse des sentiments
quels sont vos sentiments à propos d’un récit particulier dans l’espace cryptographique et quel effet vos sentiments vous apportent-ils BON ou MAUVAIS ?
Je veux dire, qu'il soit haussier ou baissier, ce qui compte, c'est votre état d'esprit et pas seulement ce que le graphique ou MM publie.
RESTEZ CONCENTRÉ🤳
Jetons, je conduis mes convictions vers rn
#memes
#L2s
#AI
#exchtokens
Mis à part TA et FA
il y a quelque chose qui s'appelle l'analyse des sentiments
quels sont vos sentiments à propos d’un récit particulier dans l’espace cryptographique et quel effet vos sentiments vous apportent-ils BON ou MAUVAIS ?
Je veux dire, qu'il soit haussier ou baissier, ce qui compte, c'est votre état d'esprit et pas seulement ce que le graphique ou MM publie.
RESTEZ CONCENTRÉ🤳
Jetons, je conduis mes convictions vers rn
#memes
#L2s
#AI
#exchtokens

3
8
2.5k
·
--
Un jeton qui survit à peine pour se remettre sur ses pieds, ce n’est pas bon signe pour la famille Ripple en ce moment..
#BitgetHackerMoves$83MStolenXRP
Un jeton qui survit à peine pour se remettre sur ses pieds, ce n’est pas bon signe pour la famille Ripple en ce moment..
#BitgetHackerMoves$83MStolenXRP
#BitgetHackerMoves$83MStolenXRP
351
·
--
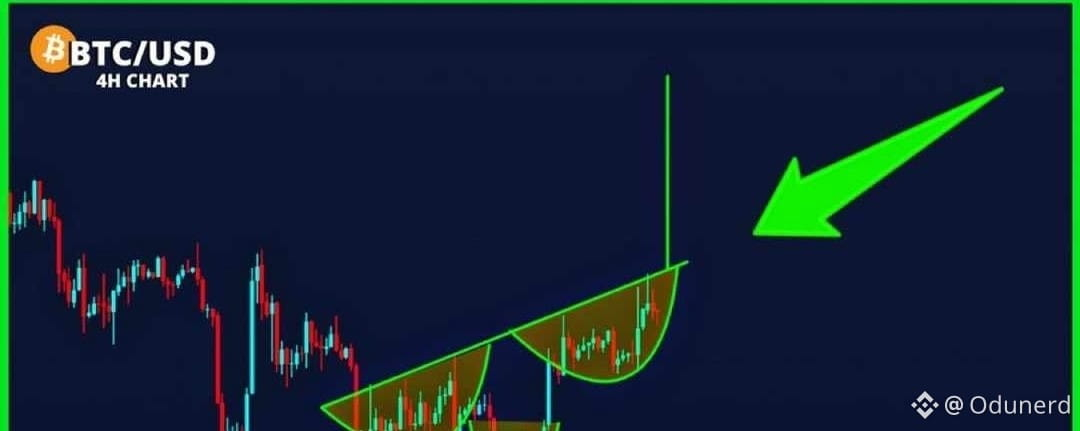
Article
Voir la traduction
BITCOIN INCONSISTENCIES ANALYTICAL PROVEN..Was June 30, 2026 the Bitcoin Cycle Bottom?
One question has been sitting at the center of my Bitcoin analysis:
Did Bitcoin actually find its cycle bottom on June 30, 2026?
Rather than relying on the chart alone, I approached the question from two sides:
Market structure + on-chain and market data.
1. Starting With Price Action
I deliberately kept the technical analysis simple.
No complicated indicators.
Just price structure.
Bitcoin reached a low of approximately $58.53K on June 30.
Since then, the market has behaved differently from the downtrend that led into that low.
On the daily chart, $BTC moved away from the June low and entered a period of consolidation before beginning to form a sequence of higher highs and higher lows.
The weekly chart adds another important piece of context.
The June low has remained intact, while Bitcoin has recovered substantially from that level.
That is certainly worth paying attention to.
But there is an important distinction:
A strong recovery from a low does not, by itself, prove that the cycle bottom is in.
So I went deeper.
2. Looking Beneath the Chart
To test the June low from a data perspective, I built a framework around several metrics and historical comparisons:
- MVRV
- Bitcoin Realized Price
- ETF flows
- Historical cycle bottoms
- Peak-to-bottom drawdowns
- Post-bottom recovery behaviour
The objective wasn't to find one magic indicator.
Instead, I wanted to see whether multiple independent pieces of evidence were pointing toward the same conclusion.
Key numbers from the analysis
$58.53K — June 30 low
-53.11% — Peak-to-bottom drawdown
1.47 — Current MVRV
$53.19K — Realized Price
+30.52% — Recovery from the June low at the time of the analysis
When these figures are placed alongside historical Bitcoin cycle behaviour, the June 30 low starts to look increasingly significant.
3. What Does the Evidence Actually Tell Us?
The analysis suggests that June 30 is a credible candidate for the cycle bottom.
But there is an important caveat:
A candidate bottom is not the same thing as a confirmed cycle bottom.
Bitcoin has historically experienced significant recoveries that were later followed by another major move lower.
That's why I don't think one should look at the June low in isolation.
The more interesting observation is that both price structure and the underlying data are pointing toward a potential change in market behaviour around that period.
Price is showing a different structure.
The on-chain and market data provide additional evidence worth investigating.
But the higher-timeframe cycle still needs to prove itself.
4. Why Combine Technical Analysis With Data Analytics?
This is actually the bigger lesson behind the research.
The chart tells us what price is doing.
But data can help us investigate what may be happening underneath the price.
Instead of asking:
«"Does the chart look bullish?"»
The better analytical question becomes:
"Do multiple independent datasets support the same market hypothesis?"
That shift changes the way I approach crypto research.
Rather than relying on a single indicator or prediction, I want to combine:
Price → On-chain data → Historical behaviour → Market flows → Statistical context
Then let the evidence tell the story.
So, was June 30, 2026 the Bitcoin cycle bottom?
It is a credible candidate — but the data does not make it a confirmed fact yet.
For me, that's where the research becomes interesting.
The goal isn't to predict the market with certainty.
It's to identify important market events, collect the relevant data, test the hypothesis, and continue monitoring whether the evidence holds.
PS: I've put together the full research, dashboard, and methodology for anyone interested in going through the analysis from start to finish.
BITCOIN INCONSISTENCIES ANALYTICAL PROVEN..
Was June 30, 2026 the Bitcoin Cycle Bottom?
One question has been sitting at the center of my Bitcoin analysis:
Did Bitcoin actually find its cycle bottom on June 30, 2026?
Rather than relying on the chart alone, I approached the question from two sides:
Market structure + on-chain and market data.
1. Starting With Price Action
I deliberately kept the technical analysis simple.
No complicated indicators.
Just price structure.
Bitcoin reached a low of approximately $58.53K on June 30.
Since then, the market has behaved differently from the downtrend that led into that low.
On the daily chart, $BTC moved away from the June low and entered a period of consolidation before beginning to form a sequence of higher highs and higher lows.
The weekly chart adds another important piece of context.
The June low has remained intact, while Bitcoin has recovered substantially from that level.
That is certainly worth paying attention to.
But there is an important distinction:
A strong recovery from a low does not, by itself, prove that the cycle bottom is in.
So I went deeper.
2. Looking Beneath the Chart
To test the June low from a data perspective, I built a framework around several metrics and historical comparisons:
- MVRV
- Bitcoin Realized Price
- ETF flows
- Historical cycle bottoms
- Peak-to-bottom drawdowns
- Post-bottom recovery behaviour
The objective wasn't to find one magic indicator.
Instead, I wanted to see whether multiple independent pieces of evidence were pointing toward the same conclusion.
Key numbers from the analysis
$58.53K — June 30 low
-53.11% — Peak-to-bottom drawdown
1.47 — Current MVRV
$53.19K — Realized Price
+30.52% — Recovery from the June low at the time of the analysis
When these figures are placed alongside historical Bitcoin cycle behaviour, the June 30 low starts to look increasingly significant.
3. What Does the Evidence Actually Tell Us?
The analysis suggests that June 30 is a credible candidate for the cycle bottom.
But there is an important caveat:
A candidate bottom is not the same thing as a confirmed cycle bottom.
Bitcoin has historically experienced significant recoveries that were later followed by another major move lower.
That's why I don't think one should look at the June low in isolation.
The more interesting observation is that both price structure and the underlying data are pointing toward a potential change in market behaviour around that period.
Price is showing a different structure.
The on-chain and market data provide additional evidence worth investigating.
But the higher-timeframe cycle still needs to prove itself.
4. Why Combine Technical Analysis With Data Analytics?
This is actually the bigger lesson behind the research.
The chart tells us what price is doing.
But data can help us investigate what may be happening underneath the price.
Instead of asking:
«"Does the chart look bullish?"»
The better analytical question becomes:
"Do multiple independent datasets support the same market hypothesis?"
That shift changes the way I approach crypto research.
Rather than relying on a single indicator or prediction, I want to combine:
Price → On-chain data → Historical behaviour → Market flows → Statistical context
Then let the evidence tell the story.
So, was June 30, 2026 the Bitcoin cycle bottom?
It is a credible candidate — but the data does not make it a confirmed fact yet.
For me, that's where the research becomes interesting.
The goal isn't to predict the market with certainty.
It's to identify important market events, collect the relevant data, test the hypothesis, and continue monitoring whether the evidence holds.
PS: I've put together the full research, dashboard, and methodology for anyone interested in going through the analysis from start to finish.
One question has been sitting at the center of my Bitcoin analysis:
Did Bitcoin actually find its cycle bottom on June 30, 2026?
Rather than relying on the chart alone, I approached the question from two sides:
Market structure + on-chain and market data.
1. Starting With Price Action
I deliberately kept the technical analysis simple.
No complicated indicators.
Just price structure.
Bitcoin reached a low of approximately $58.53K on June 30.
Since then, the market has behaved differently from the downtrend that led into that low.
On the daily chart, $BTC moved away from the June low and entered a period of consolidation before beginning to form a sequence of higher highs and higher lows.
The weekly chart adds another important piece of context.
The June low has remained intact, while Bitcoin has recovered substantially from that level.
That is certainly worth paying attention to.
But there is an important distinction:
A strong recovery from a low does not, by itself, prove that the cycle bottom is in.
So I went deeper.
2. Looking Beneath the Chart
To test the June low from a data perspective, I built a framework around several metrics and historical comparisons:
- MVRV
- Bitcoin Realized Price
- ETF flows
- Historical cycle bottoms
- Peak-to-bottom drawdowns
- Post-bottom recovery behaviour
The objective wasn't to find one magic indicator.
Instead, I wanted to see whether multiple independent pieces of evidence were pointing toward the same conclusion.
Key numbers from the analysis
$58.53K — June 30 low
-53.11% — Peak-to-bottom drawdown
1.47 — Current MVRV
$53.19K — Realized Price
+30.52% — Recovery from the June low at the time of the analysis
When these figures are placed alongside historical Bitcoin cycle behaviour, the June 30 low starts to look increasingly significant.
3. What Does the Evidence Actually Tell Us?
The analysis suggests that June 30 is a credible candidate for the cycle bottom.
But there is an important caveat:
A candidate bottom is not the same thing as a confirmed cycle bottom.
Bitcoin has historically experienced significant recoveries that were later followed by another major move lower.
That's why I don't think one should look at the June low in isolation.
The more interesting observation is that both price structure and the underlying data are pointing toward a potential change in market behaviour around that period.
Price is showing a different structure.
The on-chain and market data provide additional evidence worth investigating.
But the higher-timeframe cycle still needs to prove itself.
4. Why Combine Technical Analysis With Data Analytics?
This is actually the bigger lesson behind the research.
The chart tells us what price is doing.
But data can help us investigate what may be happening underneath the price.
Instead of asking:
«"Does the chart look bullish?"»
The better analytical question becomes:
"Do multiple independent datasets support the same market hypothesis?"
That shift changes the way I approach crypto research.
Rather than relying on a single indicator or prediction, I want to combine:
Price → On-chain data → Historical behaviour → Market flows → Statistical context
Then let the evidence tell the story.
So, was June 30, 2026 the Bitcoin cycle bottom?
It is a credible candidate — but the data does not make it a confirmed fact yet.
For me, that's where the research becomes interesting.
The goal isn't to predict the market with certainty.
It's to identify important market events, collect the relevant data, test the hypothesis, and continue monitoring whether the evidence holds.
PS: I've put together the full research, dashboard, and methodology for anyone interested in going through the analysis from start to finish.
1
62
·
--
Haussier
$ARB
$ZAMA
$SUI
Les altcoins commencent à se réveiller, mais le taux de récupération de certains tokens ne correspond pas encore à leur élan.
$ARB
$ZAMA
$SUI
Les altcoins commencent à se réveiller, mais le taux de récupération de certains tokens ne correspond pas encore à leur élan.
$ZAMA
$SUI
Les altcoins commencent à se réveiller, mais le taux de récupération de certains tokens ne correspond pas encore à leur élan.
1
602
·
--
apportez-moi le mode sombre à tout moment, de toute façon, pour mon propre bien, en effet, les dommages causés par le mode clair nécessitent plus d'attention.
apportez-moi le mode sombre à tout moment, de toute façon, pour mon propre bien, en effet, les dommages causés par le mode clair nécessitent plus d'attention.

Odunerd
·
--
HaussierEn tant que développeur, vous apprenez et codez quel écran préférez-vous lorsque vous êtes à l'écran.
▪︎Écran lumineux
▪︎Écran sombre
parlons.
▪︎Écran lumineux
▪︎Écran sombre
parlons.
1
6
·
--
#StockMarketCrash l'effet de la guerre va certainement se manifester après ce que nous voyons maintenant, c'est un appât ou pour tromper les gens.
#StockMarketCrash l'effet de la guerre va certainement se manifester après ce que nous voyons maintenant, c'est un appât ou pour tromper les gens.
1
53
·
--
Haussier
Le Bitcoin atteignant 73 000 $ n'est pas une base pour se sentir arrivé. Ce qui alimente la montée sur le marché maintenant, c'est la quantité de $BTC en stock et la guerre distrait les mineurs pour ainsi dire.
Le Bitcoin atteignant 73 000 $ n'est pas une base pour se sentir arrivé. Ce qui alimente la montée sur le marché maintenant, c'est la quantité de $BTC en stock et la guerre distrait les mineurs pour ainsi dire.
1
65
·
--
Ils ont estropié tout le monde à la position pour de vrai
Ils ont estropié tout le monde à la position pour de vrai

Tyler Oliveira
·
--
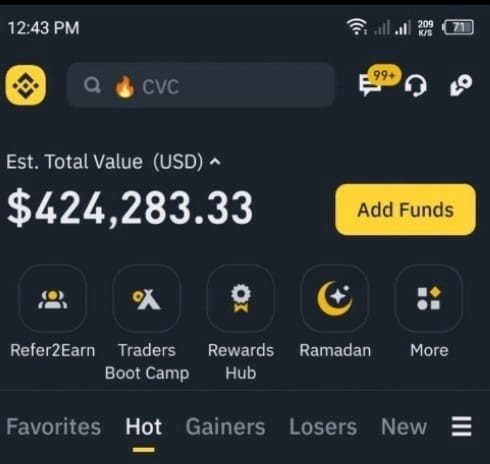
J'avais 1,2 million sur mon compte il y a quelques heures 💔😭
J'ai perdu presque 800K dans $POWER , comment puis-je récupérer ces pertes ??? 😰
J'achète $RIVER 📈✅
J'ai perdu presque 800K dans $POWER , comment puis-je récupérer ces pertes ??? 😰
J'achète $RIVER 📈✅

1
16
·
--
Haussier
également optimiste sur $KAITO ici
également optimiste sur $KAITO ici


CoinQuest
·
--
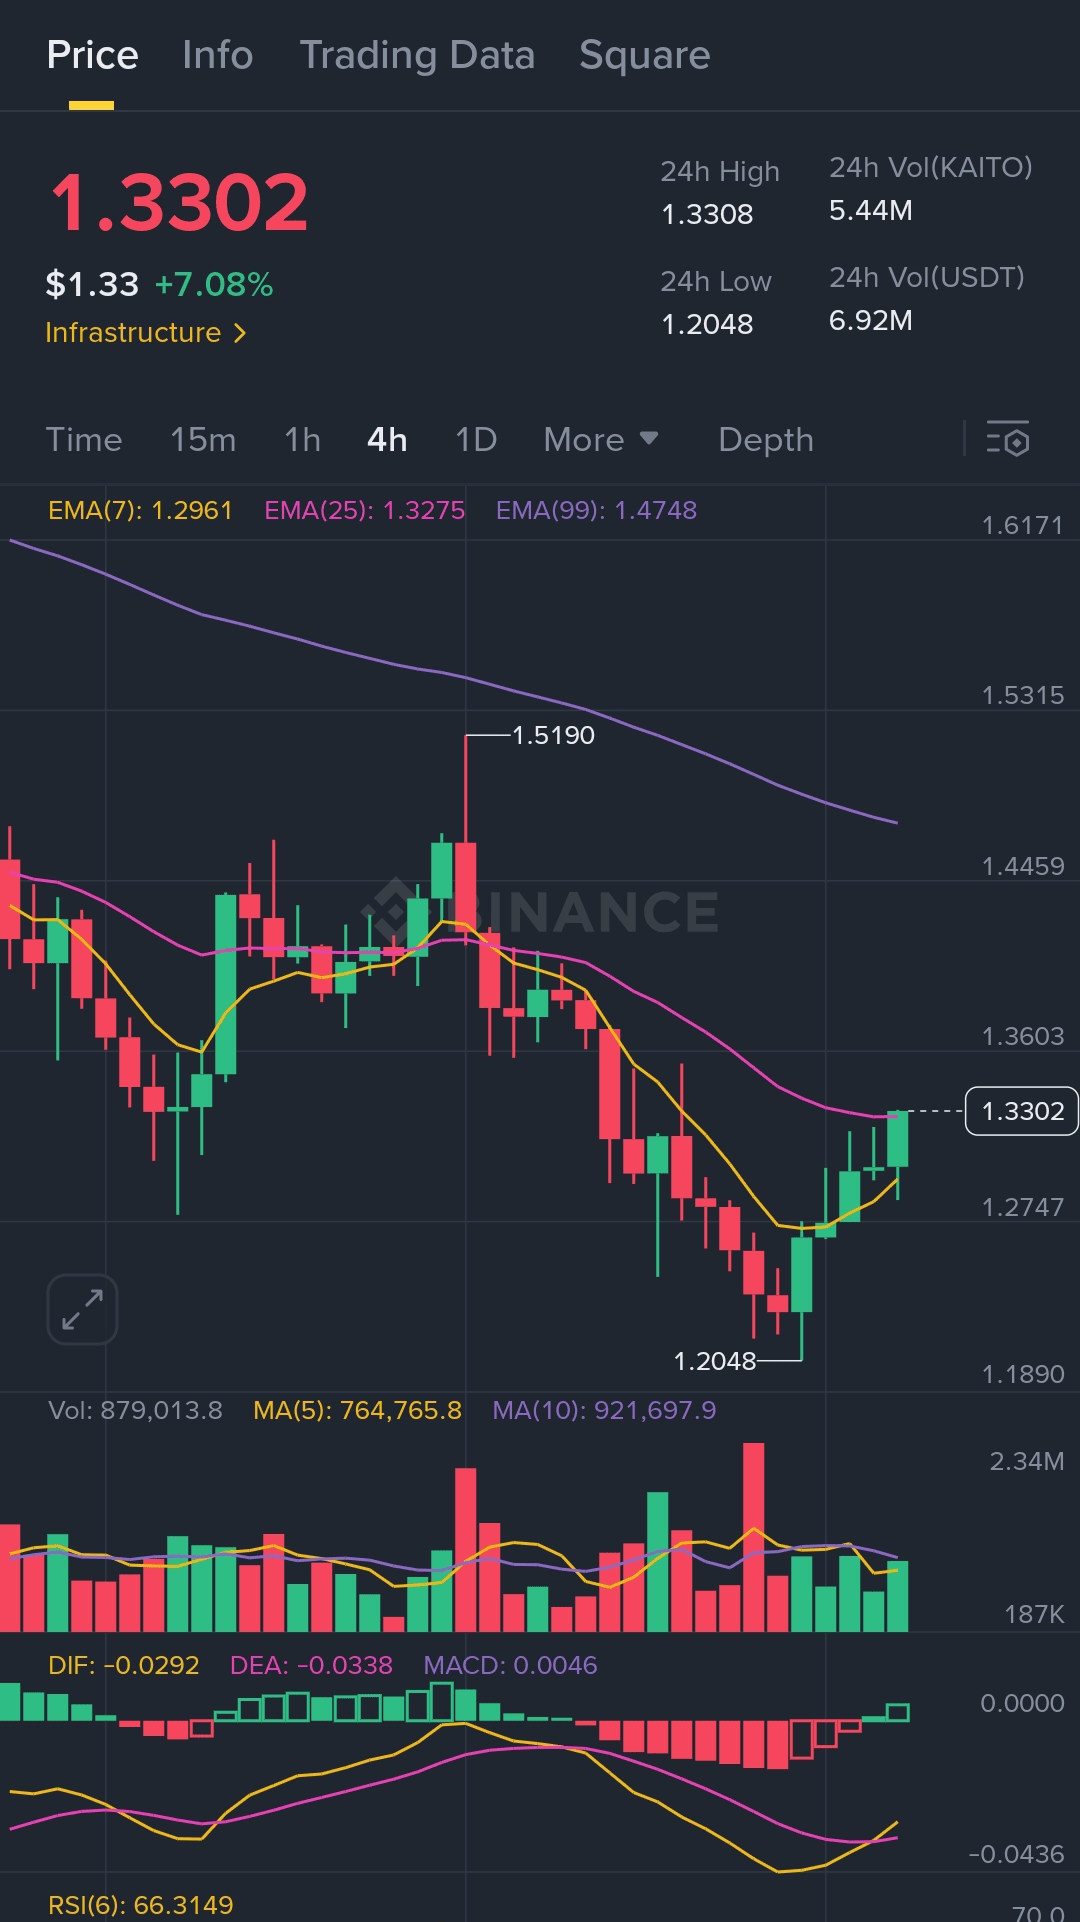
Haussier$KAITO Structure de Rupture en Mouvement ✅
KAITO a franchi la résistance avec confirmation de volume et forme des creux plus élevés clairs, les haussiers reprennent le plein contrôle.
🎯 Entrée : $1.3300
Cibles : $1.3538 | $1.3850 | $1.4200 (optionnel pour l'échelonnement)
🛡️ Stop Loss : $1.2975
Le momentum favorise la continuation. Les traders de rupture devraient surveiller la force au-dessus de $1.33 pour une configuration claire d'extension à la hausse.
KAITO a franchi la résistance avec confirmation de volume et forme des creux plus élevés clairs, les haussiers reprennent le plein contrôle.
🎯 Entrée : $1.3300
Cibles : $1.3538 | $1.3850 | $1.4200 (optionnel pour l'échelonnement)
🛡️ Stop Loss : $1.2975
Le momentum favorise la continuation. Les traders de rupture devraient surveiller la force au-dessus de $1.33 pour une configuration claire d'extension à la hausse.
182
·
--
Haussier
➠Seul le temps compte, mais sur le long terme, veuillez donner la priorité à votre sécurité d'abord, tout le reste n'est qu'une blague.
📢📢
➠Seul le temps compte, mais sur le long terme, veuillez donner la priorité à votre sécurité d'abord, tout le reste n'est qu'une blague.
📢📢
📢📢
16
·
--
Le moment !
Quel est votre niveau de cupidité déjà ?
{spot}(BTCUSDT)
Le moment !
Quel est votre niveau de cupidité déjà ?
Quel est votre niveau de cupidité déjà ?
1
18
·
--
Haussier
Ne laissez rien au hasard.
Mon conseil est de ne jamais arrêter de cliquer.
Ne laissez rien au hasard.
Mon conseil est de ne jamais arrêter de cliquer.
Mon conseil est de ne jamais arrêter de cliquer.

2
6
6.9k
·
--
Haussier
Juste une vraie question pour une vraie réponse.
Sommes-nous proches des saisons Alts ?
Juste une vraie question pour une vraie réponse.
Sommes-nous proches des saisons Alts ?
Sommes-nous proches des saisons Alts ?

11
7
7.1k
·
--
Haussier
La clé principale ici est d'avoir de fortes convictions sur tout ce que vous détenez, puis de prendre votre temps pour vérifier certaines données et statistiques pour étayer votre position.
#Dogs a un arrière-plan narratif très fort, ne paniquez pas trop, il est préférable de le conserver ou de le négocier avec prudence.
en écoutant Pavel Durov, le PDG de Telegram, vous comprenez d'où vient le récit de #Dogs et vous saurez qu'il ne s'agit pas simplement d'un mème ordinaire.
Je RESTE CONCENTRÉ sur X
nous pouvons nous connecter au-delà d'ici.
Aimez et partagez vos pensées.
#bnb 💛
La clé principale ici est d'avoir de fortes convictions sur tout ce que vous détenez, puis de prendre votre temps pour vérifier certaines données et statistiques pour étayer votre position.
#Dogs a un arrière-plan narratif très fort, ne paniquez pas trop, il est préférable de le conserver ou de le négocier avec prudence.
en écoutant Pavel Durov, le PDG de Telegram, vous comprenez d'où vient le récit de #Dogs et vous saurez qu'il ne s'agit pas simplement d'un mème ordinaire.
Je RESTE CONCENTRÉ sur X
nous pouvons nous connecter au-delà d'ici.
Aimez et partagez vos pensées.
#bnb 💛
#Dogs a un arrière-plan narratif très fort, ne paniquez pas trop, il est préférable de le conserver ou de le négocier avec prudence.
en écoutant Pavel Durov, le PDG de Telegram, vous comprenez d'où vient le récit de #Dogs et vous saurez qu'il ne s'agit pas simplement d'un mème ordinaire.
Je RESTE CONCENTRÉ sur X
nous pouvons nous connecter au-delà d'ici.
Aimez et partagez vos pensées.
#bnb 💛
1
706
·
--
Baissier
Le réseau Open (TON) a connu une chute soudaine en raison de l'arrestation du PDG de Telegram.
#PavelDurov
Il est temps d'agir rapidement sur les Memes notables de Ton Blockchain pour les imiter et sécuriser cette opportunité en tant que vote d'achat.
#Fish
#Notcoin
#utyab
#Raff
Tpet
Durev
Tcandy
Tmonk.
Et beaucoup d'autres que vous pouvez consulter sur geckoterminal.com ou utiliser ces dexs pour acheter des jetons cotés.
Ston.fi
DeDust.io
Le réseau Open (TON) a connu une chute soudaine en raison de l'arrestation du PDG de Telegram.
#PavelDurov
Il est temps d'agir rapidement sur les Memes notables de Ton Blockchain pour les imiter et sécuriser cette opportunité en tant que vote d'achat.
#Fish
#Notcoin
#utyab
#Raff
Tpet
Durev
Tcandy
Tmonk.
Et beaucoup d'autres que vous pouvez consulter sur geckoterminal.com ou utiliser ces dexs pour acheter des jetons cotés.
Ston.fi
DeDust.io
#PavelDurov
Il est temps d'agir rapidement sur les Memes notables de Ton Blockchain pour les imiter et sécuriser cette opportunité en tant que vote d'achat.
#Fish
#Notcoin
#utyab
#Raff
Tpet
Durev
Tcandy
Tmonk.
Et beaucoup d'autres que vous pouvez consulter sur geckoterminal.com ou utiliser ces dexs pour acheter des jetons cotés.
Ston.fi
DeDust.io

4
720
·
--
Haussier
Cette partie de l'ÉDUCATION réchauffe toujours mon cœur de Binance au monde.
#BNB 💛
Cette partie de l'ÉDUCATION réchauffe toujours mon cœur de Binance au monde.
#BNB 💛
#BNB 💛


Binance Square Official
·
--
Comment écrire un long article sur Square
202
·
--
Haussier
Ma pensée également pour le monde DEFI d'aujourd'hui est d'adopter davantage de technologie, d'innovations et d'idées qui ne manqueront pas complètement dans l'espace crypto.
Soyez productif
Être relié
Être ouvert d'esprit
Ma pensée également pour le monde DEFI d'aujourd'hui est d'adopter davantage de technologie, d'innovations et d'idées qui ne manqueront pas complètement dans l'espace crypto.
Soyez productif
Être relié
Être ouvert d'esprit
Soyez productif
Être relié
Être ouvert d'esprit
5
269
·
--
#MarketSentimentToday Je dirai que le marché est actuellement dans une position de doji et qu'il faut être extrêmement prudent lorsqu'on prend des décisions.
#MarketSentimentToday Je dirai que le marché est actuellement dans une position de doji et qu'il faut être extrêmement prudent lorsqu'on prend des décisions.
5
3k
·
--
Haussier
En tant que développeur, vous apprenez et codez quel écran préférez-vous lorsque vous êtes à l'écran.
▪︎Écran lumineux
▪︎Écran sombre
parlons.
En tant que développeur, vous apprenez et codez quel écran préférez-vous lorsque vous êtes à l'écran.
▪︎Écran lumineux
▪︎Écran sombre
parlons.
▪︎Écran lumineux
▪︎Écran sombre
parlons.
1
2
5.5k
Connectez-vous pour découvrir plus de contenu
Rejoignez la communauté mondiale des adeptes de cryptomonnaies sur Binance Square
⚡️ Suviez les dernières informations importantes sur les cryptomonnaies.
💬 Jugé digne de confiance par la plus grande plateforme d’échange de cryptomonnaies au monde.
👍 Découvrez les connaissances que partagent les créateurs vérifiés.
Adresse e-mail/Nº de téléphone
Sujets d’actualité
NvidiaApproves$150BBuyback
513 vues
20 mentions
#NvidiaApproves$150BBuyback
Onde de choc de rachat de 150 milliards de dollars de Nvidia : est-ce que les flux de trésorerie liés à l’IA alimentent la prochaine flambée du marché ? 🚀
Le supercycle de l’IA vient d’envoyer des ondes de choc à travers les marchés traditionnels (tradfi) et crypto ! Le conseil d’administration de NVIDIA a autorisé une hausse massive de 150 milliards de dollars de son programme de rachat d’actions, portant l’autorisation totale restante de rachat de la société à 235 milliards de dollars.
Il s’agit de la plus grande autorisation de rachat d’actions de l’histoire des entreprises américaines, dépassant le repère d’Apple à 110 milliards de dollars.
📰 Faits marquants & décryptage du marché
Restitution de capital record : Le fondateur et PDG de NVIDIA, Jensen Huang, a cité « un changement de plateforme, une fois par génération, vers l’IA » ainsi que de solides flux de trésorerie d’entreprise comme principaux moteurs du retour de capital aux actionnaires.
L’inverse des replis du marché : Malgré la pression plus large sur les actions et la hausse des rendements des bons du Trésor américain, les actions de $NVDA ont bondi de plus de 3 % à l’annonce, signalant la confiance des investisseurs institutionnels dans les actifs tech.
Retombées sur l’IA décentralisée : Historiquement, les grands titres bullish sur NVIDIA déclenchent un sentiment positif pour les protocoles d’infrastructure d’IA décentralisée (tels que NEAR, RENDER et FET), car les projets web3 liés à l’IA suivent les valorisations du secteur de l’IA dans son ensemble.
❓ Point à discuter
Nvidia annonce un rachat massif de 150 Md ! Les gains sur les actions technologiques vont-ils déborder vers le Bitcoin et les tokens d’IA ?
$RENDER
📊 Signal de trading crypto associé : RENDER/USDT
Biais de trading : Bullish
Zone d’entrée : 5,20 $ – 5,45 $
Objectif 1 (TP1) : 6,10 $
Objectif 2 (TP2) : 6,85 $
Stop Loss (SL) : 4,85 $
Effet de levier (futures) : 3x – 5x (Isolé)
Justification technique : RENDER réagit souvent fortement au matériel Nvidia et aux développements en matière de capital lié à l’IA. Le prix se consolide près du support clé de la moyenne mobile, avec un volume spot en hausse après la $NVDAB
annonce.
#HackersDrainOver12.4MXRPFromDCENTWallets #CryptoNews #AITokens #TradingSignals
Lily星星
·0 mentions J’aime
·4 vues
OpenAIDelaysGPT6.1OverSafetyIssues
1,924 vues
122 mentions
AMDToAcquireWorldLabsFor$8.2B
321 vues
21 mentions