

Rose Sweet
16.9k Publications

Rose Sweet
Signaler
Bloquer l’utilisateur
I'm crypto blogger sharing real time signal follow the page for more crypto signals and crypto details....
Ouvert au trading
Trade occasionnellement
9.5 mois
43 Suivis
461 Abonnés
2.5K+ J’aime
Publications
Portefeuille
Tous
Vidéos
·
--
Baissier
Voir la traduction
$ENA Price trades at $0.1988, down 9.57% daily, testing immediate support at $0.1920 with deeper defense at $0.1850.
Resistance clusters at $0.2100 (breakdown zone) and $0.2250; breaking above requires sustained volume confirmation.
1h chart shows consolidation in a descending channel, while 4h structure confirms a broader downtrend with lower highs.
#BinancePick #KOSPISinks3.52%ToLowestCloseSinceApril
{future}(ENAUSDT)
$ENA Price trades at $0.1988, down 9.57% daily, testing immediate support at $0.1920 with deeper defense at $0.1850.
Resistance clusters at $0.2100 (breakdown zone) and $0.2250; breaking above requires sustained volume confirmation.
1h chart shows consolidation in a descending channel, while 4h structure confirms a broader downtrend with lower highs.
#BinancePick #KOSPISinks3.52%ToLowestCloseSinceApril
Resistance clusters at $0.2100 (breakdown zone) and $0.2250; breaking above requires sustained volume confirmation.
1h chart shows consolidation in a descending channel, while 4h structure confirms a broader downtrend with lower highs.
#BinancePick #KOSPISinks3.52%ToLowestCloseSinceApril
12
·
--
Haussier
Voir la traduction
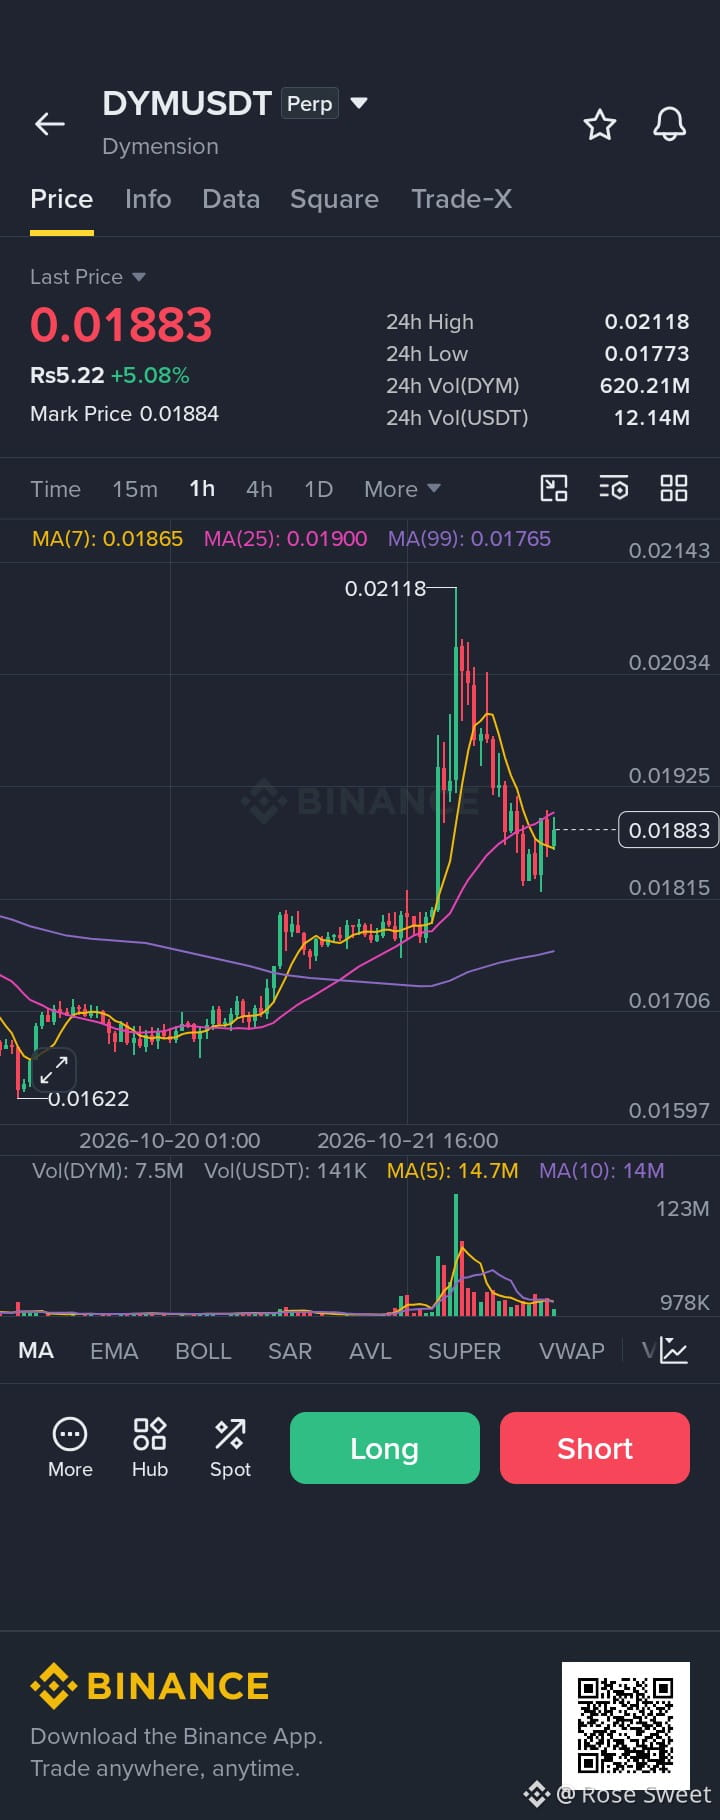
DYM Potential Reversal: Buyers Gaining Traction
Following a bounce off the $0.01835–$0.01850 support region, DYM is currently trading around $0.01896. Short-term bullish momentum is building, and a breakout above immediate resistance could spark further upside.
Buy Zone: $0.01890 – $0.01900
Target 1: $0.01920
Target 2: $0.01950
Target 3: $0.01980
Stop-Loss: $0.01850
$DYM
{future}(DYMUSDT)
$DOT
{future}(DOTUSDT)
$DASH
{future}(DASHUSDT)
#TeslaSlides5%PreMarket #ChinaSeeksToSeize61800BTC
DYM Potential Reversal: Buyers Gaining Traction
Following a bounce off the $0.01835–$0.01850 support region, DYM is currently trading around $0.01896. Short-term bullish momentum is building, and a breakout above immediate resistance could spark further upside.
Buy Zone: $0.01890 – $0.01900
Target 1: $0.01920
Target 2: $0.01950
Target 3: $0.01980
Stop-Loss: $0.01850
$DYM
$DOT
$DASH
#TeslaSlides5%PreMarket #ChinaSeeksToSeize61800BTC
12

·
--
Baissier
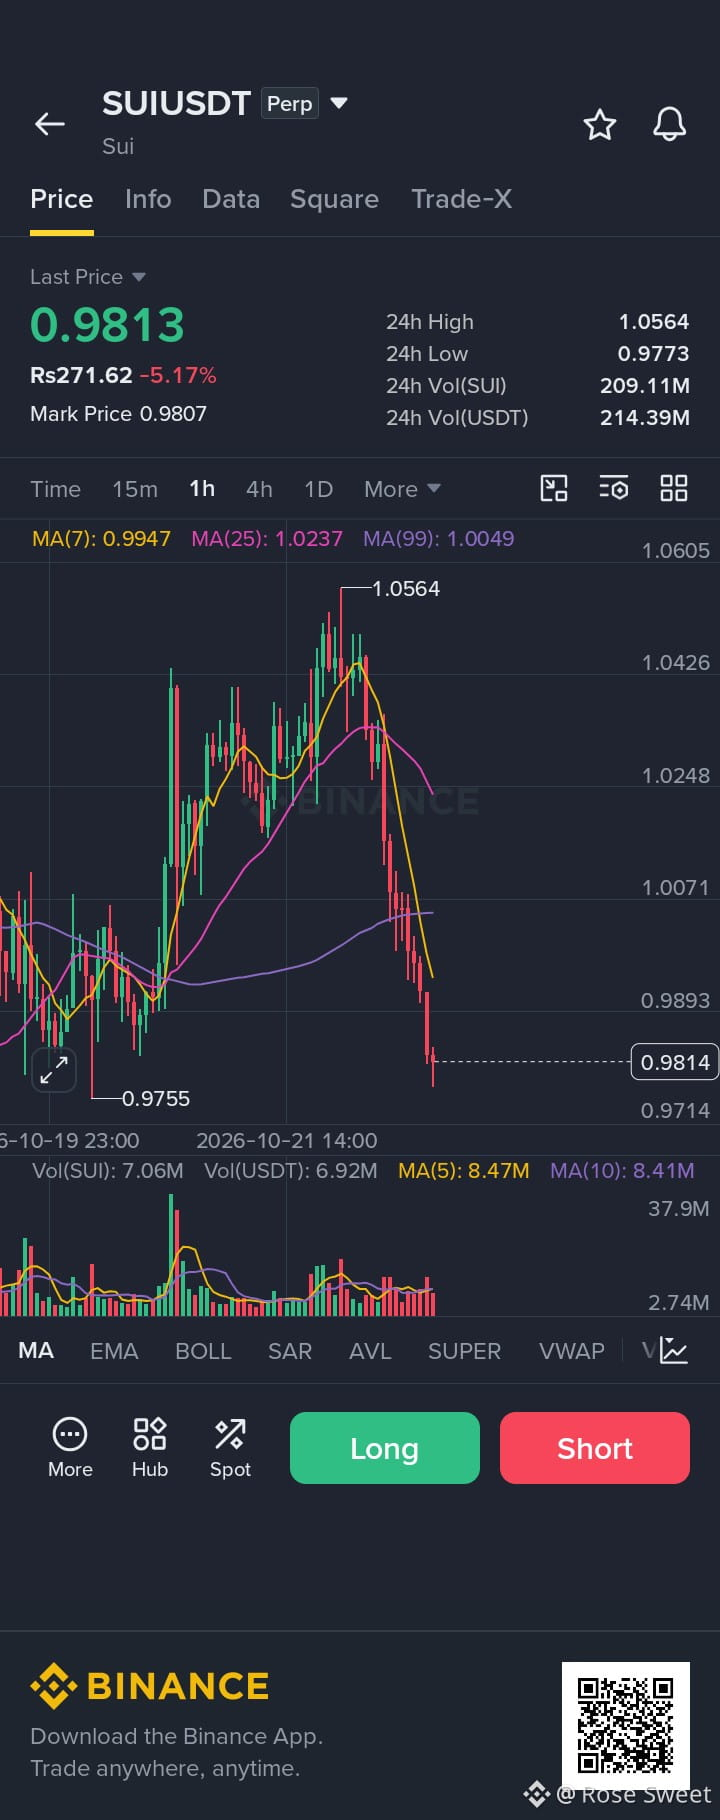
SUI / USDT — Configuration LONG
SUI se replie vers une zone de support majeure autour de $0.9770–$0.9800. Un rebond solide à partir de ce niveau pourrait amorcer un beau retournement vers $1.0090 et $1.0360.
Plan de trading :
Zone d’entrée : $0.9770 – $0.9820
Stop-loss (SL) : $0.9570
Objectifs (TP) : $0.9900 | $1.0000 | $1.0090 | $1.0250
$SUI
{future}(SUIUSDT)
$SOL
{future}(SOLUSDT)
#SUİ #solana
SUI / USDT — Configuration LONG
SUI se replie vers une zone de support majeure autour de $0.9770–$0.9800. Un rebond solide à partir de ce niveau pourrait amorcer un beau retournement vers $1.0090 et $1.0360.
Plan de trading :
Zone d’entrée : $0.9770 – $0.9820
Stop-loss (SL) : $0.9570
Objectifs (TP) : $0.9900 | $1.0000 | $1.0090 | $1.0250
$SUI
$SOL
#SUİ #solana
22
·
--
Baissier
Voir la traduction
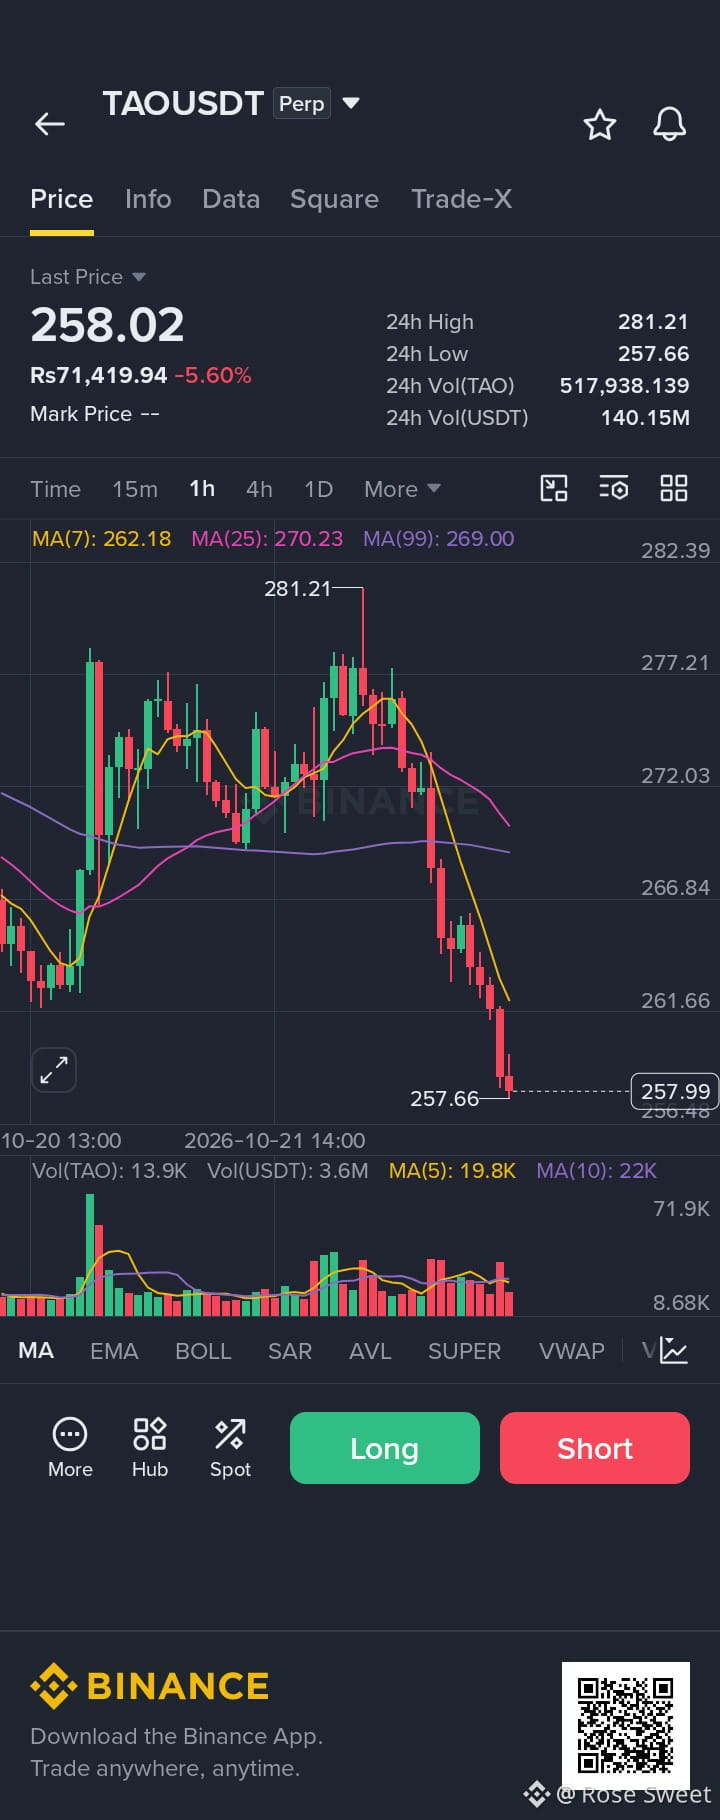
TAO Long Setup
TAO is currently closing in on key support between $254 and $258. If buyers hold this level, we could see a bounce back toward $264–$276. Keep in mind that bearish momentum is still present, so manage your risk closely.
Trade Details:
Direction: Long
Entry Zone: $258 – $260
Stop Loss (SL): $250
Targets:
TP1: $264
TP2: $268
TP3: $272
TP4: $276
📲 Trade $TAO here: 👇
$TAO
{future}(TAOUSDT)
#TAO $TRX
{future}(TRXUSDT)
TAO Long Setup
TAO is currently closing in on key support between $254 and $258. If buyers hold this level, we could see a bounce back toward $264–$276. Keep in mind that bearish momentum is still present, so manage your risk closely.
Trade Details:
Direction: Long
Entry Zone: $258 – $260
Stop Loss (SL): $250
Targets:
TP1: $264
TP2: $268
TP3: $272
TP4: $276
📲 Trade $TAO here: 👇
$TAO
#TAO $TRX
13
·
--
Haussier
Voir la traduction
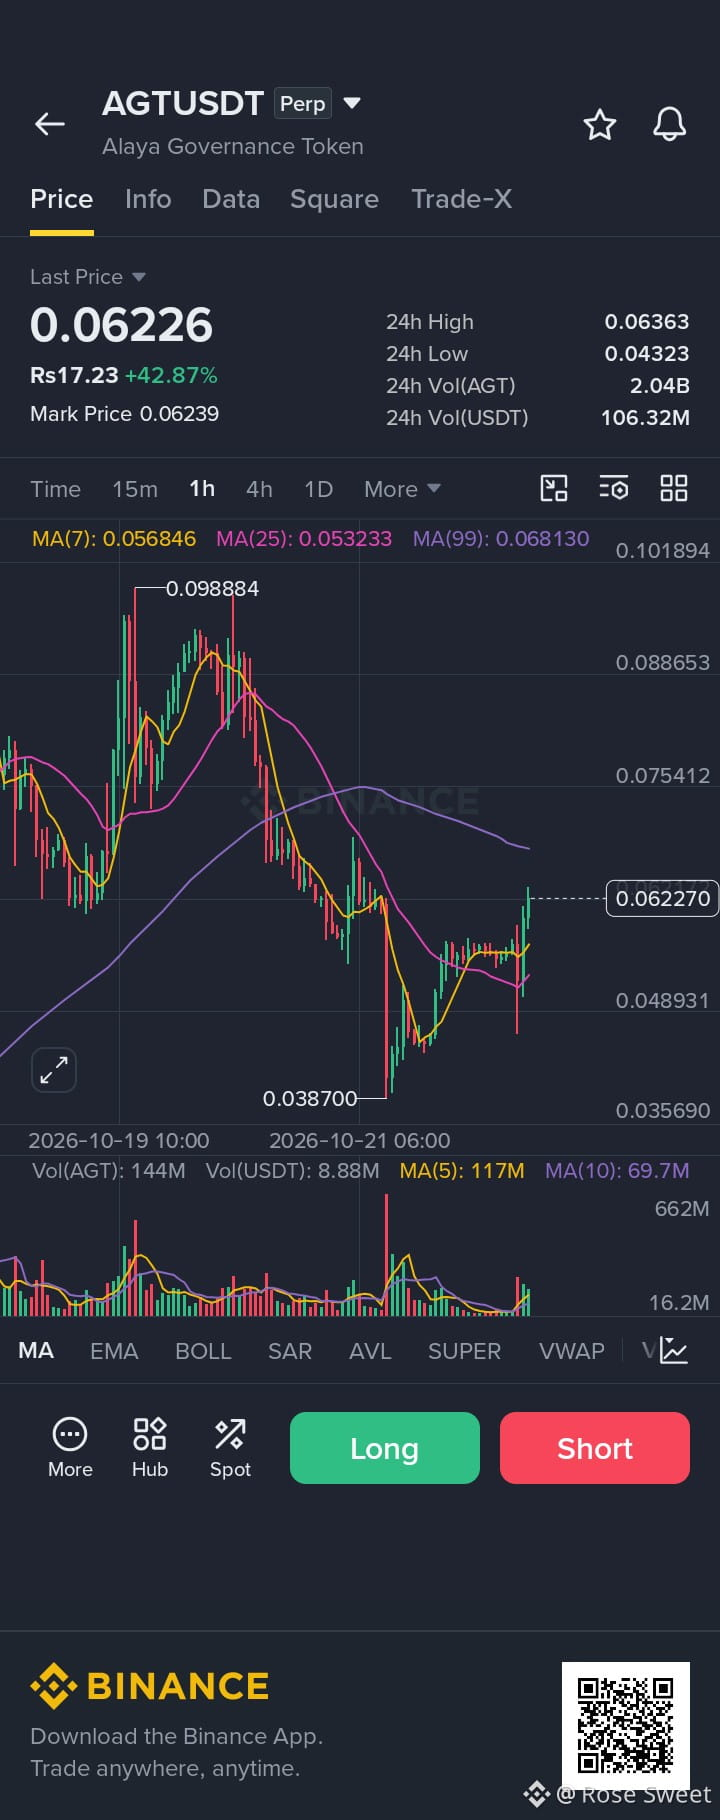
$AGT is breaking past the 25-day EMA. Once $0.065 falls, expect a strong continuation move."
$AGT
{future}(AGTUSDT)
$ADA
{future}(ADAUSDT)
#EarningsSeason #KoreanRetailLost6.3TrillionWonOnLeveragedETPs
$AGT is breaking past the 25-day EMA. Once $0.065 falls, expect a strong continuation move."
$AGT
$ADA
#EarningsSeason #KoreanRetailLost6.3TrillionWonOnLeveragedETPs
$AGT
$ADA
#EarningsSeason #KoreanRetailLost6.3TrillionWonOnLeveragedETPs
11
·
--
Haussier
Voir la traduction
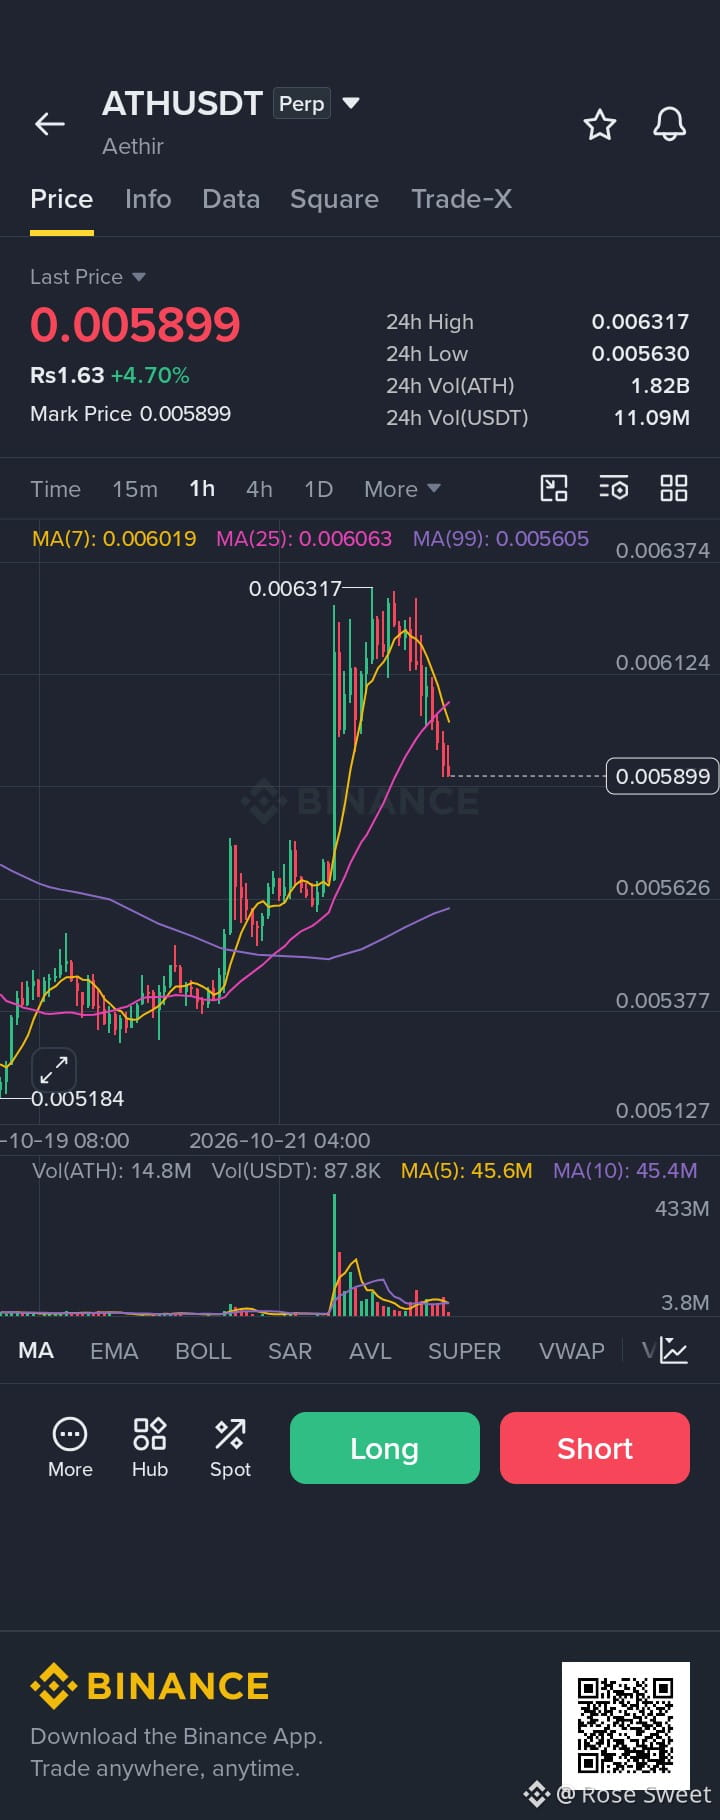
$ATH The chart shows a strong upward surge from a low of 0.005184 up to a peak of 0.006317.
Following the peak, the price has experienced a pullback and is currently consolidating around the 0.005899 mark.
.There was a massive spike in volume accompanying the breakout/rally phase, which has since tapered off as the price retraced from its daily high.
#EarningsSeason
{future}(ATHUSDT)
$ATH The chart shows a strong upward surge from a low of 0.005184 up to a peak of 0.006317.
Following the peak, the price has experienced a pullback and is currently consolidating around the 0.005899 mark.
.There was a massive spike in volume accompanying the breakout/rally phase, which has since tapered off as the price retraced from its daily high.
#EarningsSeason
Following the peak, the price has experienced a pullback and is currently consolidating around the 0.005899 mark.
.There was a massive spike in volume accompanying the breakout/rally phase, which has since tapered off as the price retraced from its daily high.
#EarningsSeason
40
·
--
Haussier
Voir la traduction
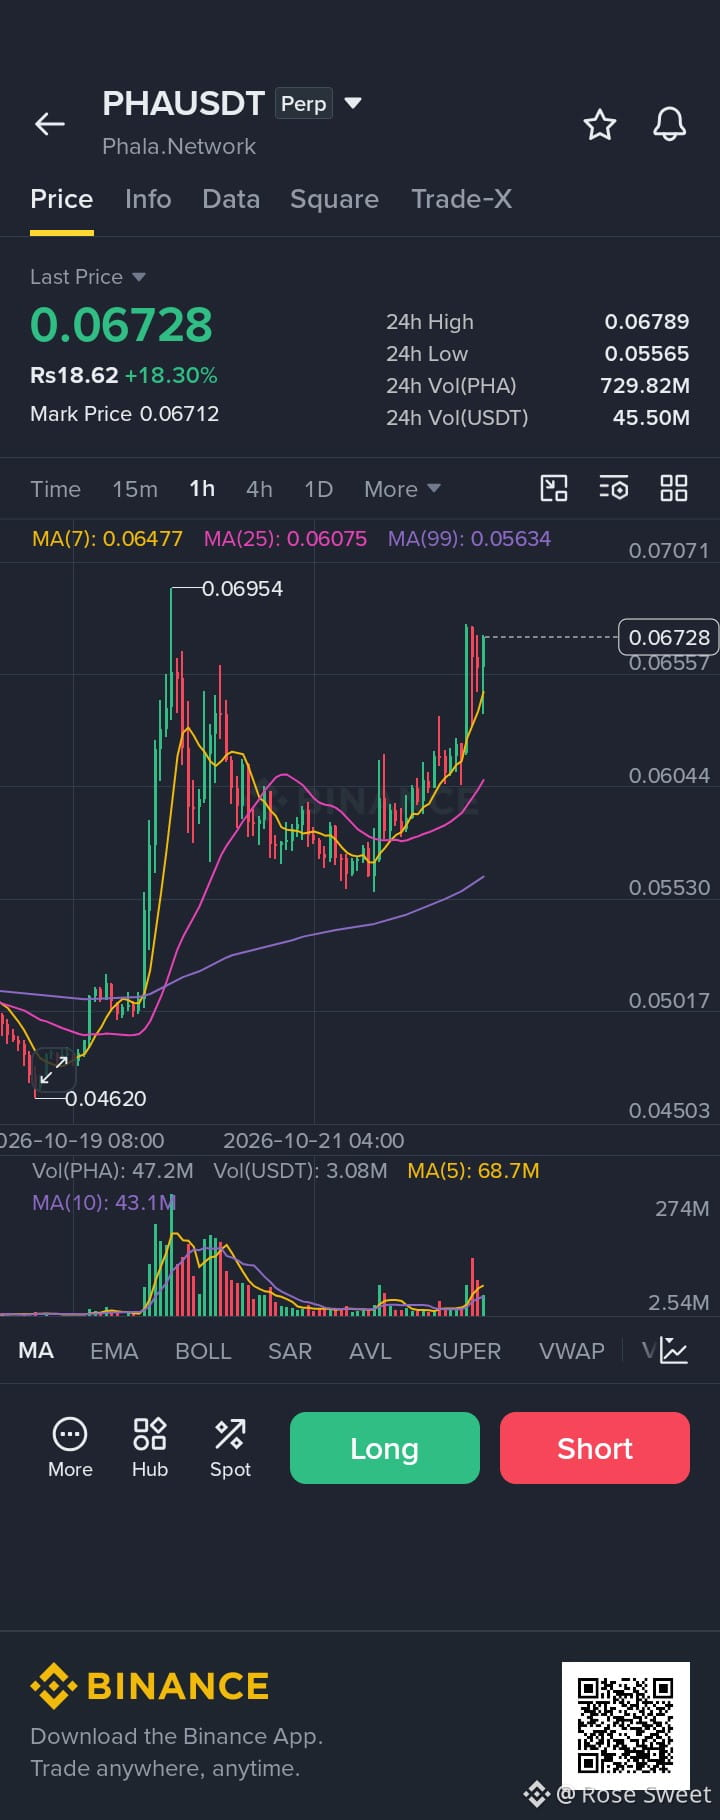
$PHA Bullish Momentum Ahead
PHA is pushing back up toward the $0.0655 resistance level. A successful breakout above this point could drive the price toward $0.0695, provided buying pressure holds strong.
Long Setup: $PHA
Entry Range: $0.0640 – $0.0648
Stop Loss: $0.0600
Target 1: $0.0660
Target 2: $0.0675
Target 3: $0.0695
Target 4: $0.0720
🔗 Trade $PHA here: 👇
#ZcashDevelopersConfirmNovemberDateForNU7Upgrade
{future}(PHAUSDT)
$PHA Bullish Momentum Ahead
PHA is pushing back up toward the $0.0655 resistance level. A successful breakout above this point could drive the price toward $0.0695, provided buying pressure holds strong.
Long Setup: $PHA
Entry Range: $0.0640 – $0.0648
Stop Loss: $0.0600
Target 1: $0.0660
Target 2: $0.0675
Target 3: $0.0695
Target 4: $0.0720
🔗 Trade $PHA here: 👇
#ZcashDevelopersConfirmNovemberDateForNU7Upgrade
33
·
--
Baissier
Voir la traduction
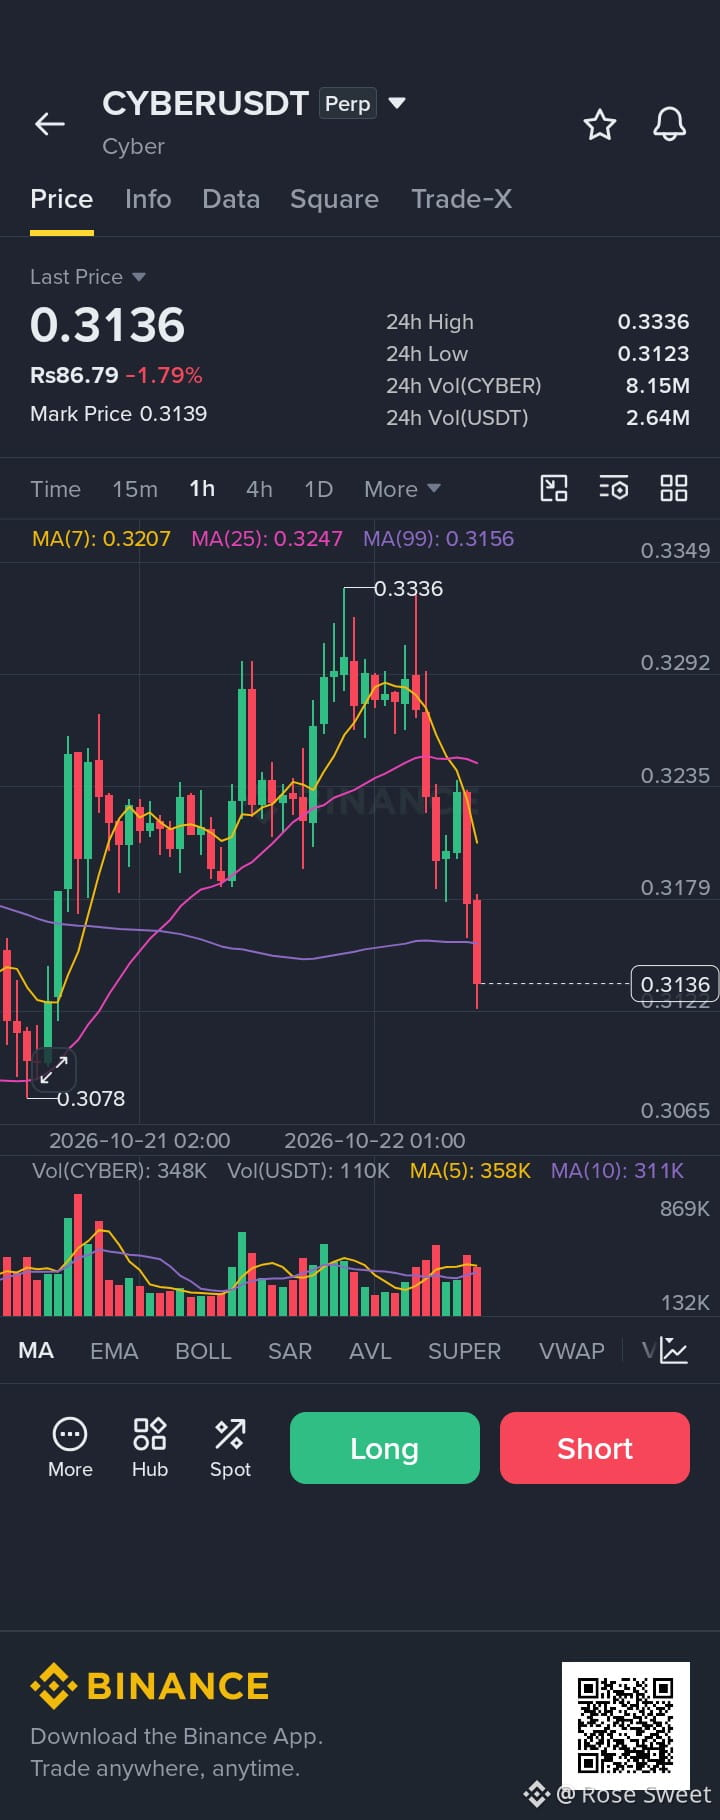
$CYBER Shorts Gaining Traction... Downward Pressure Mounting
Price is hovering near $0.314 following a clear rejection at the $0.330 resistance zone. With selling volume picking up, a clean break below $0.314 is likely to open the door to deeper downside targets.
Entry Range: $0.314 – $0.318
Target 1: $0.310
Target 2: $0.305
Target 3: $0.300
Stop Loss: $0.321
Bias: Short / Sell Target
$CYBER
{future}(CYBERUSDT)
#EarningsSeason
$CYBER Shorts Gaining Traction... Downward Pressure Mounting
Price is hovering near $0.314 following a clear rejection at the $0.330 resistance zone. With selling volume picking up, a clean break below $0.314 is likely to open the door to deeper downside targets.
Entry Range: $0.314 – $0.318
Target 1: $0.310
Target 2: $0.305
Target 3: $0.300
Stop Loss: $0.321
Bias: Short / Sell Target
$CYBER
#EarningsSeason
53
·
--
Haussier
Voir la traduction
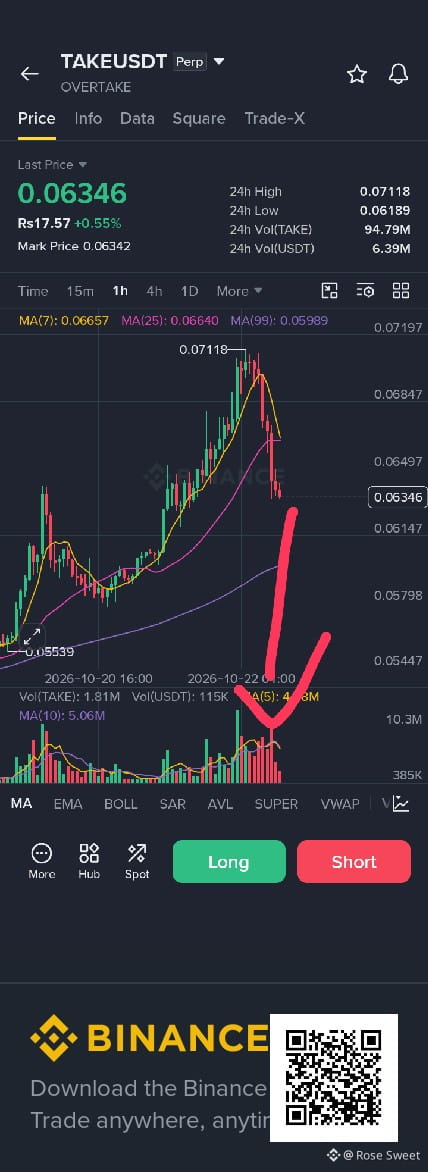
$TAKE :
Current Price & Performance: The last traded price is 0.06346 (up +0.55% over the last 24 hours), with a 24-hour high of 0.07118 and a low of 0.06189.
Price Trend (1-Hour Timeframe): The asset recently experienced a strong rally peaking at the 0.07118 resistance level, followed by a sharp pullback/correction.
Moving Averages (MA):
Short-term MAs like MA(7) at 0.06657 and MA(25) at 0.06640 are trending downward and are currently above the price, indicating short-term bearish pressure.
The longer-term MA(99) sits lower at 0.05989.
.
Volume Activity: The red arrow points to a cluster of red volume bars at the bottom, highlighting an increase in selling volume during the recent price decline.
$TAKE
{future}(TAKEUSDT)
#KoreanRetailLost6.3TrillionWonOnLeveragedETPs
$TAKE :
Current Price & Performance: The last traded price is 0.06346 (up +0.55% over the last 24 hours), with a 24-hour high of 0.07118 and a low of 0.06189.
Price Trend (1-Hour Timeframe): The asset recently experienced a strong rally peaking at the 0.07118 resistance level, followed by a sharp pullback/correction.
Moving Averages (MA):
Short-term MAs like MA(7) at 0.06657 and MA(25) at 0.06640 are trending downward and are currently above the price, indicating short-term bearish pressure.
The longer-term MA(99) sits lower at 0.05989.
.
Volume Activity: The red arrow points to a cluster of red volume bars at the bottom, highlighting an increase in selling volume during the recent price decline.
$TAKE
#KoreanRetailLost6.3TrillionWonOnLeveragedETPs
64
·
--
Baissier
Voir la traduction
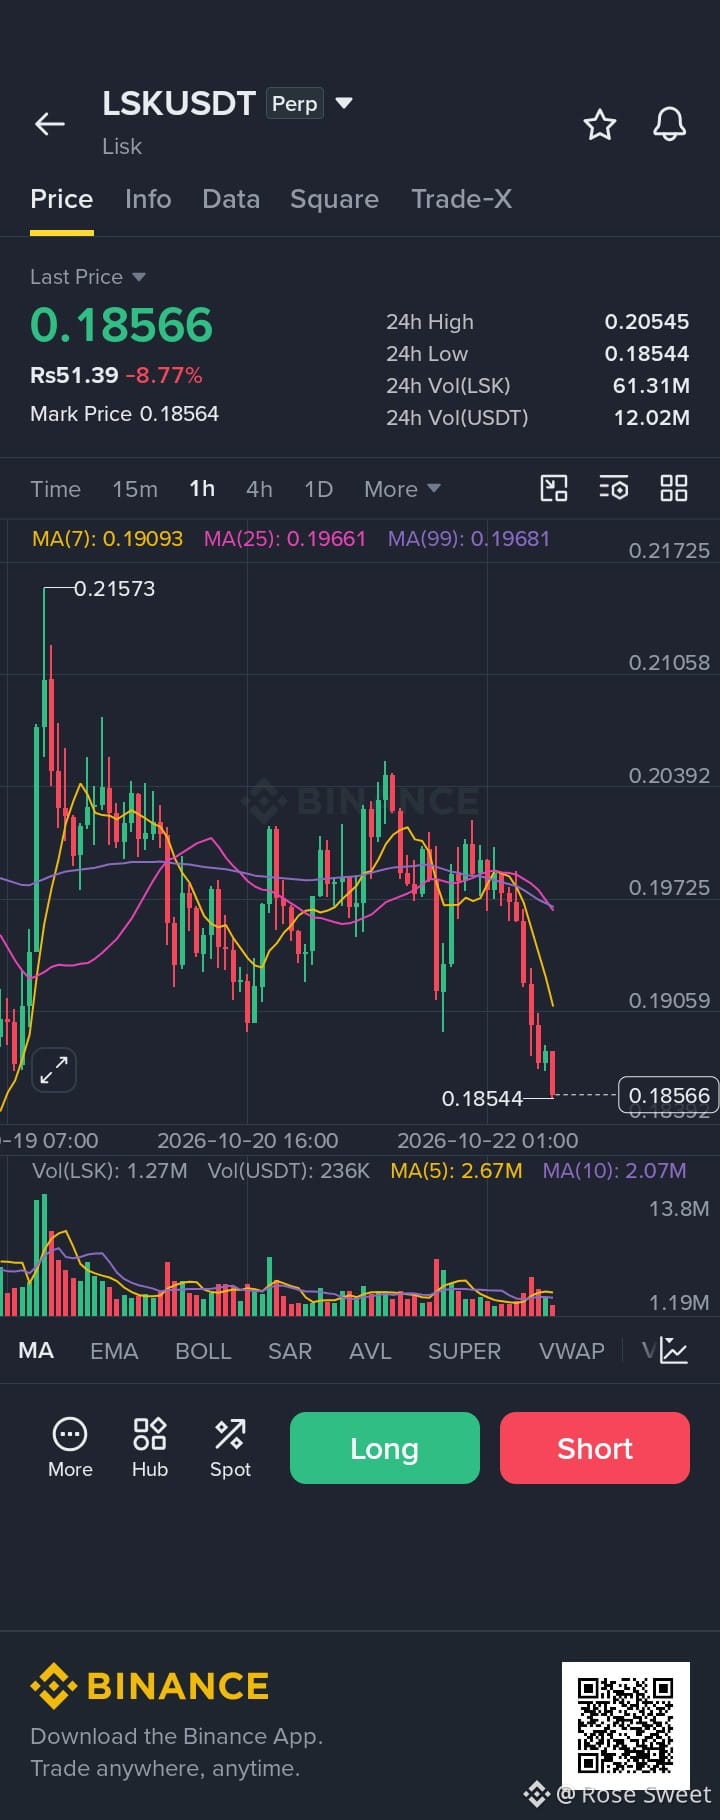
looking at the 1-hour chart for LSKUSDT, price action has rolled over aggressively from the $0.21573 high, breaking down below the key moving averages with increasing momentum.
Trend & Momentum: The 1-hour candles are showing a sharp impulsive drop down to a low of $0.18544, currently hovering around $0.18566 (-8.77%). The MA(7) has crossed sharply below the longer-term MAs, confirming short-term bearish control.
Support & Resistance: Immediate support is being tested right at that $0.18544 low zone. If this gives way, we could see a deeper liquidity sweep. On the flip side, any recovery rally will face heavy overhead resistance around the previous consolidation shelf and moving average convergence near $0.192–$0.196.
$LSK
{future}(LSKUSDT)
$LINK
{future}(LINKUSDT)
#ZcashDevelopersConfirmNovemberDateForNU7Upgrade
looking at the 1-hour chart for LSKUSDT, price action has rolled over aggressively from the $0.21573 high, breaking down below the key moving averages with increasing momentum.
Trend & Momentum: The 1-hour candles are showing a sharp impulsive drop down to a low of $0.18544, currently hovering around $0.18566 (-8.77%). The MA(7) has crossed sharply below the longer-term MAs, confirming short-term bearish control.
Support & Resistance: Immediate support is being tested right at that $0.18544 low zone. If this gives way, we could see a deeper liquidity sweep. On the flip side, any recovery rally will face heavy overhead resistance around the previous consolidation shelf and moving average convergence near $0.192–$0.196.
$LSK
$LINK
#ZcashDevelopersConfirmNovemberDateForNU7Upgrade
85
·
--
Haussier
Voir la traduction
Found my new obsession. A watch that sparkles almost as much as my weekend plans.
$SOL
{future}(SOLUSDT)
$DOT
{future}(DOTUSDT)
$DOGE
{future}(DOGEUSDT)
#EarningsSeason #NEAROpensVoteToCutAnnualIssuanceTo1.6% #EliceReboundsToDailyLimit
Found my new obsession. A watch that sparkles almost as much as my weekend plans.
$SOL
$DOT
$DOGE
#EarningsSeason #NEAROpensVoteToCutAnnualIssuanceTo1.6% #EliceReboundsToDailyLimit
$SOL
$DOT
$DOGE
#EarningsSeason #NEAROpensVoteToCutAnnualIssuanceTo1.6% #EliceReboundsToDailyLimit

1
52
·
--
Haussier
Voir la traduction
$ZEC Bearish Reversal Alert! 📉
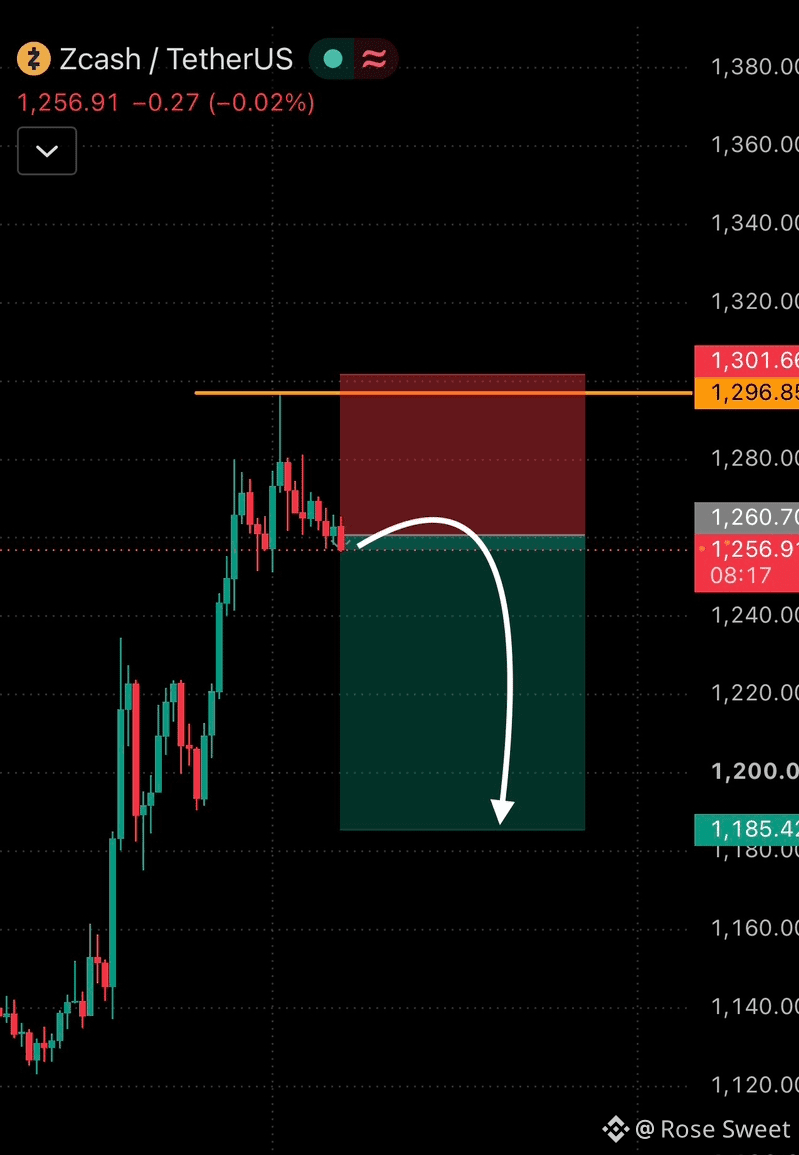
Following a massive rally, $ZEC is showing signs of potential exhaustion. I'm targeting a sharp pullback toward $1,185 and opening a heavy short position to capture the impending sell-off.
Momentum is fading around $1,257 after buyers failed to hold higher levels. A breakdown here could trigger an accelerated drop toward $1,200.
Entry: $1,256 – $1,261
Targets: $1,235 / $1,210 / $1,185
Stop-Loss: $1,301.66
Note: This is a high-risk countertrend setup, so strictly adhering to the stop-loss is essential. A push above $1,296.85 invalidates the bearish bias.
$ZEC
{future}(ZECUSDT)
#ZECUSDT
$ZEC Bearish Reversal Alert! 📉
Following a massive rally, $ZEC is showing signs of potential exhaustion. I'm targeting a sharp pullback toward $1,185 and opening a heavy short position to capture the impending sell-off.
Momentum is fading around $1,257 after buyers failed to hold higher levels. A breakdown here could trigger an accelerated drop toward $1,200.
Entry: $1,256 – $1,261
Targets: $1,235 / $1,210 / $1,185
Stop-Loss: $1,301.66
Note: This is a high-risk countertrend setup, so strictly adhering to the stop-loss is essential. A push above $1,296.85 invalidates the bearish bias.
$ZEC
#ZECUSDT
1
54
·
--
Haussier
Voir la traduction
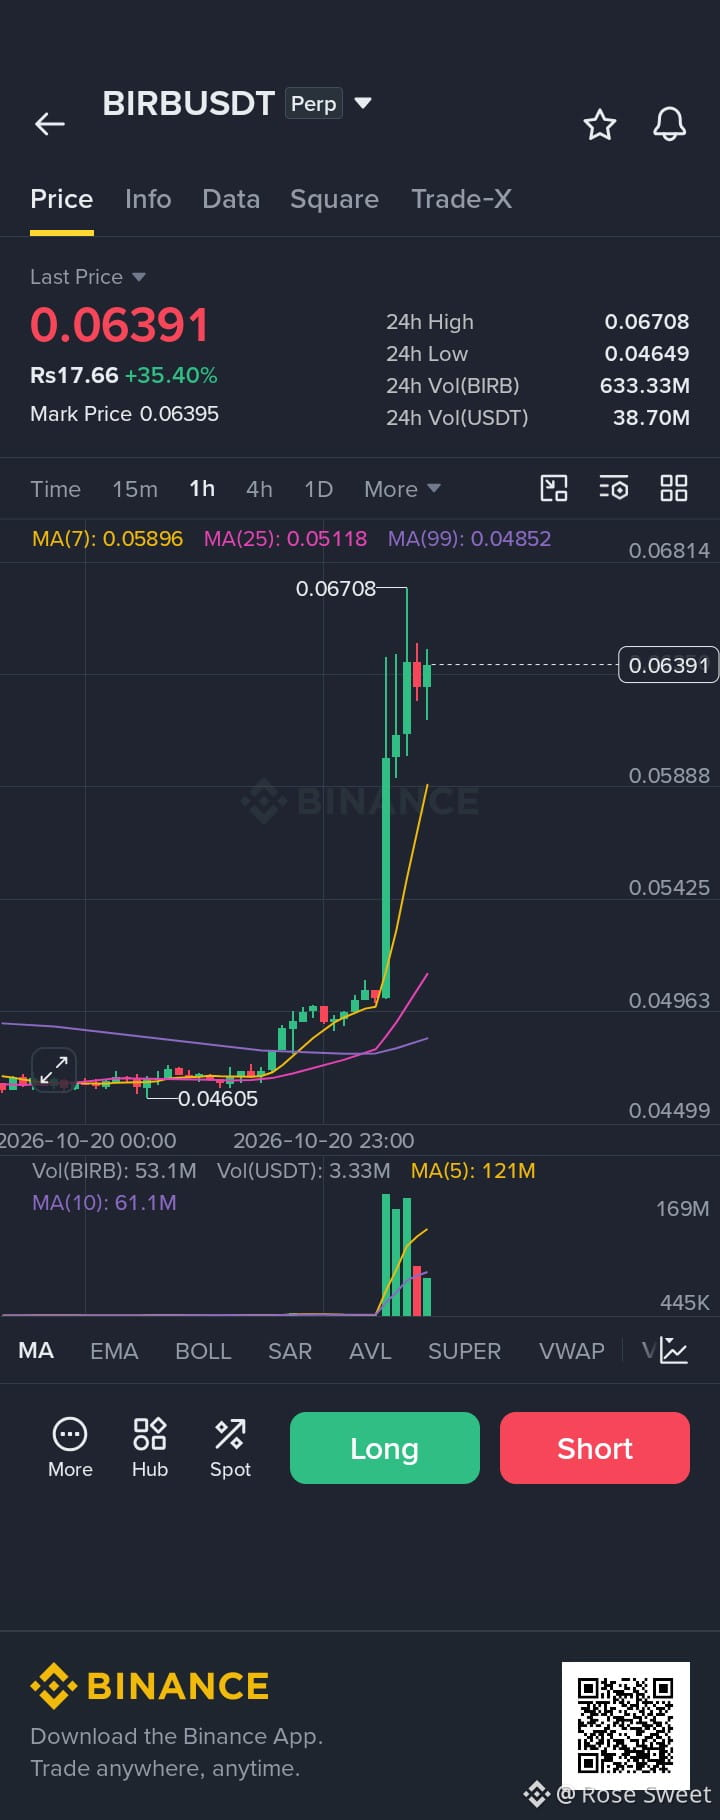
$BIRB 24-Hour Range: The price reached a 24-hour high of 0.06708 and a low of 0.04649.
Trading Volume: Strong market activity, with a 24-hour volume of 633.33M BIRB (or 38.70M USDT).
Trend Analysis: The 1-hour candle chart shows a sharp bullish breakout/spike following a period of consolidation around the 0.04605 mark.
Moving Averages (MA): Short-term moving averages (MA(7): 0.05896, MA(25): 0.05118, and MA(99): 0.04852) are aligned in a bullish stack below the current price, confirming strong upward momentum.
{future}(BIRBUSDT)
#BIRB
$BIRB 24-Hour Range: The price reached a 24-hour high of 0.06708 and a low of 0.04649.
Trading Volume: Strong market activity, with a 24-hour volume of 633.33M BIRB (or 38.70M USDT).
Trend Analysis: The 1-hour candle chart shows a sharp bullish breakout/spike following a period of consolidation around the 0.04605 mark.
Moving Averages (MA): Short-term moving averages (MA(7): 0.05896, MA(25): 0.05118, and MA(99): 0.04852) are aligned in a bullish stack below the current price, confirming strong upward momentum.
#BIRB
1
72
·
--
Haussier
Voir la traduction
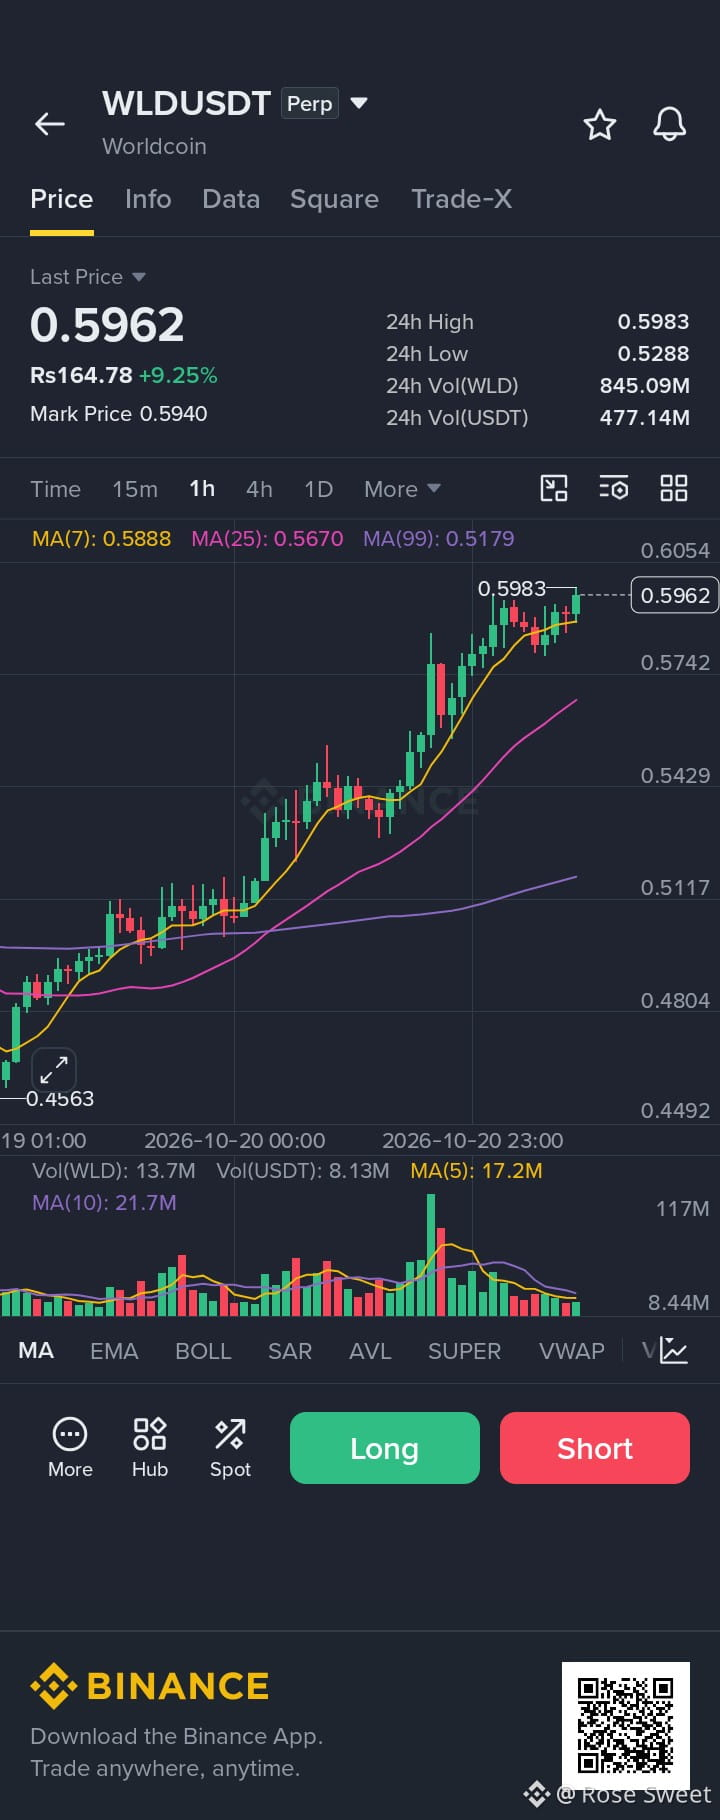
$WLD is approaching a critical resistance level at $0.60. A break above this level is essential for sustained upside momentum, and a bullish breakout looks imminent. Entering a long position here remains favorable ahead of a potential 20%–30% surge.
Long Trade Setup:
Entry Zone: $0.58 – $0.60
Targets (TP): $0.70 | $0.80 | $0.90 | $1.00
Stop Loss (SL): $0.535
$WLD
{future}(WLDUSDT)
#WLD
$WLD is approaching a critical resistance level at $0.60. A break above this level is essential for sustained upside momentum, and a bullish breakout looks imminent. Entering a long position here remains favorable ahead of a potential 20%–30% surge.
Long Trade Setup:
Entry Zone: $0.58 – $0.60
Targets (TP): $0.70 | $0.80 | $0.90 | $1.00
Stop Loss (SL): $0.535
$WLD
#WLD
Long Trade Setup:
Entry Zone: $0.58 – $0.60
Targets (TP): $0.70 | $0.80 | $0.90 | $1.00
Stop Loss (SL): $0.535
$WLD
#WLD
1
85
·
--
Haussier
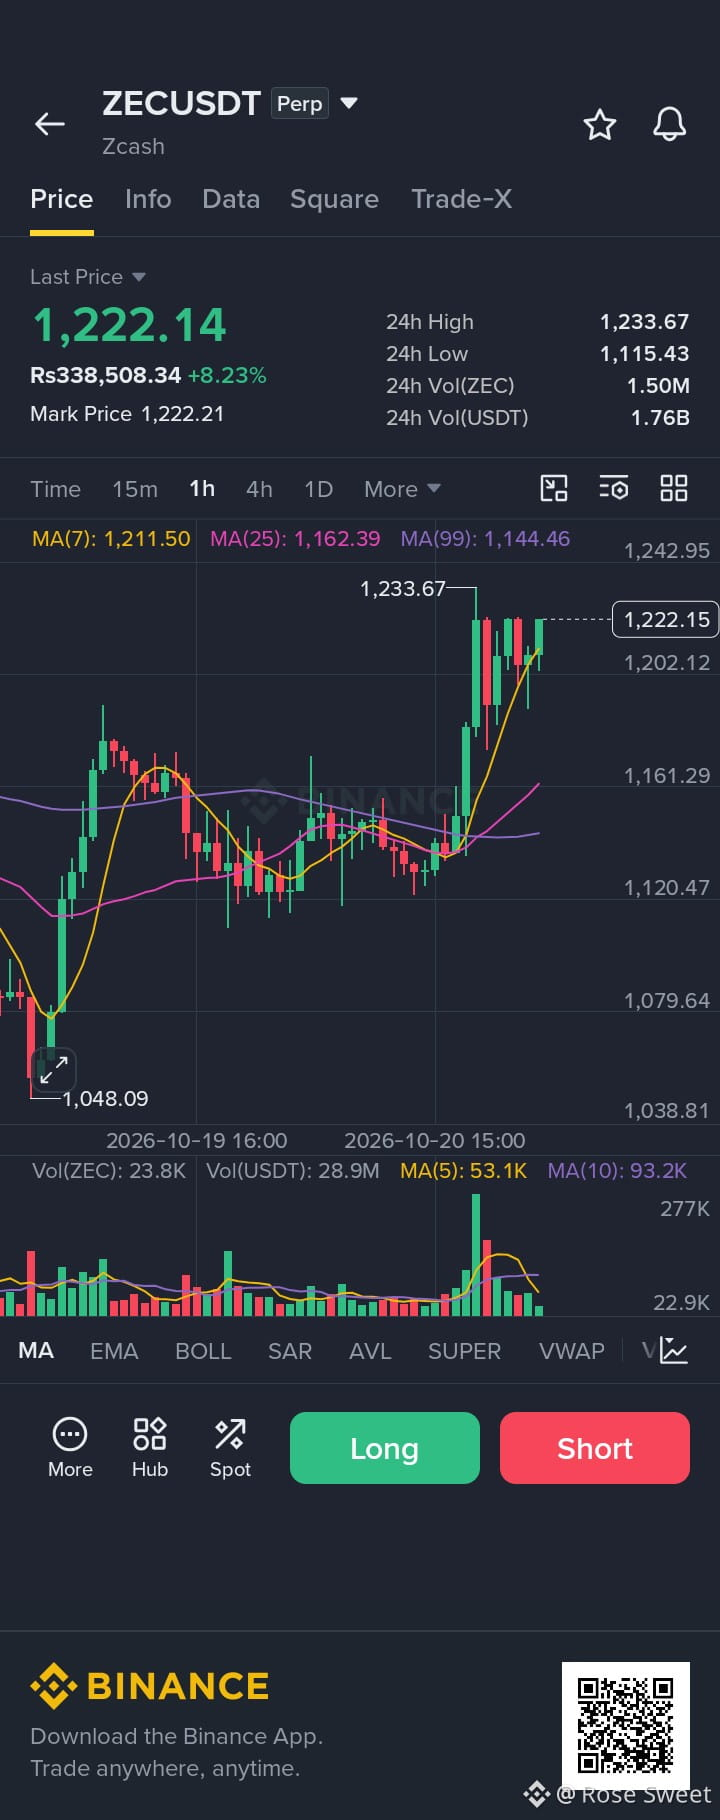
Avis aux traders au comptant. Nous observons actuellement une phase d’accumulation à forte probabilité sur le graphique en 4 heures de ZEC.
Après une correction importante depuis la résistance à 1 600 $ jusqu’au niveau de support à 1 000 $, l’actif a établi une base solide. Il a depuis fortement rebondi et s’échange actuellement autour de 1 219 $, en hausse de 8 % sur la journée, soutenu par un volume de trading conséquent dépassant 1,70 milliard d’USDT. Cette évolution des prix suggère un épuisement des vendeurs et un intérêt institutionnel autour de ces niveaux inférieurs.
Pour les investisseurs au comptant, une stratégie d’investissement périodique (DCA) par tranches permet de réduire le risque lié à la volatilité tout en constituant une position solide à moyen ou long terme.
Plan d’exécution
Entrée de la première tranche : 1 200 $ – 1 220 $ (cours actuel du marché)
Zone d’accumulation secondaire : 1 100 $ – 1 150 $ (réservée aux éventuelles mèches de marché)
Objectif 1 : 1 400 $
Objectif 2 : 1 600 $
Objectif 3 : 1 800 $
Niveau d’invalidation : une clôture hebdomadaire confirmée sous les 1 000 $ invaliderait la structure haussière actuelle. (Remarque : les allocations au comptant reposent généralement sur une invalidation structurelle plutôt que sur des ordres stop-loss serrés associés à l’effet de levier.)
Comme toujours, gérez votre risque en conséquence et dimensionnez vos positions selon votre stratégie de portefeuille personnelle.
Que pensez-vous de la structure actuelle du marché de ZEC et de votre plan d’allocation pour cette configuration ?
$ZEC
{future}(ZECUSDT)
#ZECUSDT
Avis aux traders au comptant. Nous observons actuellement une phase d’accumulation à forte probabilité sur le graphique en 4 heures de ZEC.
Après une correction importante depuis la résistance à 1 600 $ jusqu’au niveau de support à 1 000 $, l’actif a établi une base solide. Il a depuis fortement rebondi et s’échange actuellement autour de 1 219 $, en hausse de 8 % sur la journée, soutenu par un volume de trading conséquent dépassant 1,70 milliard d’USDT. Cette évolution des prix suggère un épuisement des vendeurs et un intérêt institutionnel autour de ces niveaux inférieurs.
Pour les investisseurs au comptant, une stratégie d’investissement périodique (DCA) par tranches permet de réduire le risque lié à la volatilité tout en constituant une position solide à moyen ou long terme.
Plan d’exécution
Entrée de la première tranche : 1 200 $ – 1 220 $ (cours actuel du marché)
Zone d’accumulation secondaire : 1 100 $ – 1 150 $ (réservée aux éventuelles mèches de marché)
Objectif 1 : 1 400 $
Objectif 2 : 1 600 $
Objectif 3 : 1 800 $
Niveau d’invalidation : une clôture hebdomadaire confirmée sous les 1 000 $ invaliderait la structure haussière actuelle. (Remarque : les allocations au comptant reposent généralement sur une invalidation structurelle plutôt que sur des ordres stop-loss serrés associés à l’effet de levier.)
Comme toujours, gérez votre risque en conséquence et dimensionnez vos positions selon votre stratégie de portefeuille personnelle.
Que pensez-vous de la structure actuelle du marché de ZEC et de votre plan d’allocation pour cette configuration ?
$ZEC
#ZECUSDT
1
12
·
--
Haussier
Voir la traduction
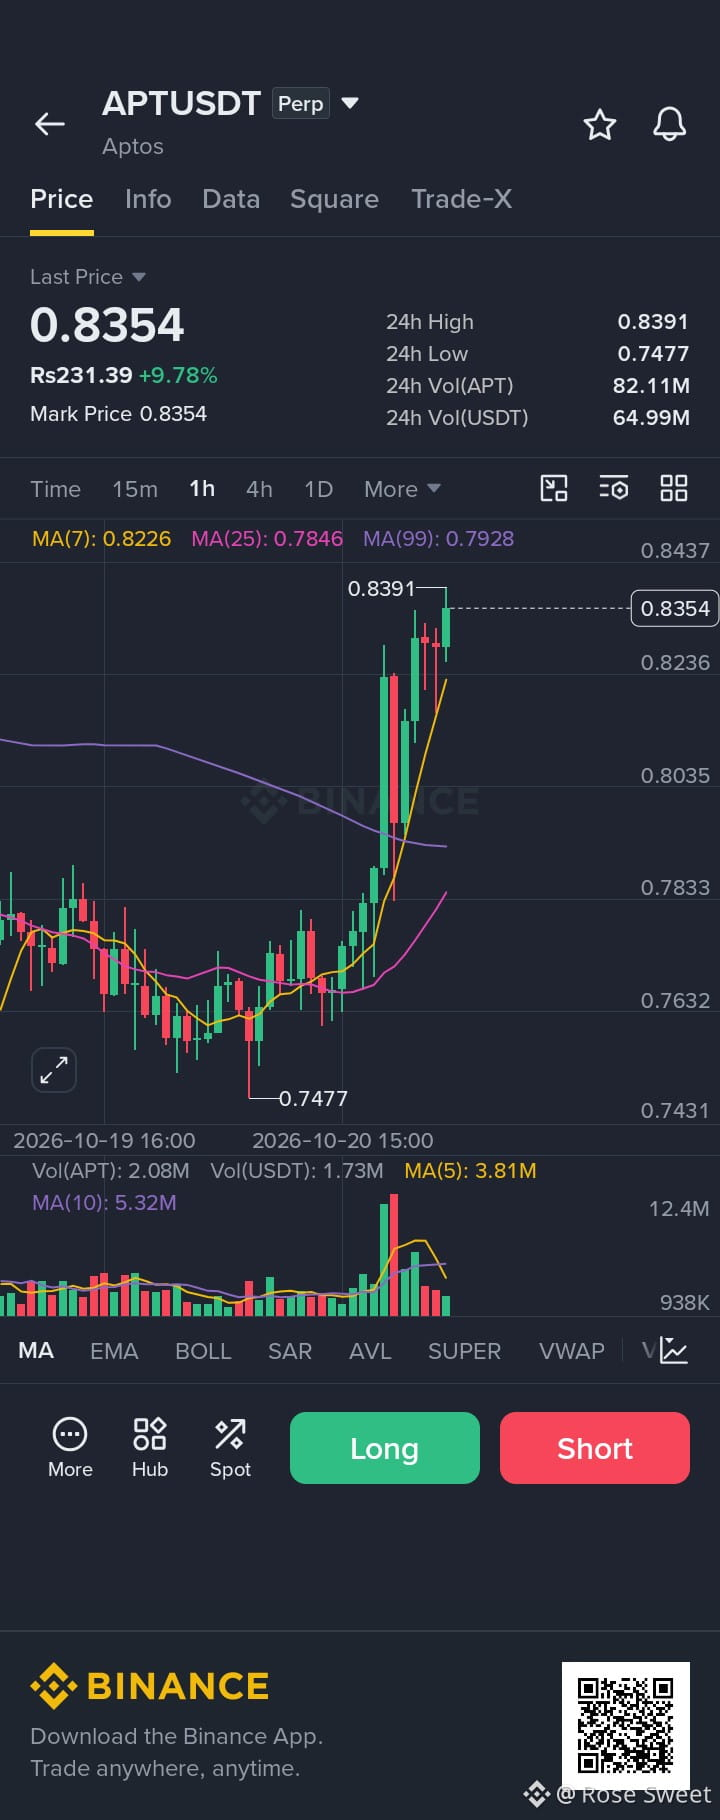
$APT showing strong bullish momentum! 🚀
I’m going LONG as price continues to hold firm above key support. Looking for another potential breakout to the upside!
Entry Zone: $0.8280 – $0.8340
Targets: $0.8420 / $0.8500 / $0.8600
Stop Loss: $0.8160
$APT
{future}(APTUSDT)
$LINK
{future}(LINKUSDT)
#KOSPIFallsMoreThan2%
$APT showing strong bullish momentum! 🚀
I’m going LONG as price continues to hold firm above key support. Looking for another potential breakout to the upside!
Entry Zone: $0.8280 – $0.8340
Targets: $0.8420 / $0.8500 / $0.8600
Stop Loss: $0.8160
$APT
$LINK
#KOSPIFallsMoreThan2%
I’m going LONG as price continues to hold firm above key support. Looking for another potential breakout to the upside!
Entry Zone: $0.8280 – $0.8340
Targets: $0.8420 / $0.8500 / $0.8600
Stop Loss: $0.8160
$APT
$LINK
#KOSPIFallsMoreThan2%
1
9
·
--
Haussier
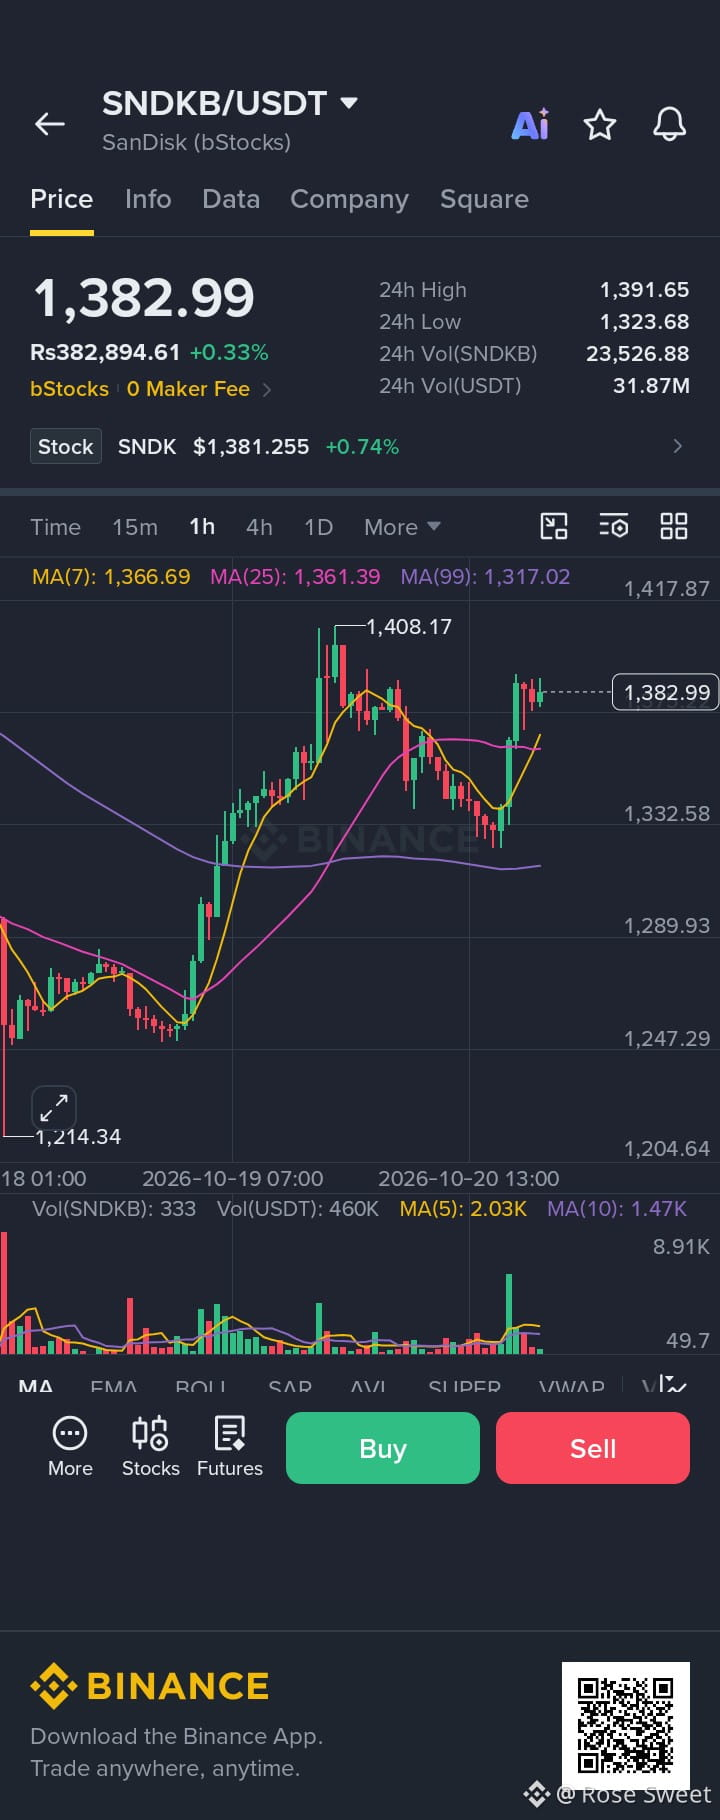
$SNDK Le prix consolide à 1 382,77 $ dans une fourchette définie, soutenu par le groupe d’EMA à 1 369,40 $ et plafonné par la zone d’offre 4 h à 1 401,50 $.
La structure en 1 h montre un alignement haussier, avec l’EMA5 qui croise l’EMA10, mais la dynamique se heurte à une résistance tandis que le RSI approche de la zone de surachat, autour de 73.
La tension entre les différentes unités de temps persiste : les graphiques en 5 min et 1 h montrent des tentatives de reprise, mais celui en 4 h reste neutre et limité à une fourchette tant qu’une clôture décisive au-dessus de 1 401 $ ne confirme pas la cassure.
{future}(SNDKUSDT)
$SNDKB
{spot}(SNDKBUSDT)
#SNDK
$SNDK Le prix consolide à 1 382,77 $ dans une fourchette définie, soutenu par le groupe d’EMA à 1 369,40 $ et plafonné par la zone d’offre 4 h à 1 401,50 $.
La structure en 1 h montre un alignement haussier, avec l’EMA5 qui croise l’EMA10, mais la dynamique se heurte à une résistance tandis que le RSI approche de la zone de surachat, autour de 73.
La tension entre les différentes unités de temps persiste : les graphiques en 5 min et 1 h montrent des tentatives de reprise, mais celui en 4 h reste neutre et limité à une fourchette tant qu’une clôture décisive au-dessus de 1 401 $ ne confirme pas la cassure.
$SNDKB
#SNDK
1
1
Connectez-vous pour découvrir plus de contenu
Rejoignez la communauté mondiale des adeptes de cryptomonnaies sur Binance Square
⚡️ Suviez les dernières informations importantes sur les cryptomonnaies.
💬 Jugé digne de confiance par la plus grande plateforme d’échange de cryptomonnaies au monde.
👍 Découvrez les connaissances que partagent les créateurs vérifiés.
Adresse e-mail/Nº de téléphone
Sujets d’actualité
BinancePick
3.1M vues
152,749 mentions
Rejoignez la #SaisonDesRésultats : prévoyez les résultats sur Binance Pick et partagez votre avis sur Binance Square !
Binance Square Official
·411 mentions J’aime
·343.1k vues
EarningsSeason
5.3M vues
25,981 mentions
AnthropicTTMRevenueGrewAbout1200%
29,072 vues
411 mentions