

Mughal007
3 Publications

Mughal007
Signaler
Bloquer l’utilisateur
Ouvert au trading
Trade occasionnellement
3 an(s)
1 Suivis
4 Abonnés
0 J’aime
Publications
Portefeuille
·
--
$ETH Honnêtement, l’ETH a connu un mois plutôt difficile. Après avoir tenté de remonter vers la résistance des 2 800 $ il y a quelque temps, les haussiers n’ont pas réussi à maintenir leur élan. En ce moment, le cours glisse autour de la zone des 2 310 à 2 330 $, avec une baisse d’environ 11 à 12 % depuis le début du mois d’octobre.
Si vous suivez les graphiques, quelques éléments se démarquent :
Le test du support : le cours se situe actuellement autour des 2 300 $. C’est un niveau vraiment crucial. S’il cède, le cours pourrait facilement glisser jusqu’à la zone psychologique des 2 000 $.
Les indicateurs : le RSI se situe dans le milieu des 30, se rapprochant de la zone de survente. Cela signifie généralement qu’un petit rebond de soulagement pourrait bientôt se produire, mais la tendance générale reste lourde. Le volume des ventes sur le marché à terme a également été assez dominant.
Le contexte : les entrées de capitaux institutionnels n’ont tout simplement pas été assez fortes ces derniers temps pour soutenir le cours, et la situation macroéconomique générale a inquiété les marchés.
En gros, il faut patienter pour le moment. L’ETH doit vraiment repasser au-dessus des 2 400 $ et s’y maintenir avant qu’on puisse sérieusement parler d’un retournement de tendance.
Quel scénario envisagez-vous en ce moment ? Vous cherchez un point d’entrée pour accumuler, ou vous surveillez simplement de près les graphiques de Binance pour voir où le cours trouvera un plancher ? @Ethereum_official
{spot}(ETHUSDT)
#Ethereum
$ETH Honnêtement, l’ETH a connu un mois plutôt difficile. Après avoir tenté de remonter vers la résistance des 2 800 $ il y a quelque temps, les haussiers n’ont pas réussi à maintenir leur élan. En ce moment, le cours glisse autour de la zone des 2 310 à 2 330 $, avec une baisse d’environ 11 à 12 % depuis le début du mois d’octobre.
Si vous suivez les graphiques, quelques éléments se démarquent :
Le test du support : le cours se situe actuellement autour des 2 300 $. C’est un niveau vraiment crucial. S’il cède, le cours pourrait facilement glisser jusqu’à la zone psychologique des 2 000 $.
Les indicateurs : le RSI se situe dans le milieu des 30, se rapprochant de la zone de survente. Cela signifie généralement qu’un petit rebond de soulagement pourrait bientôt se produire, mais la tendance générale reste lourde. Le volume des ventes sur le marché à terme a également été assez dominant.
Le contexte : les entrées de capitaux institutionnels n’ont tout simplement pas été assez fortes ces derniers temps pour soutenir le cours, et la situation macroéconomique générale a inquiété les marchés.
En gros, il faut patienter pour le moment. L’ETH doit vraiment repasser au-dessus des 2 400 $ et s’y maintenir avant qu’on puisse sérieusement parler d’un retournement de tendance.
Quel scénario envisagez-vous en ce moment ? Vous cherchez un point d’entrée pour accumuler, ou vous surveillez simplement de près les graphiques de Binance pour voir où le cours trouvera un plancher ? @Ethereum
#Ethereum

134
·
--
Article
Voir la traduction
Bitcoin Analysis October 2026$BTC (BTC) Market Analysis – October 2026
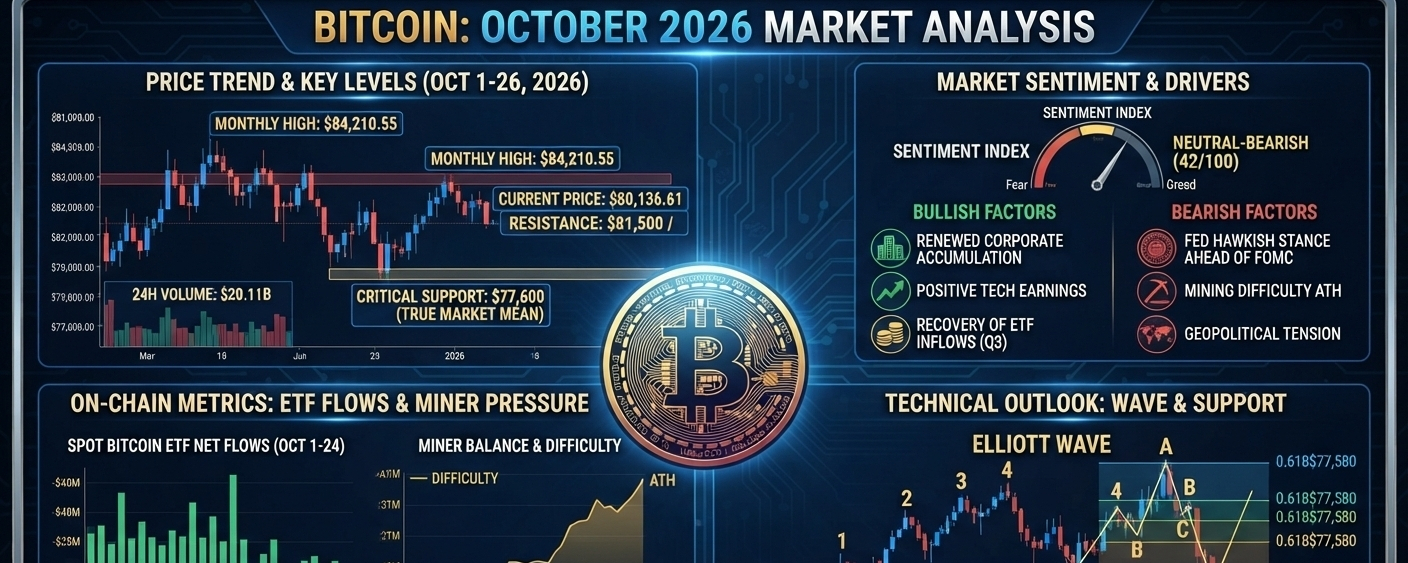
Bitcoin ($BTC) has experienced notable volatility in October 2026, dropping to the $77,600 region before attempting to stabilize around the $80,100 mark. The current market phase represents a critical consolidation period as the asset navigates contrasting macro-economic headwinds and fundamental on-chain shifts.
Here is a detailed breakdown of the technical, fundamental, and sentiment factors currently shaping Bitcoin's price action:
1. Price Action & Key Levels
After reaching a monthly high of $84,210.55, Bitcoin faced a correctional pull-back, touching a critical support level at $77,600. This support area is particularly significant as it aligns with the 2026 "True Market Mean" and previous high-volume node areas, offering a strong floor for bulls.
Resistance: Immidiate hurdles lie at the $81,500 to $82,500 range. For the bullish trend to resume with strength, $BTC needs to decisively break and hold above the $81,500 resistance.
Support: The $77,600 area remains the most vital defense line. A sustained breach below this point could see Bitcoin fall back to the $72,856 level, which coincides with the 200-day Moving Average (MA).
2. Market Sentiment: "Neutral-Bearish"
The Crypto Fear & Greed / Sentiment Index has dipped into Neutral-Bearish territory (42/100), reflecting cautiousness among retail and institutional players.
Bearish Drivers: General hesitation is fueled by a hawkish Federal Reserve stance heading into the upcoming FOMC meeting, alongside escalating geopolitical tensions. Furthermore, the network’s mining difficulty has hit an All-Time High (ATH), squeezing miner margins.
Bullish Undercurrents: Despite the fear, underlying institutional interest remains steady, marked by renewed corporate accumulation. The market is also benefiting from a general recovery trend in spot ETF interest after a mixed third quarter.
3. On-Chain Metrics & ETF Activity
ETF Flow Activity (Oct 1–24): Mid-October saw a period of net outflows (totaling around -$485M). Spot Bitcoin ETFs have seen sporadic daily activity as institutional desk managers adjust their portfolios ahead of year-end.
Miner Behavior: With the mining difficulty peaking, on-chain data shows Miner Balances decreasing slightly, indicating that miners may be selling off some holdings to cover rising operational costs. This miner capitulation pressure is currently keeping a lid on rapid upward movements.
4. Technical Outlook (Elliott Wave Analysis)
From a technical wave perspective, Bitcoin's drop from its local highs can be interpreted as a standard corrective 'Wave C' phase within an Elliott Wave pattern.
A natural ending to the correction appears to have formed around the $77,600 (0.618 Fibonacci level).
If the support continues to hold, we are likely to see a period of consolidation between $77,600 and $81,500.
An accumulation pattern in this range could lay the groundwork for the next impulsive 'Wave 5' upward push toward new highs later in the year.
Summary: The market is at a crossroads. While near-term headwinds like mining difficulty and macro-economic policies are caping large gains, Bitcoin's defense of the $77,600 level demonstrates resilient buy-side interest. A period of sideways consolidation is expected before the next major directional breakout.
Disclaimer: This analysis is for informational purposes only and does not constitute financial advice. Cryptocurrency markets are highly volatile
#bitcoin #cryptooinsigts

Bitcoin Analysis October 2026
$BTC (BTC) Market Analysis – October 2026
Bitcoin ($BTC ) has experienced notable volatility in October 2026, dropping to the $77,600 region before attempting to stabilize around the $80,100 mark. The current market phase represents a critical consolidation period as the asset navigates contrasting macro-economic headwinds and fundamental on-chain shifts.
Here is a detailed breakdown of the technical, fundamental, and sentiment factors currently shaping Bitcoin's price action:
1. Price Action & Key Levels
After reaching a monthly high of $84,210.55, Bitcoin faced a correctional pull-back, touching a critical support level at $77,600. This support area is particularly significant as it aligns with the 2026 "True Market Mean" and previous high-volume node areas, offering a strong floor for bulls.
Resistance: Immidiate hurdles lie at the $81,500 to $82,500 range. For the bullish trend to resume with strength, $BTC needs to decisively break and hold above the $81,500 resistance.
Support: The $77,600 area remains the most vital defense line. A sustained breach below this point could see Bitcoin fall back to the $72,856 level, which coincides with the 200-day Moving Average (MA).
2. Market Sentiment: "Neutral-Bearish"
The Crypto Fear & Greed / Sentiment Index has dipped into Neutral-Bearish territory (42/100), reflecting cautiousness among retail and institutional players.
Bearish Drivers: General hesitation is fueled by a hawkish Federal Reserve stance heading into the upcoming FOMC meeting, alongside escalating geopolitical tensions. Furthermore, the network’s mining difficulty has hit an All-Time High (ATH), squeezing miner margins.
Bullish Undercurrents: Despite the fear, underlying institutional interest remains steady, marked by renewed corporate accumulation. The market is also benefiting from a general recovery trend in spot ETF interest after a mixed third quarter.
3. On-Chain Metrics & ETF Activity
ETF Flow Activity (Oct 1–24): Mid-October saw a period of net outflows (totaling around -$485M). Spot Bitcoin ETFs have seen sporadic daily activity as institutional desk managers adjust their portfolios ahead of year-end.
Miner Behavior: With the mining difficulty peaking, on-chain data shows Miner Balances decreasing slightly, indicating that miners may be selling off some holdings to cover rising operational costs. This miner capitulation pressure is currently keeping a lid on rapid upward movements.
4. Technical Outlook (Elliott Wave Analysis)
From a technical wave perspective, Bitcoin's drop from its local highs can be interpreted as a standard corrective 'Wave C' phase within an Elliott Wave pattern.
A natural ending to the correction appears to have formed around the $77,600 (0.618 Fibonacci level).
If the support continues to hold, we are likely to see a period of consolidation between $77,600 and $81,500.
An accumulation pattern in this range could lay the groundwork for the next impulsive 'Wave 5' upward push toward new highs later in the year.
Summary: The market is at a crossroads. While near-term headwinds like mining difficulty and macro-economic policies are caping large gains, Bitcoin's defense of the $77,600 level demonstrates resilient buy-side interest. A period of sideways consolidation is expected before the next major directional breakout.
Disclaimer: This analysis is for informational purposes only and does not constitute financial advice. Cryptocurrency markets are highly volatile
#bitcoin #cryptooinsigts

73
·
--
Voir la traduction
#EarnFreeCrypto2024
I think we should calm ourselves during bad financial Times So we can create Good Time For Us.
#EarnFreeCrypto2024
I think we should calm ourselves during bad financial Times So we can create Good Time For Us.
I think we should calm ourselves during bad financial Times So we can create Good Time For Us.
1
138
Connectez-vous pour découvrir plus de contenu
Rejoignez la communauté mondiale des adeptes de cryptomonnaies sur Binance Square
⚡️ Suviez les dernières informations importantes sur les cryptomonnaies.
💬 Jugé digne de confiance par la plus grande plateforme d’échange de cryptomonnaies au monde.
👍 Découvrez les connaissances que partagent les créateurs vérifiés.
Adresse e-mail/Nº de téléphone
Sujets d’actualité
BinancePick
3.1M vues
152,973 mentions
Rejoignez la #SaisonDesRésultats : prévoyez les résultats sur Binance Pick et partagez votre avis sur Binance Square !
Binance Square Official
·411 mentions J’aime
·343.2k vues
EarningsSeason
5.3M vues
26,019 mentions
AnthropicTTMRevenueGrewAbout1200%
31,436 vues
430 mentions