
MOBIN CRYPTOX
926 Publications

MOBIN CRYPTOX
Signaler
Bloquer l’utilisateur
Crypto and Gold Market Analysis Bitcoin ETH XAUUSD Technical Analysis Market Research
Ouvert au trading
Trade régulièrement
1.1 an(s)
30 Suivis
777 Abonnés
337 J’aime
Publications
Portefeuille
Tous
Citations
·
--
Baissier
Voir la traduction
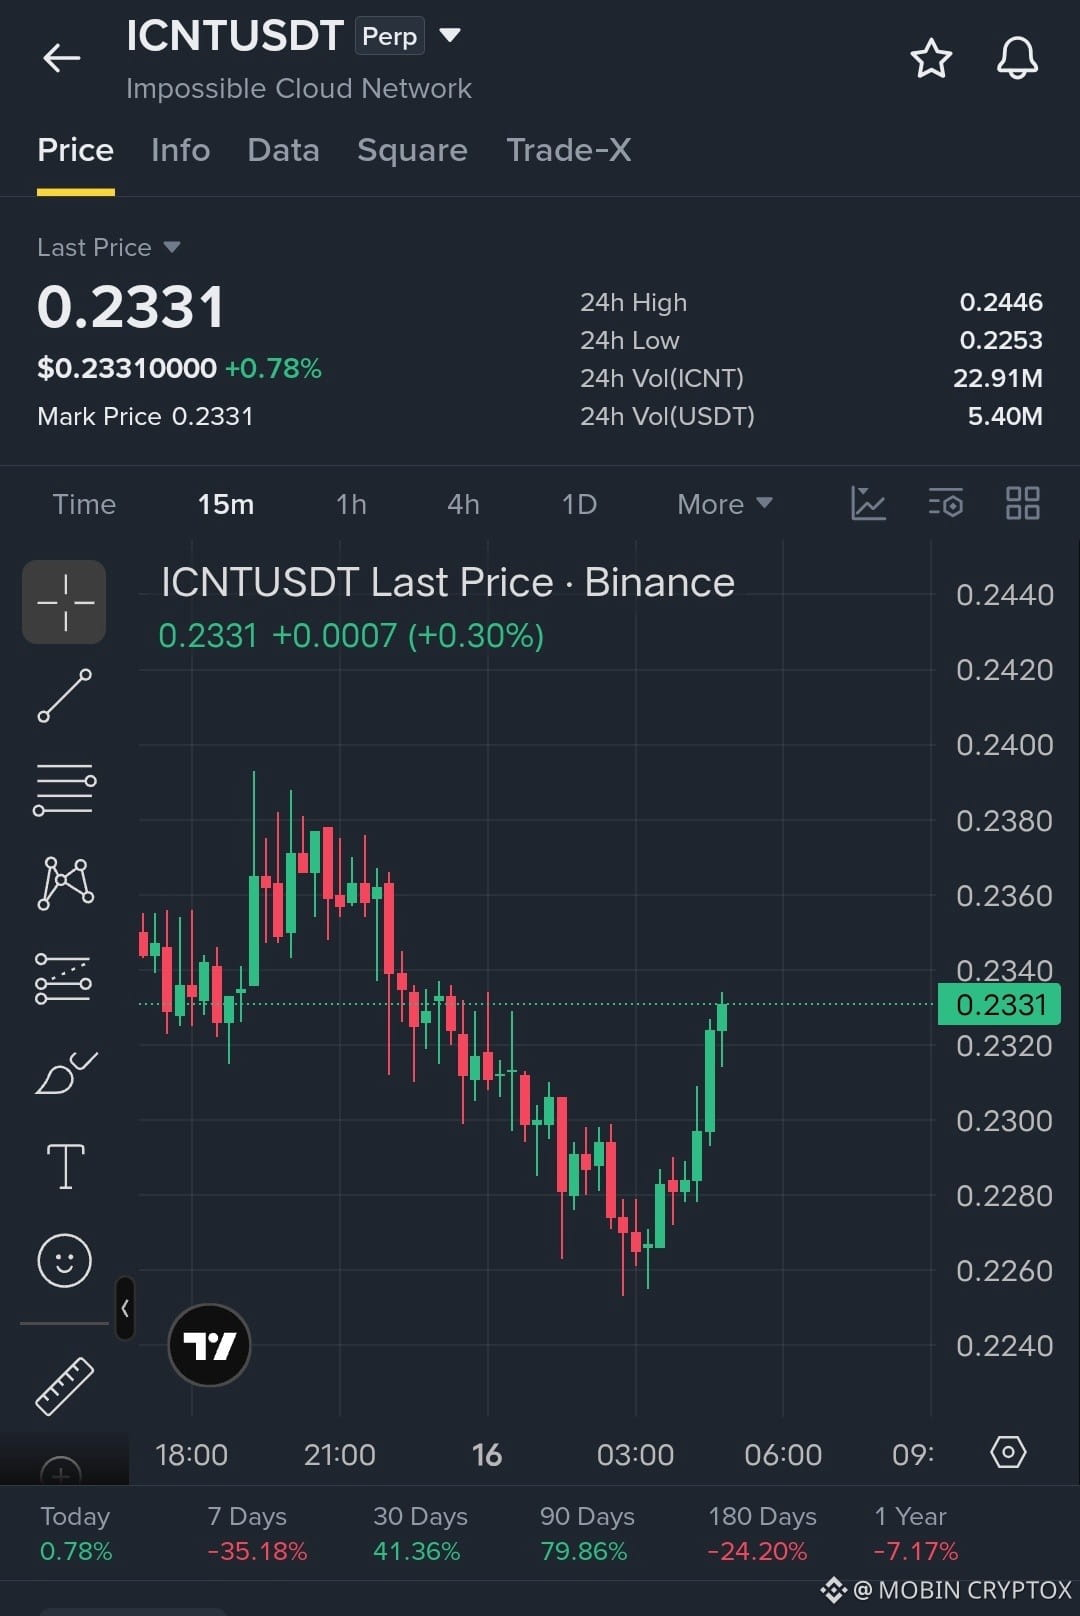
$ICNT ICNTUSDT: Recovery Begins or Just a Temporary Bounce?
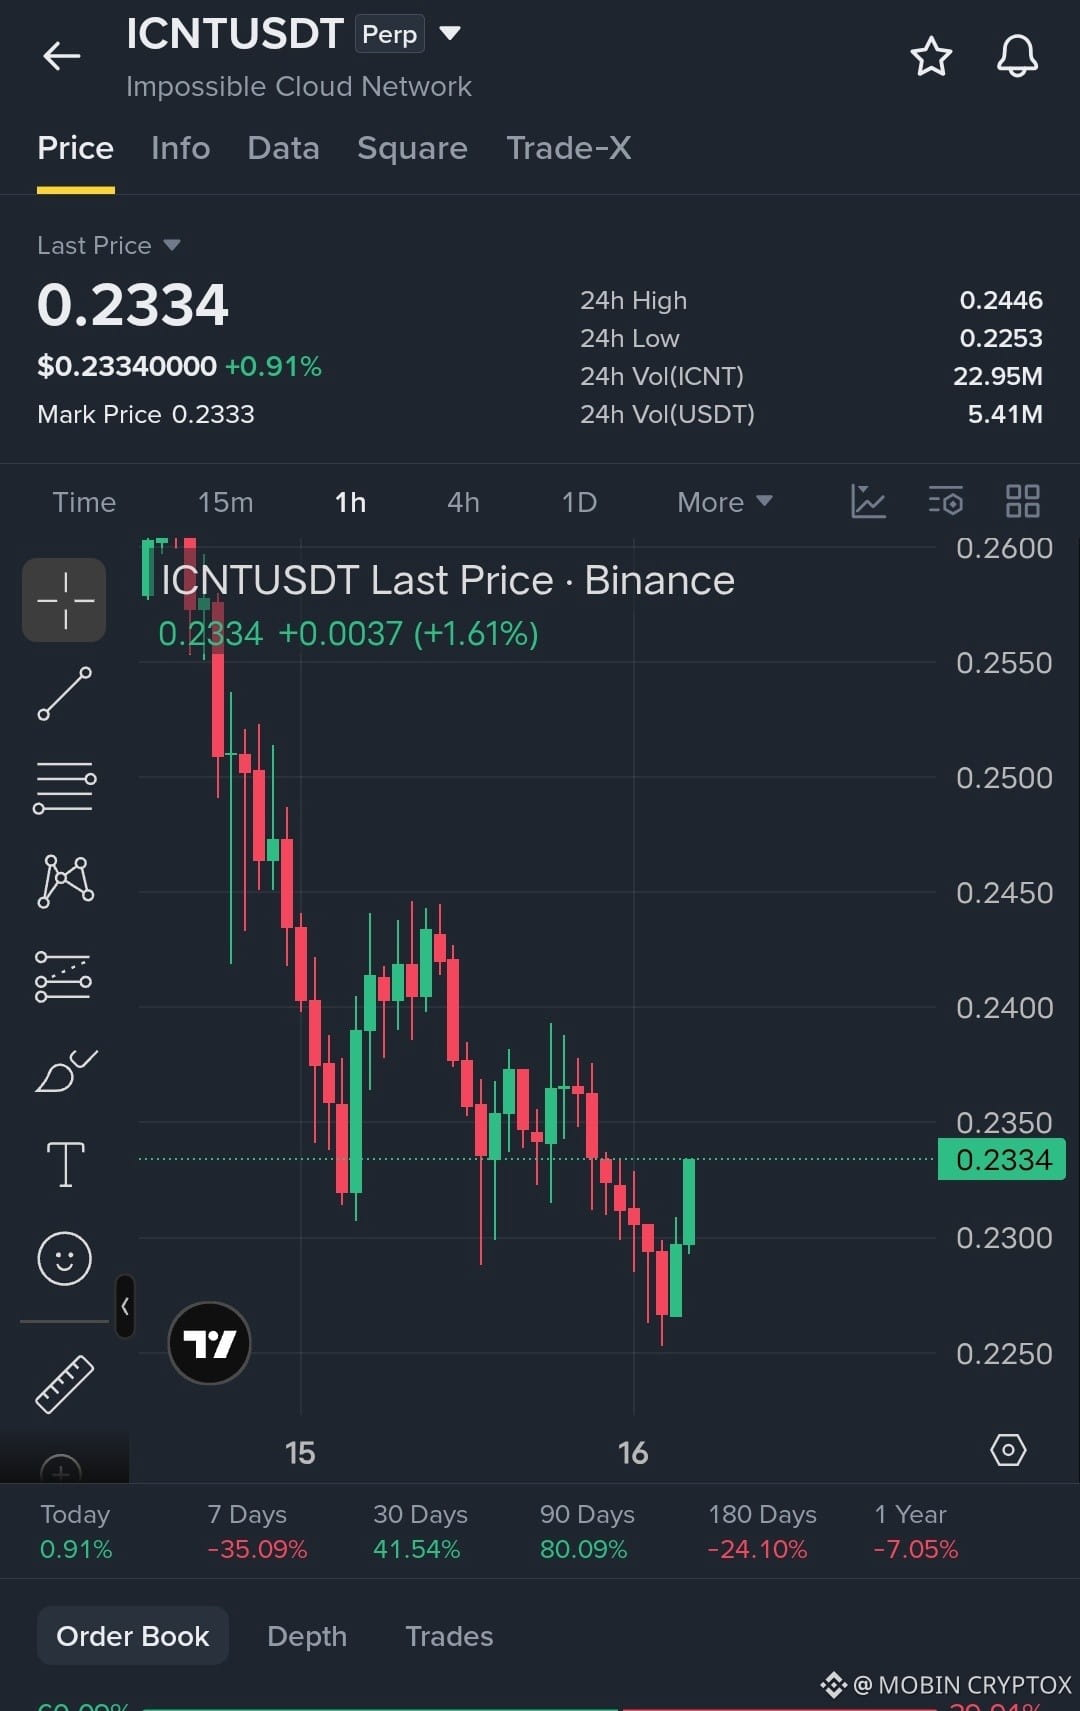
ICNT is showing a short-term rebound after a strong decline. Buyers are pushing price toward $0.2334, but the 1H trend remains bearish.$ICNT
📊 Key Levels 🟢 Support: $0.2300 – $0.2260 🔴 Resistance: $0.2360 – $0.2400
📈 Bullish Targets: $0.2380 → $0.2440
📉 Bearish Targets: $0.2280 → $0.2250
Trading Setup (Conditional)
Long entry: Above $0.2360 after confirmation
Long stop-loss: $0.2300
Short entry: Below $0.2280 after confirmation
Short stop-loss: $0.2340
💡 My View: A recovery is developing on the 15-minute chart, but buyers must break resistance to confirm stronger momentum.
🔥 Will ICNT reach $0.2440 or fall below $0.2280?
#ICNT #CryptoAnalysis #Altcoins #BinanceSquare
Educational analysis only. Not financial advice. DYOR #BinanceSquareFamily $ICNT
{future}(ICNTUSDT)
$ICNT ICNTUSDT: Recovery Begins or Just a Temporary Bounce?
ICNT is showing a short-term rebound after a strong decline. Buyers are pushing price toward $0.2334, but the 1H trend remains bearish.$ICNT
📊 Key Levels 🟢 Support: $0.2300 – $0.2260 🔴 Resistance: $0.2360 – $0.2400
📈 Bullish Targets: $0.2380 → $0.2440
📉 Bearish Targets: $0.2280 → $0.2250
Trading Setup (Conditional)
Long entry: Above $0.2360 after confirmation
Long stop-loss: $0.2300
Short entry: Below $0.2280 after confirmation
Short stop-loss: $0.2340
💡 My View: A recovery is developing on the 15-minute chart, but buyers must break resistance to confirm stronger momentum.
🔥 Will ICNT reach $0.2440 or fall below $0.2280?
#ICNT #CryptoAnalysis #Altcoins #BinanceSquare
Educational analysis only. Not financial advice. DYOR #BinanceSquareFamily $ICNT
ICNT is showing a short-term rebound after a strong decline. Buyers are pushing price toward $0.2334, but the 1H trend remains bearish.$ICNT
📊 Key Levels 🟢 Support: $0.2300 – $0.2260 🔴 Resistance: $0.2360 – $0.2400
📈 Bullish Targets: $0.2380 → $0.2440
📉 Bearish Targets: $0.2280 → $0.2250
Trading Setup (Conditional)
Long entry: Above $0.2360 after confirmation
Long stop-loss: $0.2300
Short entry: Below $0.2280 after confirmation
Short stop-loss: $0.2340
💡 My View: A recovery is developing on the 15-minute chart, but buyers must break resistance to confirm stronger momentum.
🔥 Will ICNT reach $0.2440 or fall below $0.2280?
#ICNT #CryptoAnalysis #Altcoins #BinanceSquare
Educational analysis only. Not financial advice. DYOR #BinanceSquareFamily $ICNT
33
·
--
Baissier
Voir la traduction
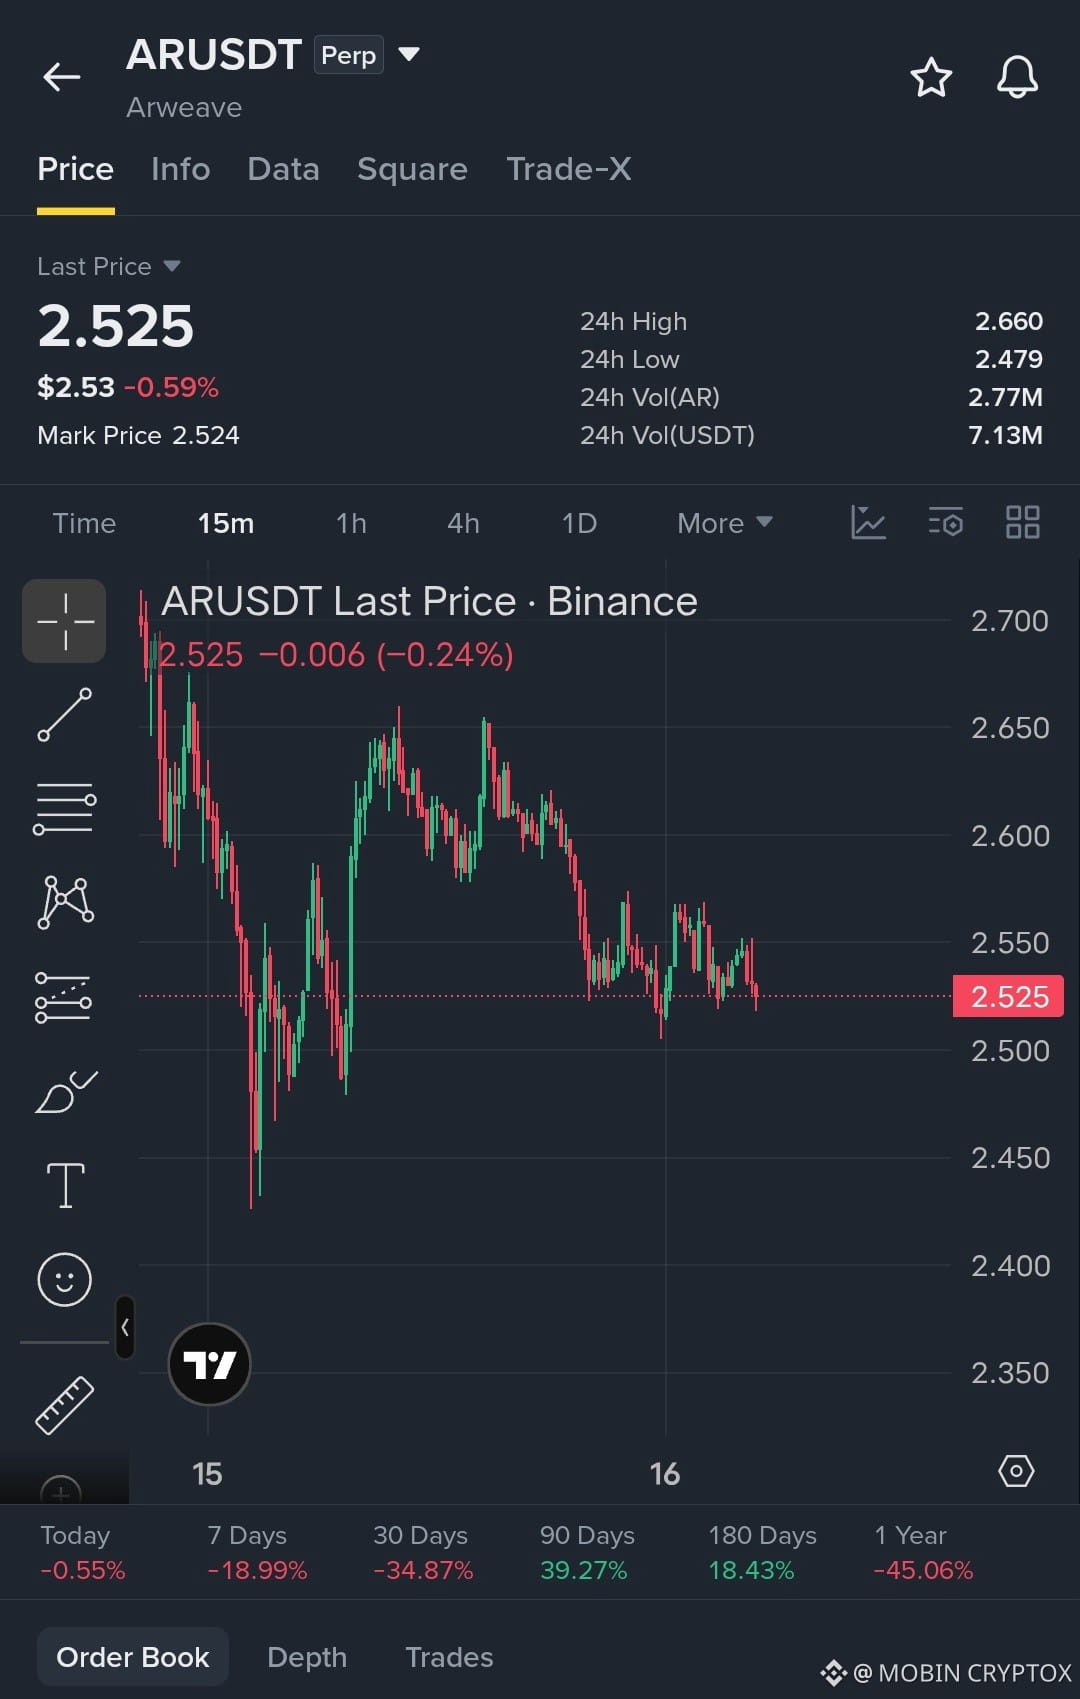
$AR ARWEAVE (AR) AT $2.52 — BREAKDOWN OR RECOVERY AHEAD
{future}(ARUSDT)
Arweave is showing short-term weakness after a prolonged decline. Buyers are attempting to stabilize the price around $2.52, but selling pressure remains visible.
📊 Key Levels 🟢 Support: $2.50 – $2.48 🔴 Resistance: $2.55 – $2.60
📈 Bullish Scenario: A confirmed breakout above $2.55 could open the way toward $2.60.
📉 Bearish Scenario: A breakdown below $2.48 could increase downside pressure.
🔍 What's Next? The market needs stronger buying volume before a recovery can be trusted. No confirmed reversal yet.
💬 Your Opinion: Will AR recover above $2.60, or will sellers push it lower?
#AR #Arweave #CryptoAnalysis #Altcoins #BinanceSquare
Educational market analysis, not financial advice. DYOR.
$AR
$AR ARWEAVE (AR) AT $2.52 — BREAKDOWN OR RECOVERY AHEAD
Arweave is showing short-term weakness after a prolonged decline. Buyers are attempting to stabilize the price around $2.52, but selling pressure remains visible.
📊 Key Levels 🟢 Support: $2.50 – $2.48 🔴 Resistance: $2.55 – $2.60
📈 Bullish Scenario: A confirmed breakout above $2.55 could open the way toward $2.60.
📉 Bearish Scenario: A breakdown below $2.48 could increase downside pressure.
🔍 What's Next? The market needs stronger buying volume before a recovery can be trusted. No confirmed reversal yet.
💬 Your Opinion: Will AR recover above $2.60, or will sellers push it lower?
#AR #Arweave #CryptoAnalysis #Altcoins #BinanceSquare
Educational market analysis, not financial advice. DYOR.
$AR
Arweave is showing short-term weakness after a prolonged decline. Buyers are attempting to stabilize the price around $2.52, but selling pressure remains visible.
📊 Key Levels 🟢 Support: $2.50 – $2.48 🔴 Resistance: $2.55 – $2.60
📈 Bullish Scenario: A confirmed breakout above $2.55 could open the way toward $2.60.
📉 Bearish Scenario: A breakdown below $2.48 could increase downside pressure.
🔍 What's Next? The market needs stronger buying volume before a recovery can be trusted. No confirmed reversal yet.
💬 Your Opinion: Will AR recover above $2.60, or will sellers push it lower?
#AR #Arweave #CryptoAnalysis #Altcoins #BinanceSquare
Educational market analysis, not financial advice. DYOR.
$AR
113

Article
L’OR SOUS PRESSION ! Est-ce une occasion d’achat ou le début d’une correction plus profonde ?$XAU L’or a toujours été considéré comme une valeur refuge. Mais même l’or n’est pas à l’abri des puissantes forces du marché.
Le métal précieux a récemment subi une forte liquidation, soulevant une question importante : les investisseurs perdent-ils confiance dans l’or, ou le marché s’adapte-t-il simplement à une nouvelle réalité économique ?
$XAU 📊 QUE SE PASSE-T-IL SUR LE MARCHÉ DE L’OR ?
Selon Reuters, l’or au comptant s’échangeait autour de 3 879,71 $ l’once le 13 novembre 2026, après avoir chuté d’environ 4,5 % au cours de la semaine.
L’or a également touché un niveau proche de 3 852 $ lors de la liquidation de jeudi.
L’OR SOUS PRESSION ! Est-ce une occasion d’achat ou le début d’une correction plus profonde ?
$XAU L’or a toujours été considéré comme une valeur refuge. Mais même l’or n’est pas à l’abri des puissantes forces du marché.
Le métal précieux a récemment subi une forte liquidation, soulevant une question importante : les investisseurs perdent-ils confiance dans l’or, ou le marché s’adapte-t-il simplement à une nouvelle réalité économique ?
$XAU 📊 QUE SE PASSE-T-IL SUR LE MARCHÉ DE L’OR ?
Selon Reuters, l’or au comptant s’échangeait autour de 3 879,71 $ l’once le 13 novembre 2026, après avoir chuté d’environ 4,5 % au cours de la semaine.
L’or a également touché un niveau proche de 3 852 $ lors de la liquidation de jeudi.
Le métal précieux a récemment subi une forte liquidation, soulevant une question importante : les investisseurs perdent-ils confiance dans l’or, ou le marché s’adapte-t-il simplement à une nouvelle réalité économique ?
$XAU 📊 QUE SE PASSE-T-IL SUR LE MARCHÉ DE L’OR ?
Selon Reuters, l’or au comptant s’échangeait autour de 3 879,71 $ l’once le 13 novembre 2026, après avoir chuté d’environ 4,5 % au cours de la semaine.
L’or a également touché un niveau proche de 3 852 $ lors de la liquidation de jeudi.
415
Voir la traduction
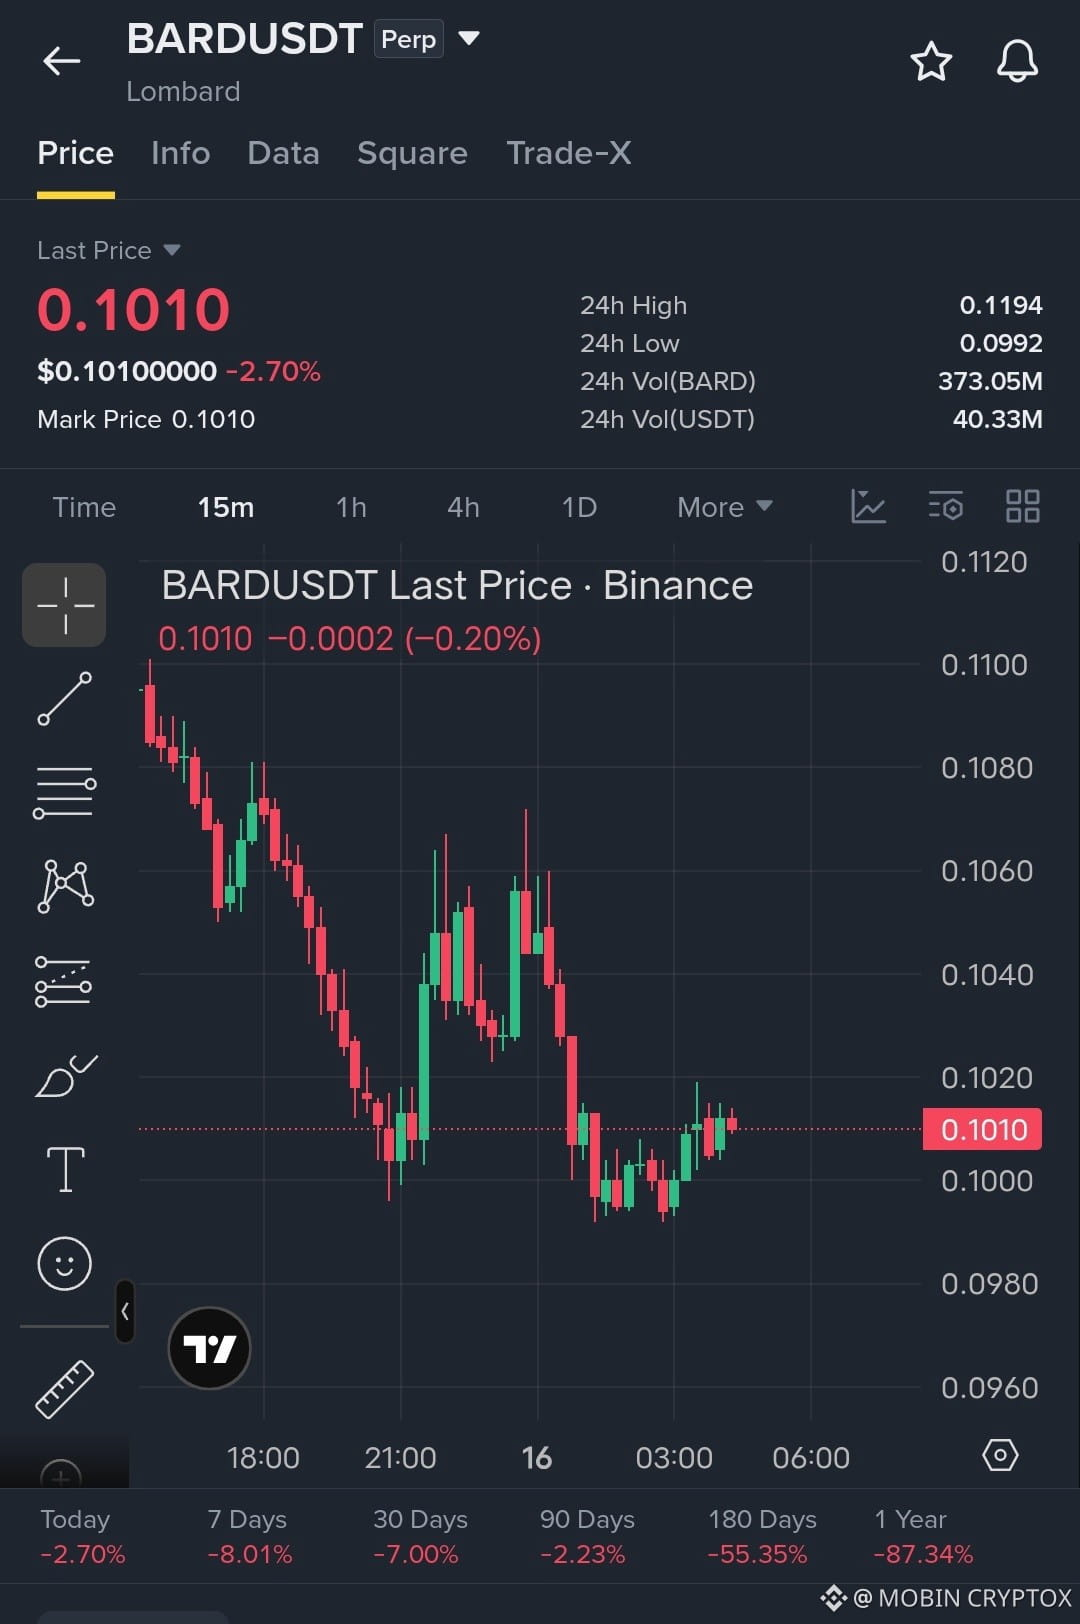
$BARD BARDUSDT: Is a Recovery Coming or More Downside Ahead?
{future}(BARDUSDT)
BARD is showing weakness after a prolonged decline. The latest candles indicate a small recovery, but buyers have not confirmed a trend reversal.
📊 Market Overview
Price: $0.1010
24H Change: -2.70%
24H High: $0.1194
24H Low: $0.0992
🔍 Key Technical Levels 🟢 Support: $0.1000–$0.0990 🔴 Resistance: $0.1020–$0.1040
📈 My Analysis: BARD is attempting to stabilize near $0.1010. A breakout above $0.1040 could improve short-term momentum.
However, a breakdown below $0.0990 could bring further selling pressure.
What do you think? Can BARD recover, or will sellers take control again?
#BARD #BARDUSDT #CryptoAnalysis #Altcoins #BinanceSquare
Educational analysis based on the supplied 15-minute chart. Not financial advice.
$BARD
$BARD BARDUSDT: Is a Recovery Coming or More Downside Ahead?
BARD is showing weakness after a prolonged decline. The latest candles indicate a small recovery, but buyers have not confirmed a trend reversal.
📊 Market Overview
Price: $0.1010
24H Change: -2.70%
24H High: $0.1194
24H Low: $0.0992
🔍 Key Technical Levels 🟢 Support: $0.1000–$0.0990 🔴 Resistance: $0.1020–$0.1040
📈 My Analysis: BARD is attempting to stabilize near $0.1010. A breakout above $0.1040 could improve short-term momentum.
However, a breakdown below $0.0990 could bring further selling pressure.
What do you think? Can BARD recover, or will sellers take control again?
#BARD #BARDUSDT #CryptoAnalysis #Altcoins #BinanceSquare
Educational analysis based on the supplied 15-minute chart. Not financial advice.
$BARD
BARD is showing weakness after a prolonged decline. The latest candles indicate a small recovery, but buyers have not confirmed a trend reversal.
📊 Market Overview
Price: $0.1010
24H Change: -2.70%
24H High: $0.1194
24H Low: $0.0992
🔍 Key Technical Levels 🟢 Support: $0.1000–$0.0990 🔴 Resistance: $0.1020–$0.1040
📈 My Analysis: BARD is attempting to stabilize near $0.1010. A breakout above $0.1040 could improve short-term momentum.
However, a breakdown below $0.0990 could bring further selling pressure.
What do you think? Can BARD recover, or will sellers take control again?
#BARD #BARDUSDT #CryptoAnalysis #Altcoins #BinanceSquare
Educational analysis based on the supplied 15-minute chart. Not financial advice.
$BARD
145

Article
BITCOIN : le calme avant le prochain grand mouvement ? Que surveillent les investisseurs avisés ?Le Bitcoin est bien plus qu’une simple cryptomonnaie. C’est un marché influencé par la psychologie, la liquidité, les capitaux institutionnels et la confiance des investisseurs.
Mais voici une question importante :
Lorsque le Bitcoin chute soudainement, est-ce la fin de la hausse — ou une occasion de prendre un nouveau départ ?
Explorons 5 choses que tout investisseur en Bitcoin devrait comprendre.
📊 1. Le combat entre acheteurs et vendeurs
Chaque mouvement du cours du Bitcoin raconte une histoire.
Lorsque les acheteurs prennent le dessus, les cours peuvent grimper. Lorsque les vendeurs dominent, la pression à la baisse s’accentue.
BITCOIN : le calme avant le prochain grand mouvement ? Que surveillent les investisseurs avisés ?
Le Bitcoin est bien plus qu’une simple cryptomonnaie. C’est un marché influencé par la psychologie, la liquidité, les capitaux institutionnels et la confiance des investisseurs.
Mais voici une question importante :
Lorsque le Bitcoin chute soudainement, est-ce la fin de la hausse — ou une occasion de prendre un nouveau départ ?
Explorons 5 choses que tout investisseur en Bitcoin devrait comprendre.
📊 1. Le combat entre acheteurs et vendeurs
Chaque mouvement du cours du Bitcoin raconte une histoire.
Lorsque les acheteurs prennent le dessus, les cours peuvent grimper. Lorsque les vendeurs dominent, la pression à la baisse s’accentue.
Mais voici une question importante :
Lorsque le Bitcoin chute soudainement, est-ce la fin de la hausse — ou une occasion de prendre un nouveau départ ?
Explorons 5 choses que tout investisseur en Bitcoin devrait comprendre.
📊 1. Le combat entre acheteurs et vendeurs
Chaque mouvement du cours du Bitcoin raconte une histoire.
Lorsque les acheteurs prennent le dessus, les cours peuvent grimper. Lorsque les vendeurs dominent, la pression à la baisse s’accentue.
90
·
--
Baissier
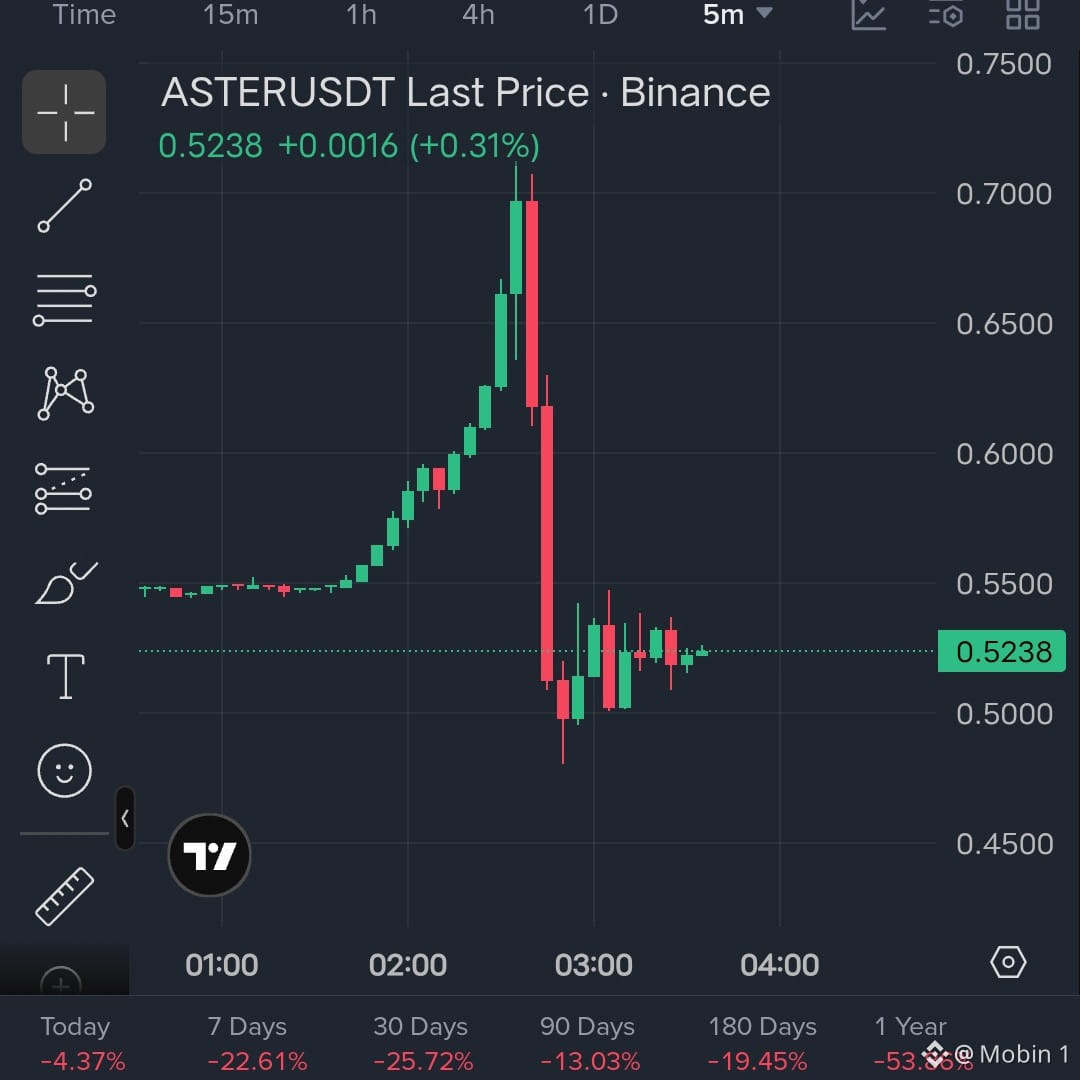
$ASTER 📉 ASTER/USDT : rejet brutal après une forte hausse !
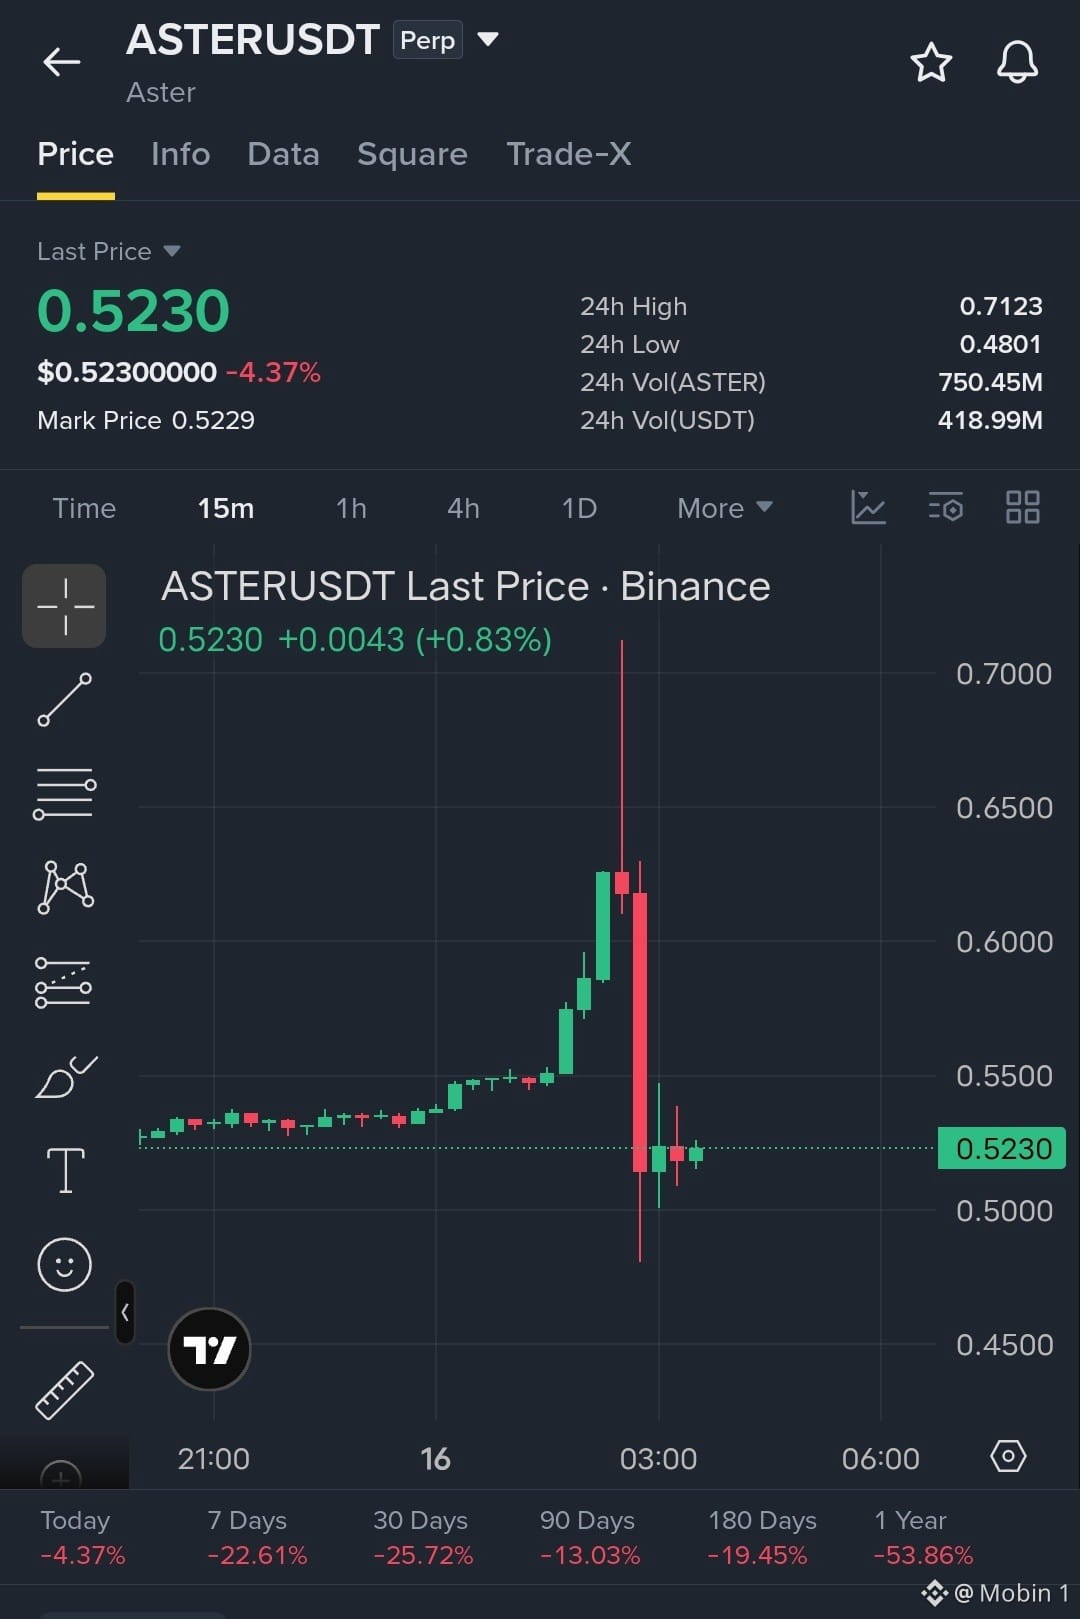
ASTER a grimpé jusqu’à 0.7123 $ avant de connaître une forte vague de ventes qui l’a ramené à 0.4801 $.
Vue d’ensemble du marché
Prix actuel : 0.5230 $
Variation sur 24 h : -4.37 %
Plus haut sur 24 h : 0.7123 $
Plus bas sur 24 h : 0.4801 $
Analyse technique 🔴 Résistance : 0.5500–0.6000 $
🟢 Support : 0.5000 $ et 0.4800 $
Mon avis : ASTER consolide autour de 0.52 $ après une forte correction. Les acheteurs doivent reprendre de l’élan pour s’attaquer à la résistance.
Une cassure sous 0.50 $ pourrait accentuer la pression à la baisse.
Qu’en pensez-vous ? ASTER va-t-il se redresser ou poursuivre sa baisse ?
#ASTER #ASTERUSDT #AnalyseCrypto #BinanceSquare
Analyse éducative fondée sur le graphique fourni. Ceci ne constitue pas un conseil financier.
$ASTER $BTC
{future}(ASTERUSDT)
$ASTER 📉 ASTER/USDT : rejet brutal après une forte hausse !
ASTER a grimpé jusqu’à 0.7123 $ avant de connaître une forte vague de ventes qui l’a ramené à 0.4801 $.
Vue d’ensemble du marché
Prix actuel : 0.5230 $
Variation sur 24 h : -4.37 %
Plus haut sur 24 h : 0.7123 $
Plus bas sur 24 h : 0.4801 $
Analyse technique 🔴 Résistance : 0.5500–0.6000 $
🟢 Support : 0.5000 $ et 0.4800 $
Mon avis : ASTER consolide autour de 0.52 $ après une forte correction. Les acheteurs doivent reprendre de l’élan pour s’attaquer à la résistance.
Une cassure sous 0.50 $ pourrait accentuer la pression à la baisse.
Qu’en pensez-vous ? ASTER va-t-il se redresser ou poursuivre sa baisse ?
#ASTER #ASTERUSDT #AnalyseCrypto #BinanceSquare
Analyse éducative fondée sur le graphique fourni. Ceci ne constitue pas un conseil financier.
$ASTER $BTC
ASTER a grimpé jusqu’à 0.7123 $ avant de connaître une forte vague de ventes qui l’a ramené à 0.4801 $.
Vue d’ensemble du marché
Prix actuel : 0.5230 $
Variation sur 24 h : -4.37 %
Plus haut sur 24 h : 0.7123 $
Plus bas sur 24 h : 0.4801 $
Analyse technique 🔴 Résistance : 0.5500–0.6000 $
🟢 Support : 0.5000 $ et 0.4800 $
Mon avis : ASTER consolide autour de 0.52 $ après une forte correction. Les acheteurs doivent reprendre de l’élan pour s’attaquer à la résistance.
Une cassure sous 0.50 $ pourrait accentuer la pression à la baisse.
Qu’en pensez-vous ? ASTER va-t-il se redresser ou poursuivre sa baisse ?
#ASTER #ASTERUSDT #AnalyseCrypto #BinanceSquare
Analyse éducative fondée sur le graphique fourni. Ceci ne constitue pas un conseil financier.
$ASTER $BTC
531
Voir la traduction
$BTC 📉 BITCOIN MARKET ANALYSIS: Is This a Real Recovery or Just a Temporary Bounce?
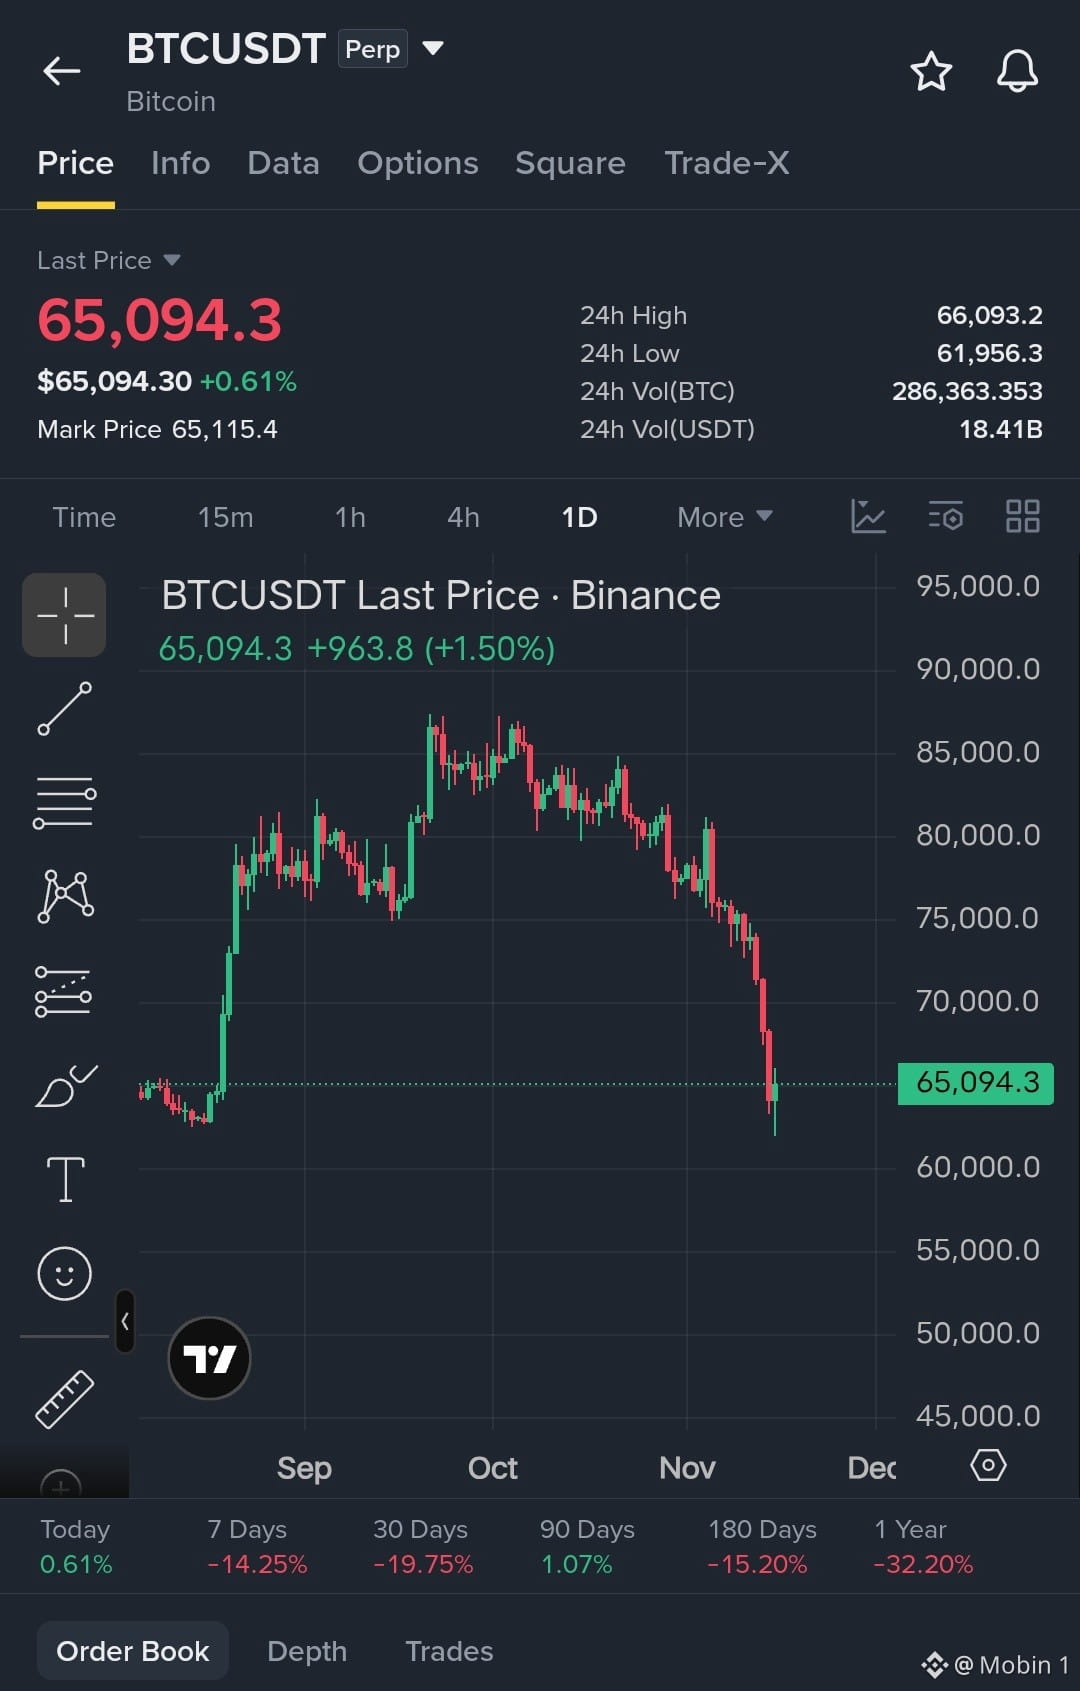
Bitcoin is showing a small recovery after a sharp decline. However, the bigger picture still deserves attention.
1 Overall Trend
Bitcoin has formed lower highs and lower lows on the visible daily chart. This suggests that sellers have maintained control over the broader trend.
2. Important Support
The $61,950–$62,000 area is an important level to monitor because the recent decline reached this region before bouncing.
If price breaks below this area and fails to recover, further downside pressure could develop.
3. Important Resistance
The $66,000–$66,100 region is the first level I would watch.
A daily close above this area, followed by a successful retest, could indicate improving buying strength.
📈 Two Possible Scenarios
🟢 Bullish Scenario: Bitcoin reclaims $66,100 and starts forming higher highs. This could create an opportunity for a stronger recovery.
🔴 Bearish Scenario: Bitcoin gets rejected near resistance and loses the $61,950 support area. This could indicate that sellers remain in control.
💭 My Personal View
I would avoid calling this a confirmed trend reversal based on one rebound.
I want to see stronger buying participation, a confirmed daily breakout and a successful retest before becoming more confident about a recovery.
Risk management matters more than predicting the exact bottom.
❓ What Do You Think?
Is Bitcoin preparing for a recovery, or could another correction be coming?
Share your analysis in the comments.
Follow me for more educational BTC market analysis.
#Bitcoin #BTC #BTCUSDT #CryptoAnalysis #TechnicalAnalysis #BinanceSquare
Disclaimer: Educational analysis based on the supplied chart. Not financial advice. Prices and market conditions may change.
{future}(BTCUSDT)
$BTC 📉 BITCOIN MARKET ANALYSIS: Is This a Real Recovery or Just a Temporary Bounce?
Bitcoin is showing a small recovery after a sharp decline. However, the bigger picture still deserves attention.
1 Overall Trend
Bitcoin has formed lower highs and lower lows on the visible daily chart. This suggests that sellers have maintained control over the broader trend.
2. Important Support
The $61,950–$62,000 area is an important level to monitor because the recent decline reached this region before bouncing.
If price breaks below this area and fails to recover, further downside pressure could develop.
3. Important Resistance
The $66,000–$66,100 region is the first level I would watch.
A daily close above this area, followed by a successful retest, could indicate improving buying strength.
📈 Two Possible Scenarios
🟢 Bullish Scenario: Bitcoin reclaims $66,100 and starts forming higher highs. This could create an opportunity for a stronger recovery.
🔴 Bearish Scenario: Bitcoin gets rejected near resistance and loses the $61,950 support area. This could indicate that sellers remain in control.
💭 My Personal View
I would avoid calling this a confirmed trend reversal based on one rebound.
I want to see stronger buying participation, a confirmed daily breakout and a successful retest before becoming more confident about a recovery.
Risk management matters more than predicting the exact bottom.
❓ What Do You Think?
Is Bitcoin preparing for a recovery, or could another correction be coming?
Share your analysis in the comments.
Follow me for more educational BTC market analysis.
#Bitcoin #BTC #BTCUSDT #CryptoAnalysis #TechnicalAnalysis #BinanceSquare
Disclaimer: Educational analysis based on the supplied chart. Not financial advice. Prices and market conditions may change.
Bitcoin is showing a small recovery after a sharp decline. However, the bigger picture still deserves attention.
1 Overall Trend
Bitcoin has formed lower highs and lower lows on the visible daily chart. This suggests that sellers have maintained control over the broader trend.
2. Important Support
The $61,950–$62,000 area is an important level to monitor because the recent decline reached this region before bouncing.
If price breaks below this area and fails to recover, further downside pressure could develop.
3. Important Resistance
The $66,000–$66,100 region is the first level I would watch.
A daily close above this area, followed by a successful retest, could indicate improving buying strength.
📈 Two Possible Scenarios
🟢 Bullish Scenario: Bitcoin reclaims $66,100 and starts forming higher highs. This could create an opportunity for a stronger recovery.
🔴 Bearish Scenario: Bitcoin gets rejected near resistance and loses the $61,950 support area. This could indicate that sellers remain in control.
💭 My Personal View
I would avoid calling this a confirmed trend reversal based on one rebound.
I want to see stronger buying participation, a confirmed daily breakout and a successful retest before becoming more confident about a recovery.
Risk management matters more than predicting the exact bottom.
❓ What Do You Think?
Is Bitcoin preparing for a recovery, or could another correction be coming?
Share your analysis in the comments.
Follow me for more educational BTC market analysis.
#Bitcoin #BTC #BTCUSDT #CryptoAnalysis #TechnicalAnalysis #BinanceSquare
Disclaimer: Educational analysis based on the supplied chart. Not financial advice. Prices and market conditions may change.
70
·
--
Haussier
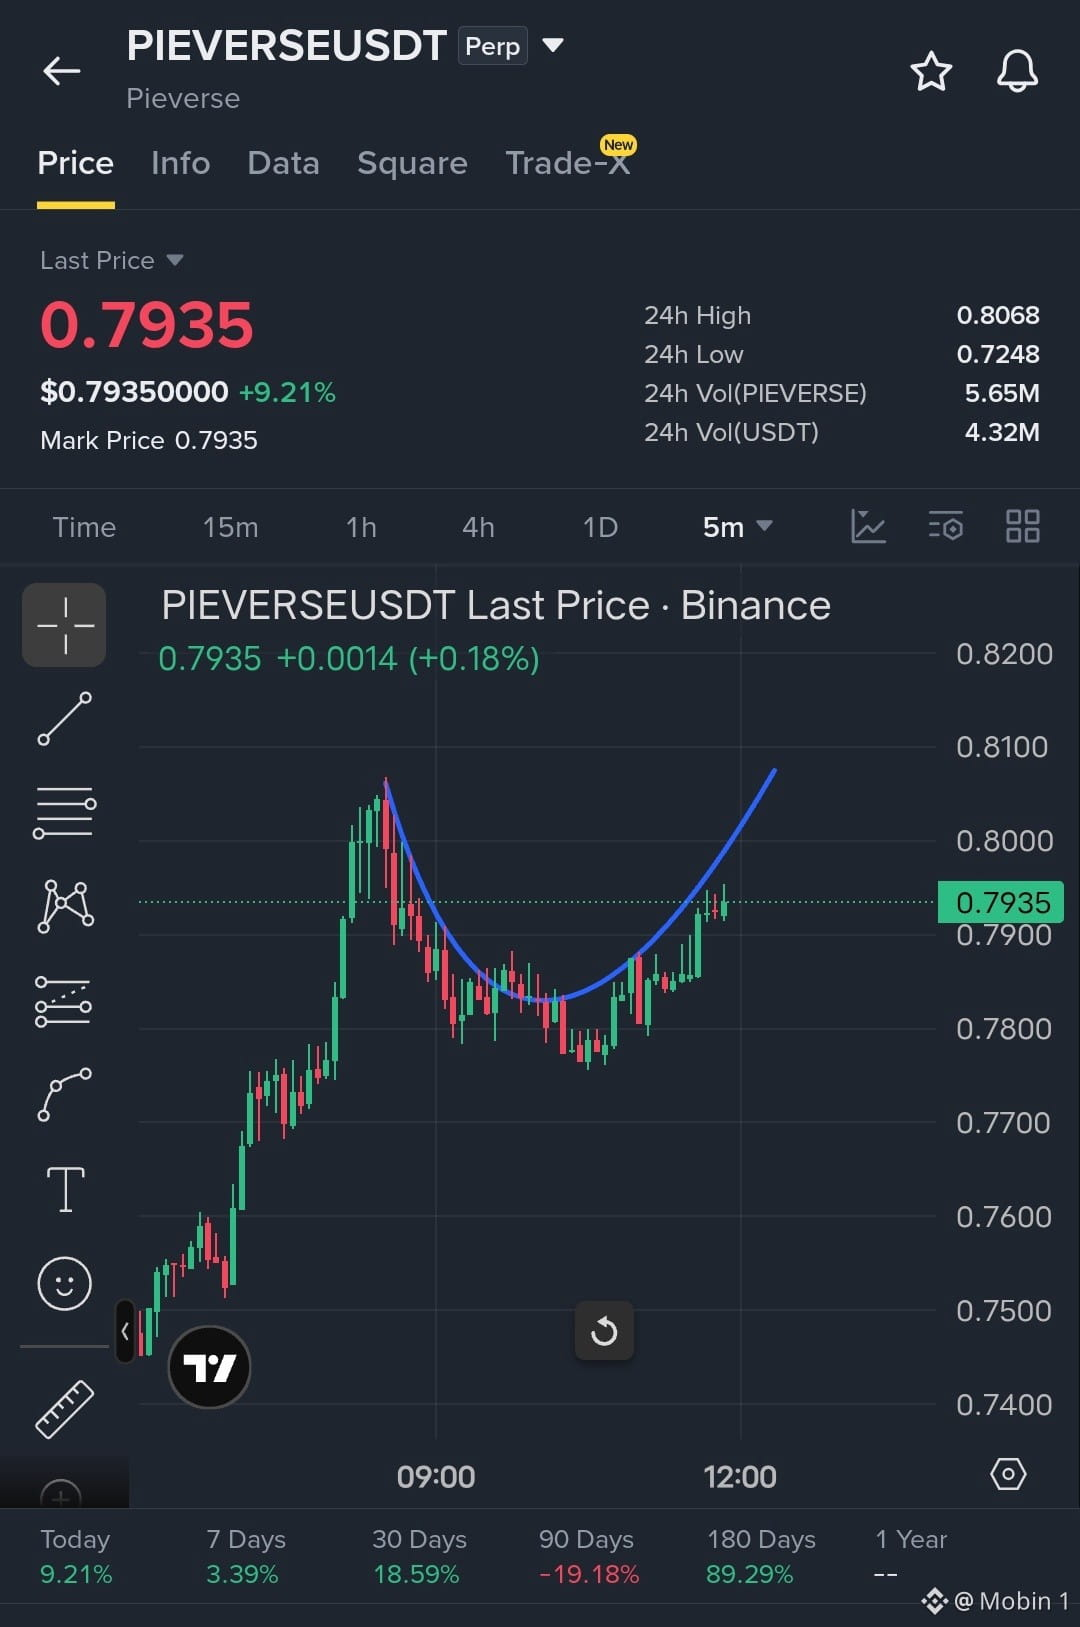
$PIEVERSE Trade haussier mais risqué
Entrée sûre :
Objectif 🎯 : 0,8100 $
Stop loss : 0,7840
{future}(PIEVERSEUSDT)
$PIEVERSE Trade haussier mais risqué
Entrée sûre :
Objectif 🎯 : 0,8100 $
Stop loss : 0,7840
Entrée sûre :
Objectif 🎯 : 0,8100 $
Stop loss : 0,7840
86
·
--
Haussier
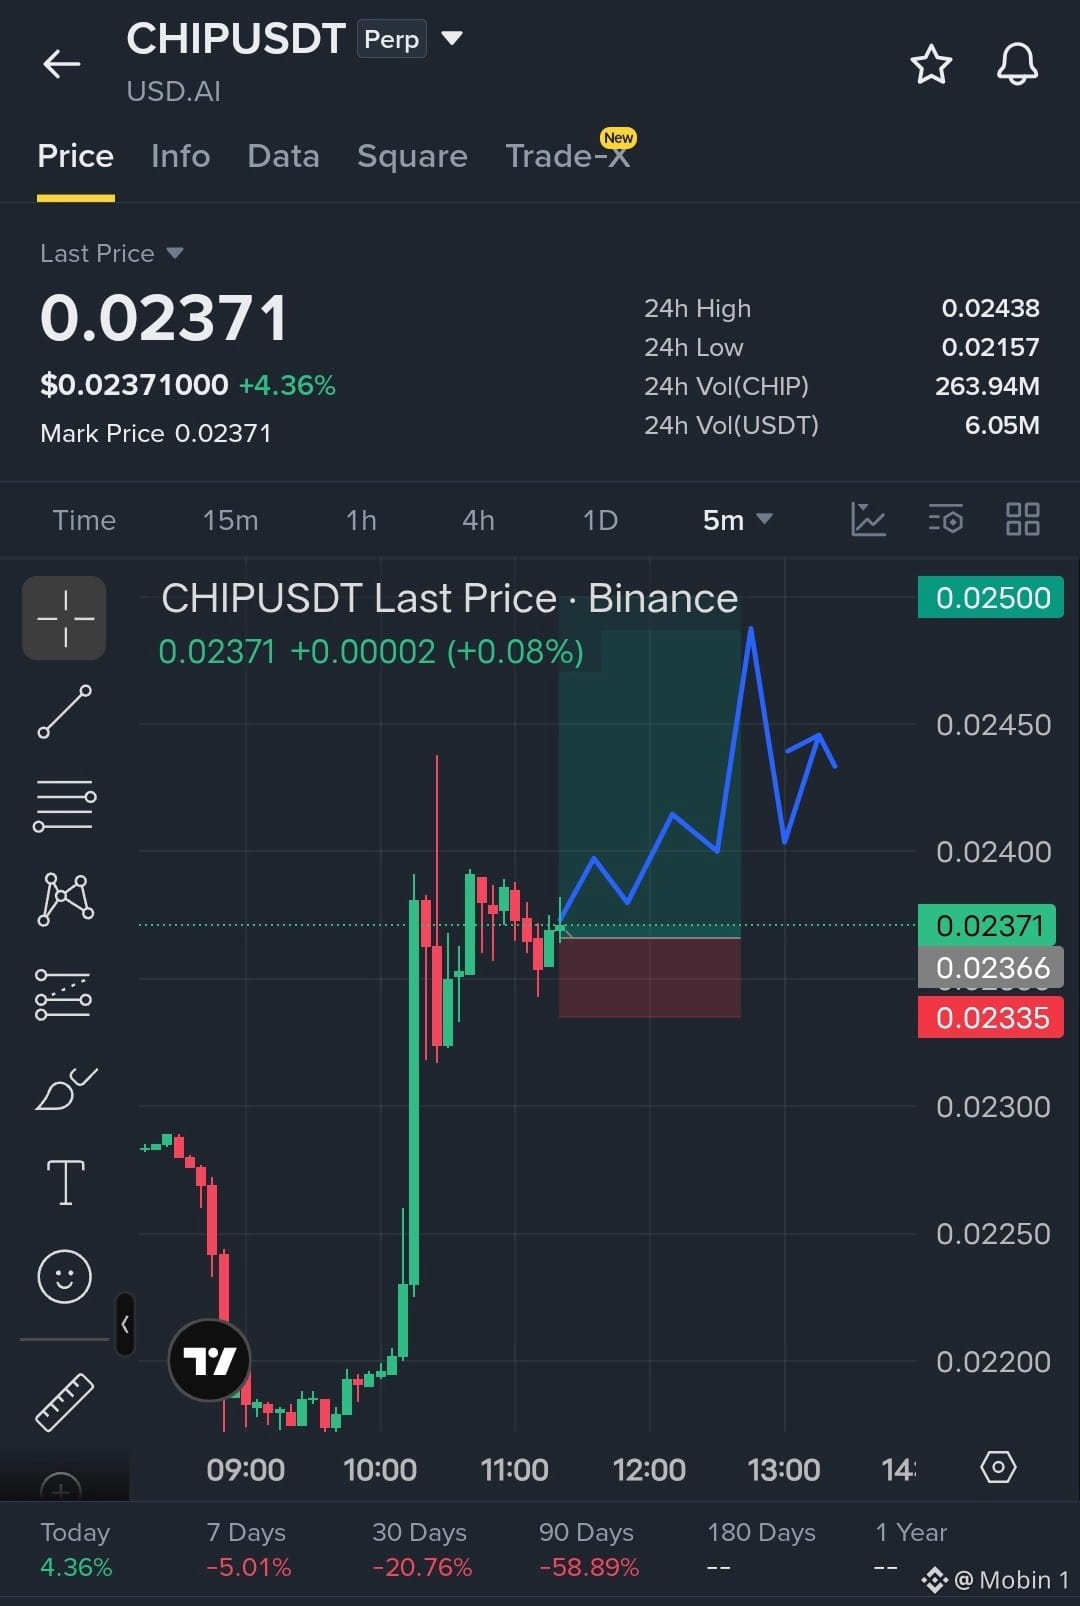
$CHIP Trade haussier
Entrée d’achat : 0,02366 $ -- 0,02371 $
Objectif 🎯 : 0,02450 $
Objectif 🎯 : 0,02500 $
Stoploss : 0,02335 $
{future}(CHIPUSDT)
$CHIP Trade haussier
Entrée d’achat : 0,02366 $ -- 0,02371 $
Objectif 🎯 : 0,02450 $
Objectif 🎯 : 0,02500 $
Stoploss : 0,02335 $
Entrée d’achat : 0,02366 $ -- 0,02371 $
Objectif 🎯 : 0,02450 $
Objectif 🎯 : 0,02500 $
Stoploss : 0,02335 $
1
319
·
--
Baissier
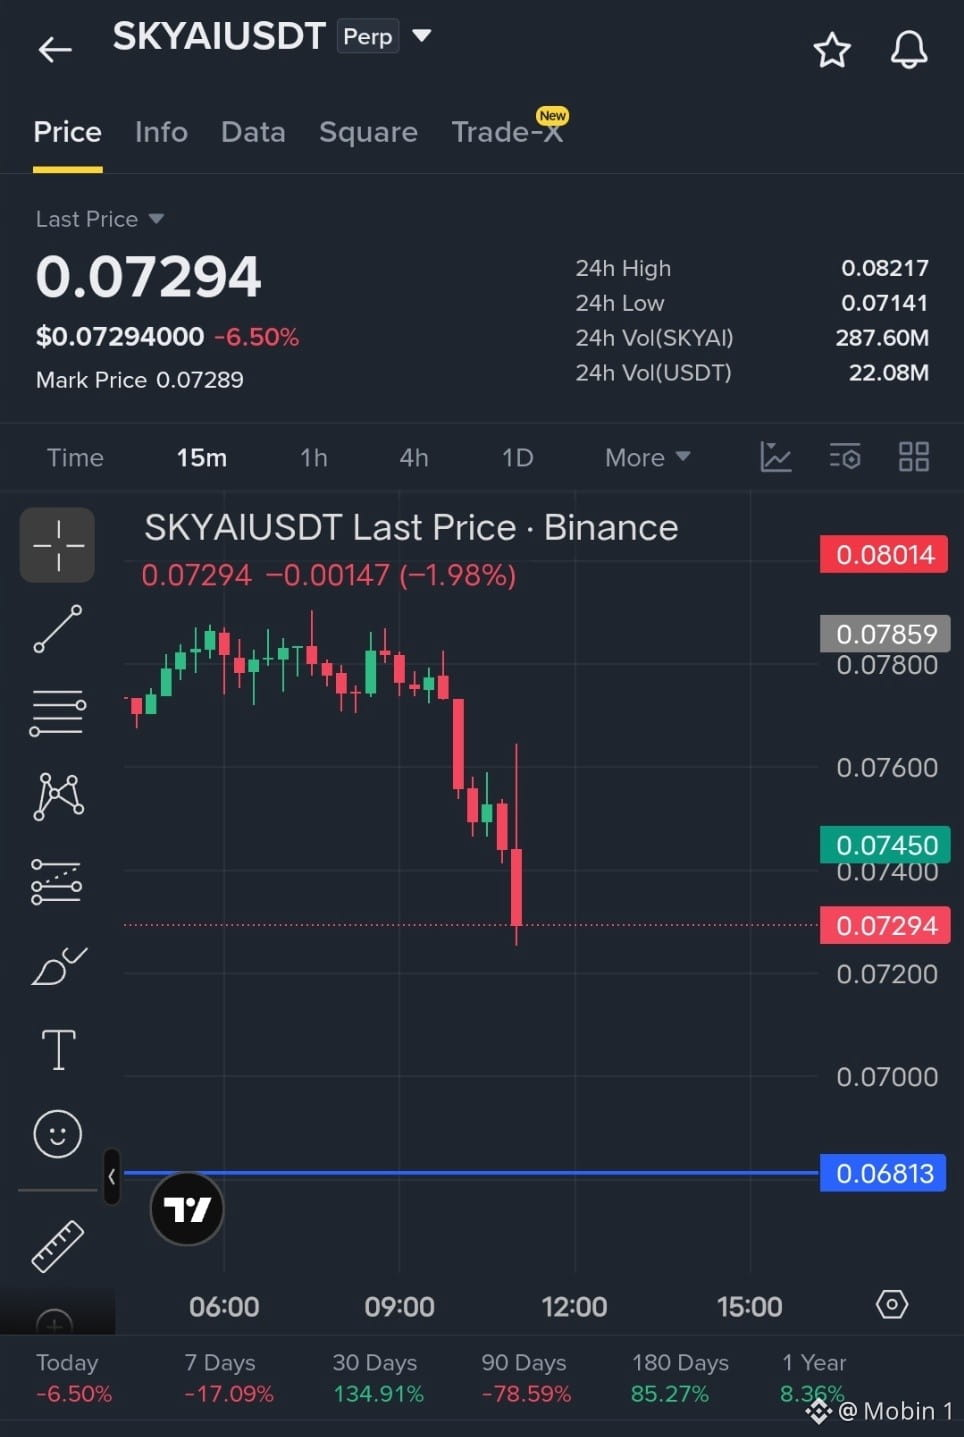
$SKYAI 🐻 Vente à découvert - transaction
Entrée : Sécurisé 0.07300
Stoploss :
Objectif 🎯 0.07000
Objectif 🎯 : 0.06813
{future}(SKYAIUSDT)
$SKYAI 🐻 Vente à découvert - transaction
Entrée : Sécurisé 0.07300
Stoploss :
Objectif 🎯 0.07000
Objectif 🎯 : 0.06813
Entrée : Sécurisé 0.07300
Stoploss :
Objectif 🎯 0.07000
Objectif 🎯 : 0.06813
292
·
--
Baissier
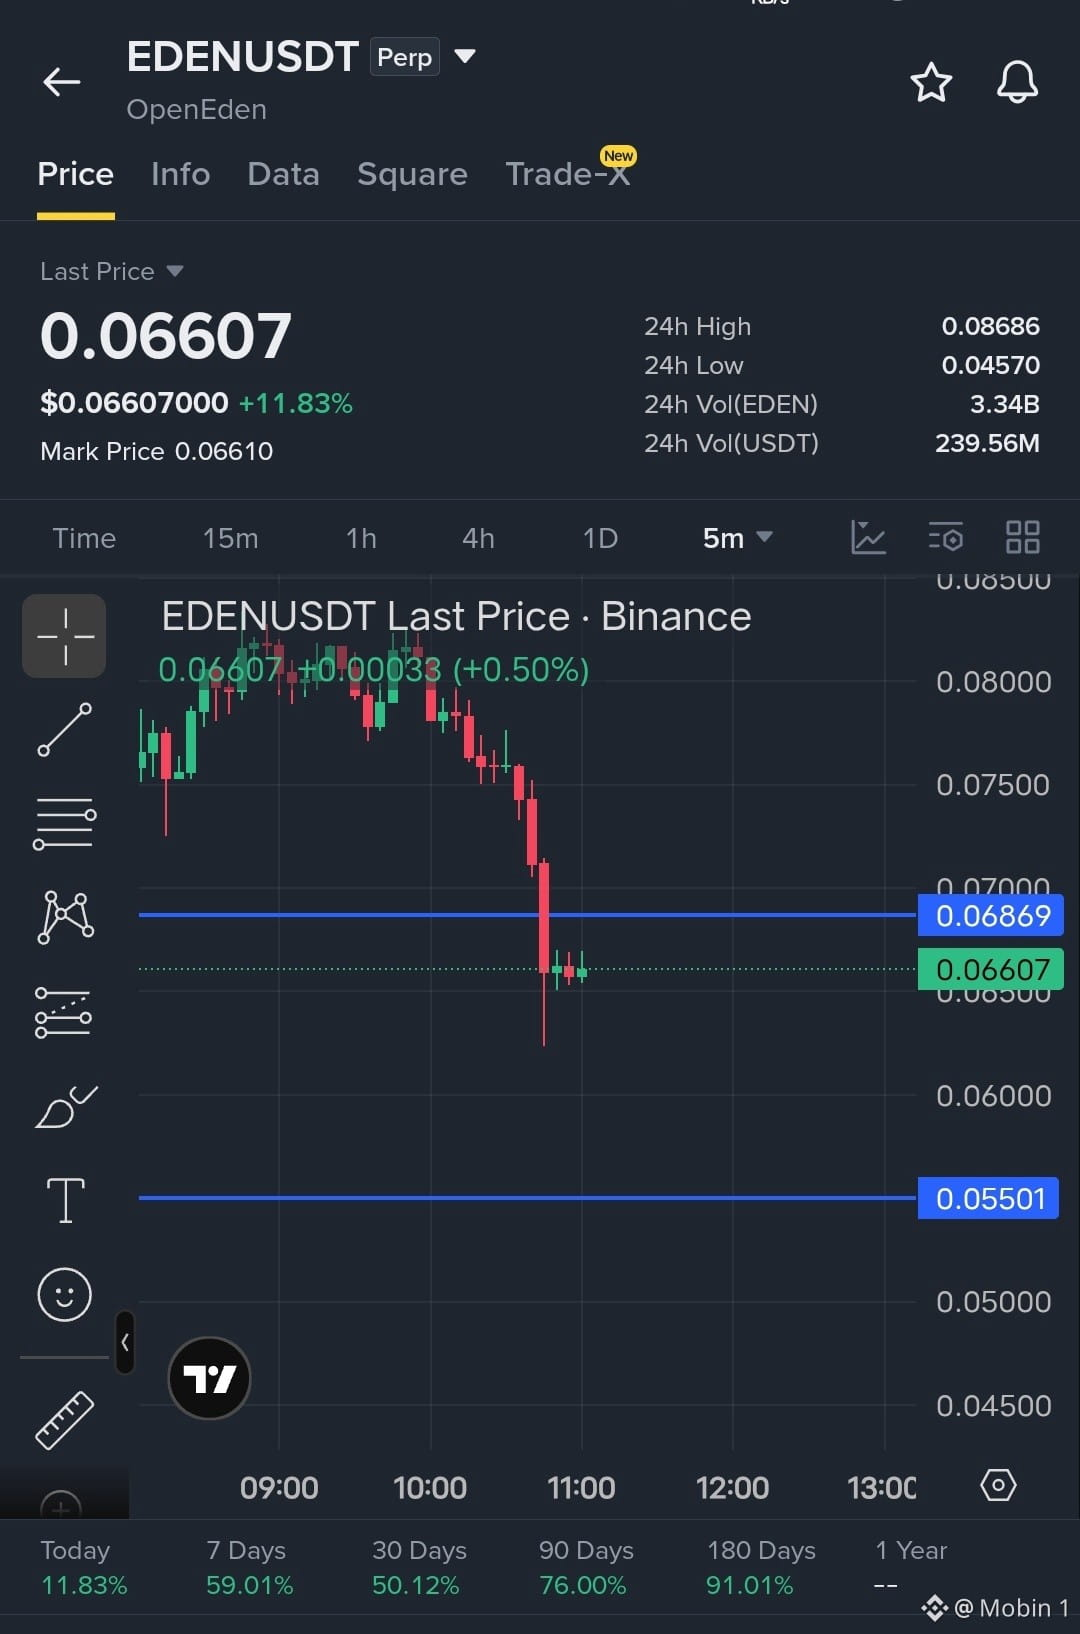
$EDEN Forte 🐻 Vente à découvert courte
Zone d’entrée sûre : 0.06607
Stoploss : 0.06865
Objectif : 🎯 0.5500
{future}(EDENUSDT)
$EDEN Forte 🐻 Vente à découvert courte
Zone d’entrée sûre : 0.06607
Stoploss : 0.06865
Objectif : 🎯 0.5500
Zone d’entrée sûre : 0.06607
Stoploss : 0.06865
Objectif : 🎯 0.5500
56
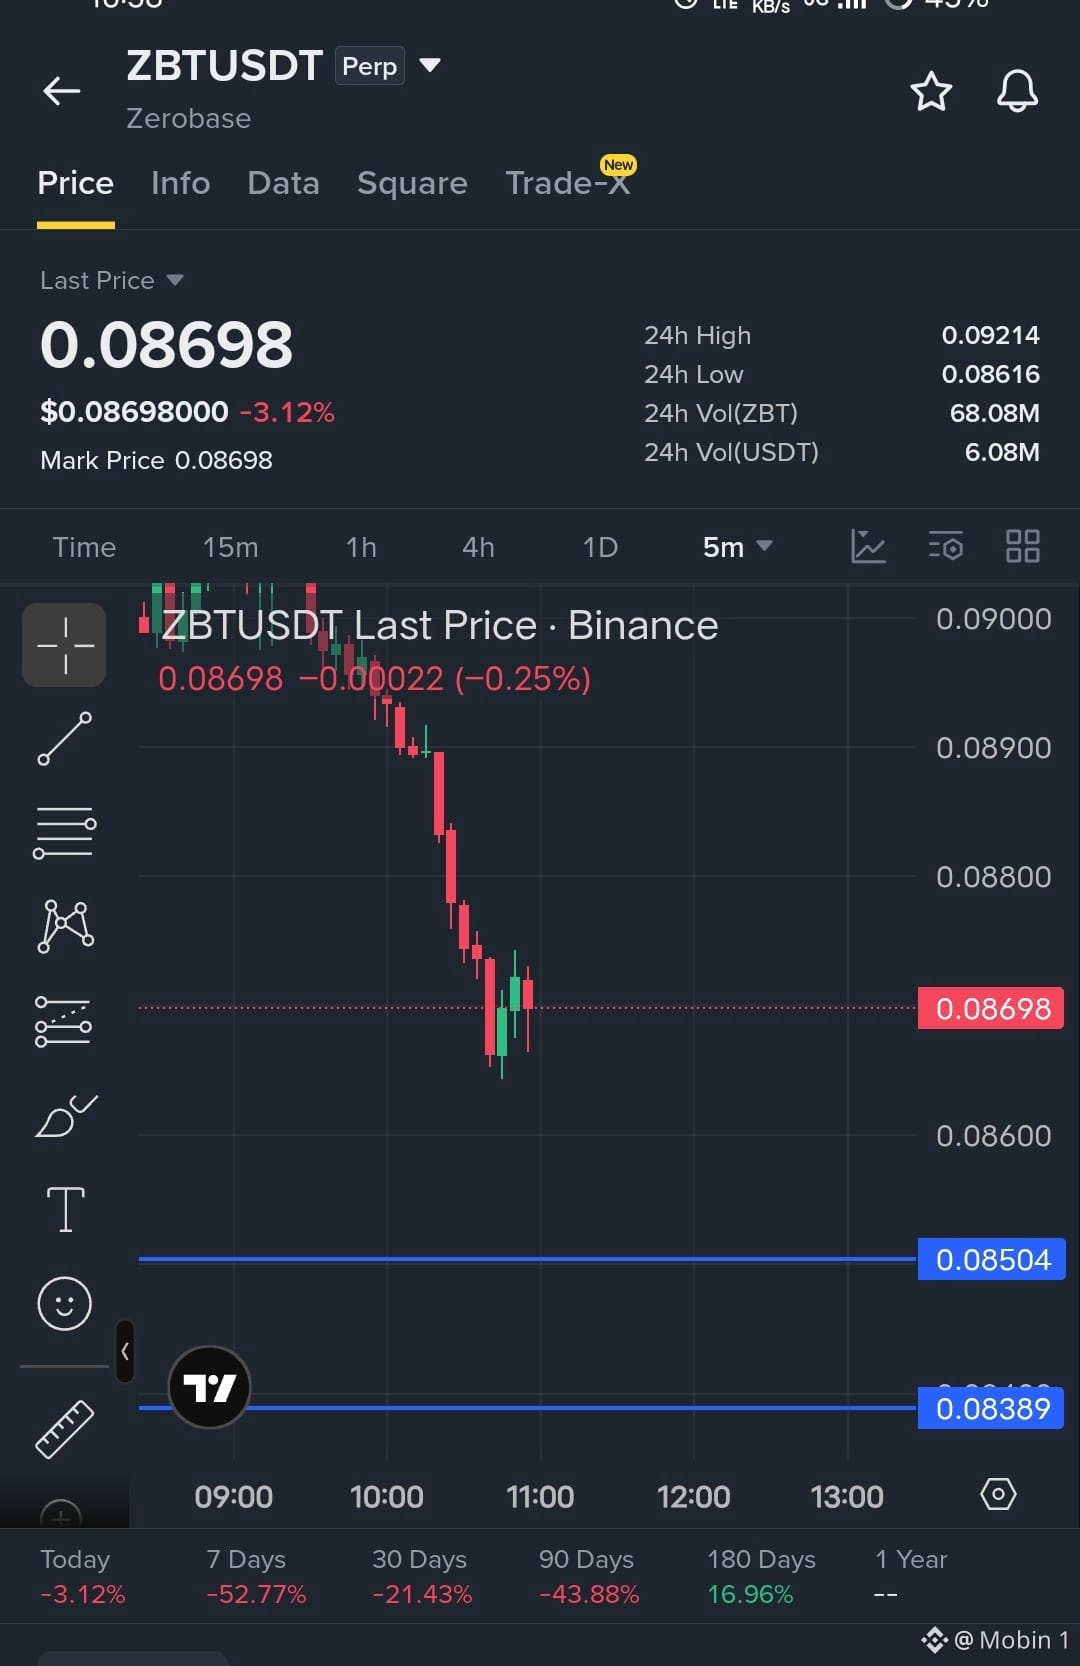
$ZBT Strot Sell
Entrée : 0.08698
Objectif : 🎯 0.08504 -- 🎯0.08390
Stoploss : 0.08740
{future}(ZBTUSDT)
$ZBT Strot Sell
Entrée : 0.08698
Objectif : 🎯 0.08504 -- 🎯0.08390
Stoploss : 0.08740
Entrée : 0.08698
Objectif : 🎯 0.08504 -- 🎯0.08390
Stoploss : 0.08740
207
·
--
Baissier
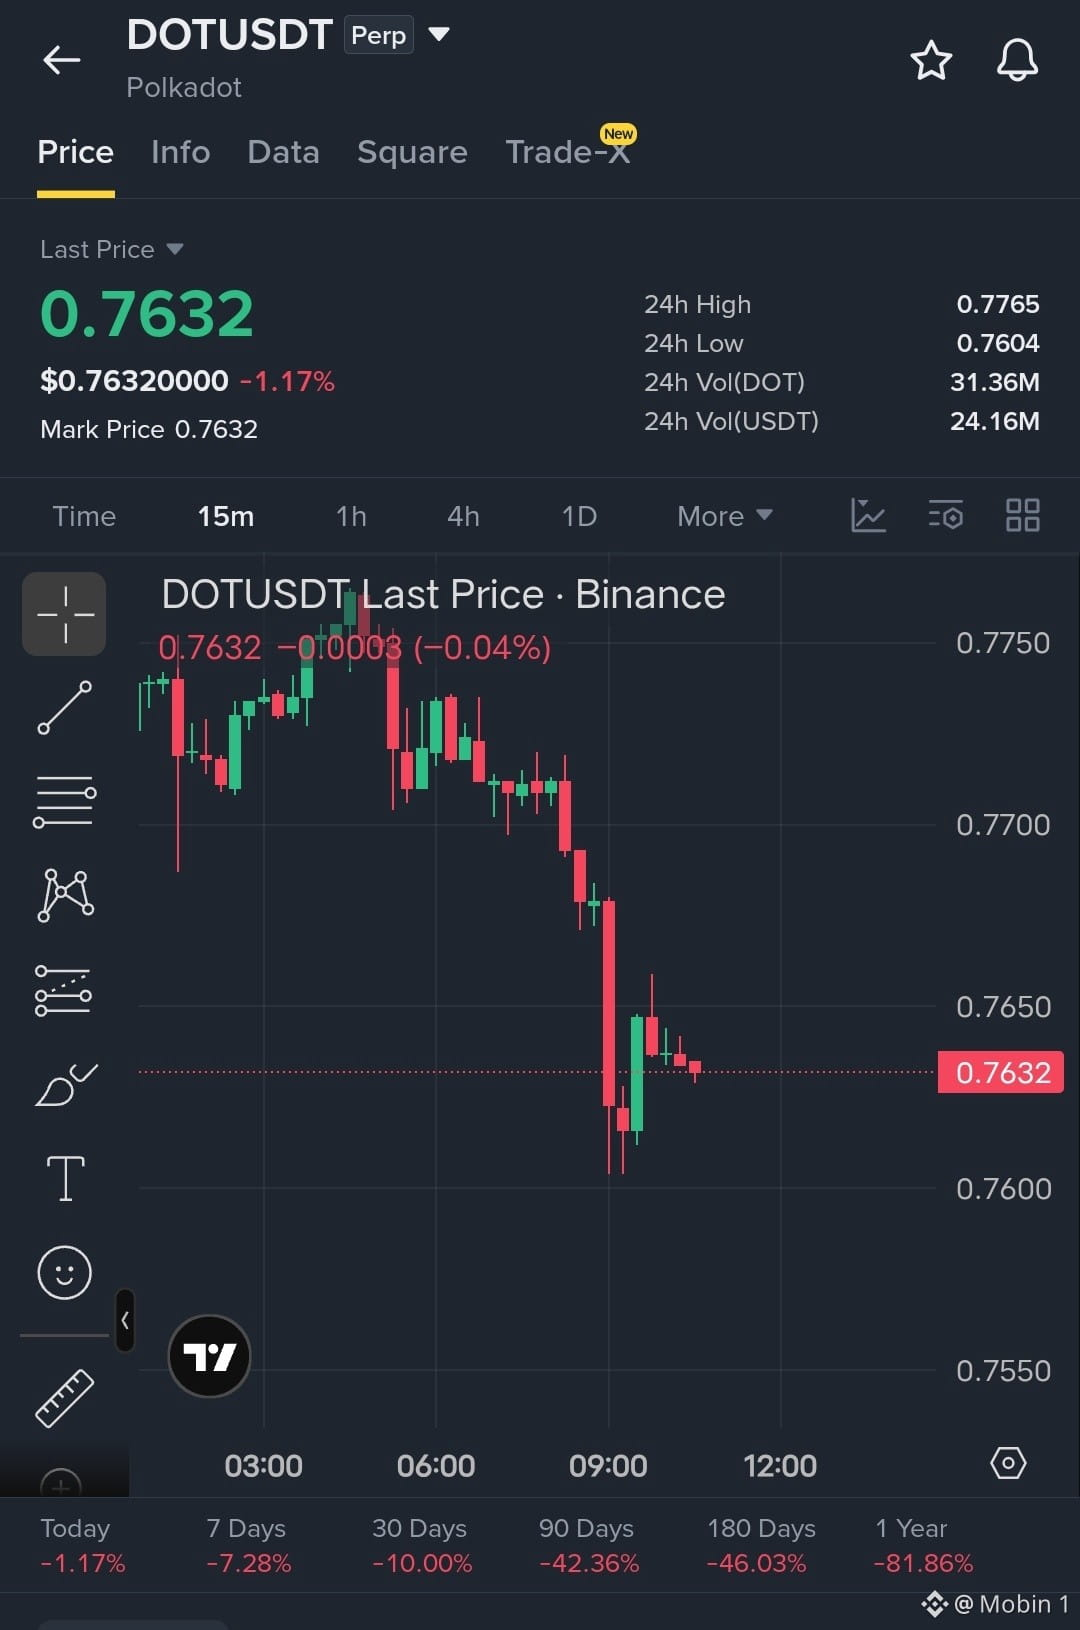
$DOT Short Sell Trade
Entrée : 0.7650 -- 0.7630
Objectif 🎯 0.7550
Stoploss : 0.7670 - 0.7680
{future}(DOTUSDT)
$DOT Short Sell Trade
Entrée : 0.7650 -- 0.7630
Objectif 🎯 0.7550
Stoploss : 0.7670 - 0.7680
Entrée : 0.7650 -- 0.7630
Objectif 🎯 0.7550
Stoploss : 0.7670 - 0.7680
119
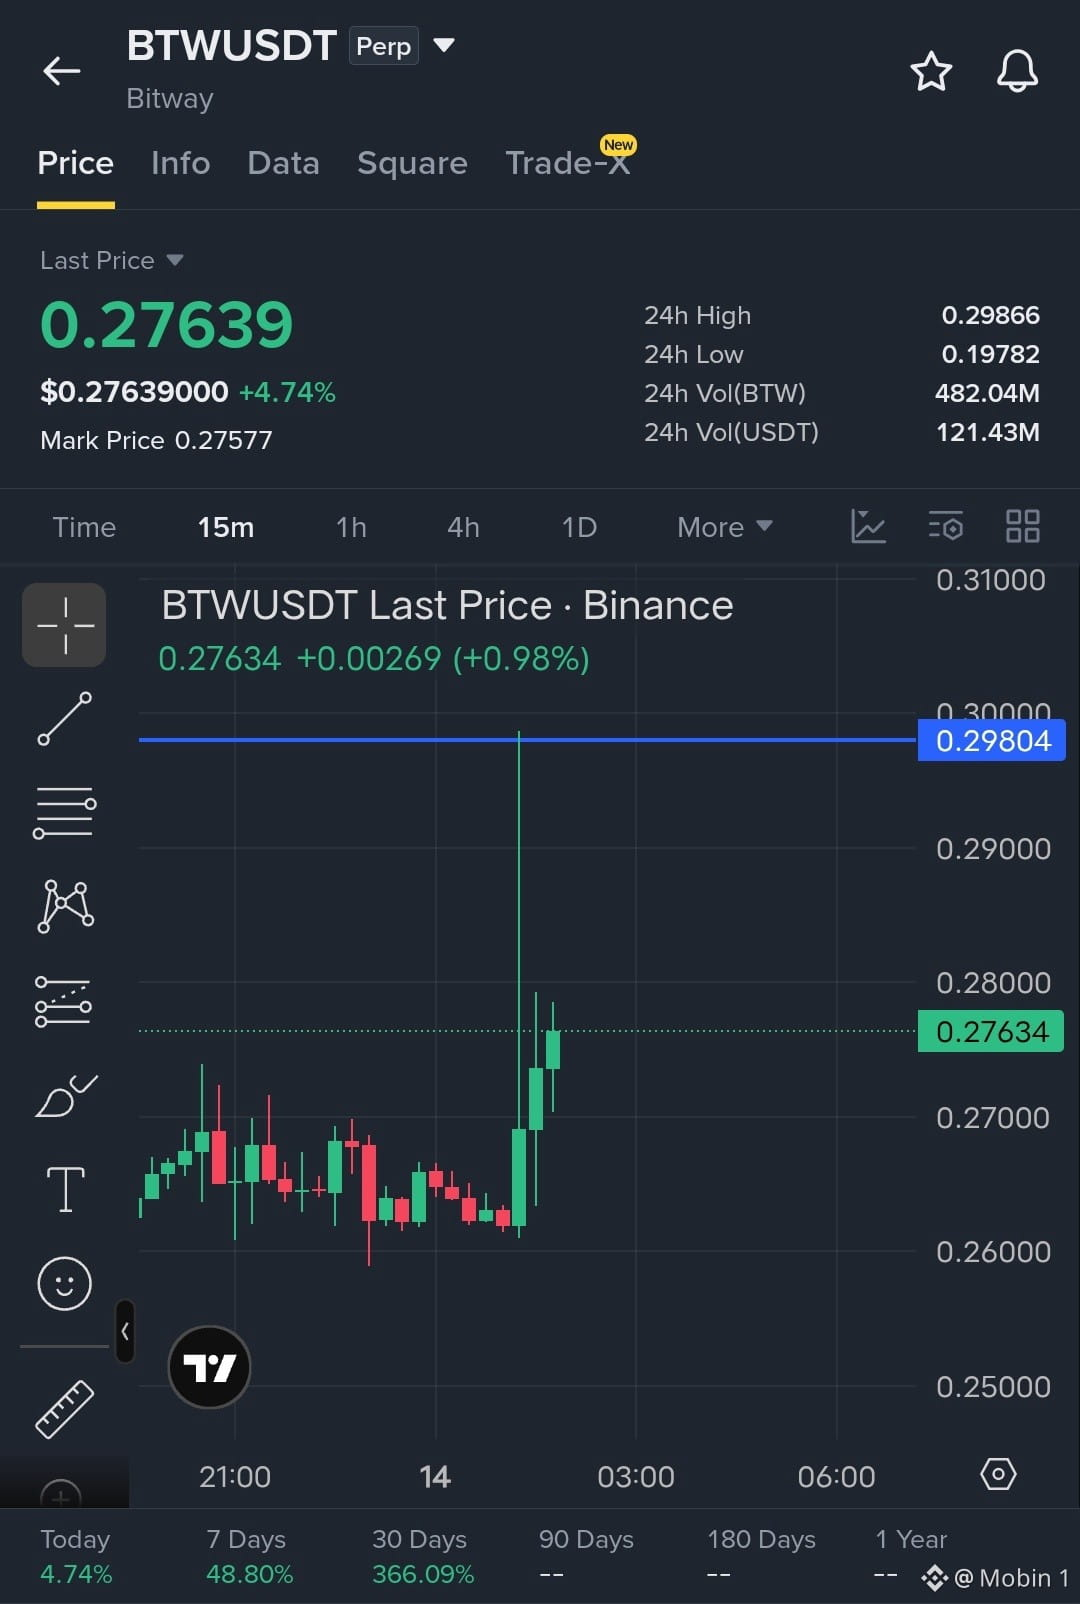
$BTW Modèle haussier fort
Entrée en sécurité à l’achat :
Objectif 🎯 : 0.29804
Stoploss : 0.27000
{future}(BTWUSDT)
$BTW Modèle haussier fort
Entrée en sécurité à l’achat :
Objectif 🎯 : 0.29804
Stoploss : 0.27000
Entrée en sécurité à l’achat :
Objectif 🎯 : 0.29804
Stoploss : 0.27000
277
·
--
Haussier
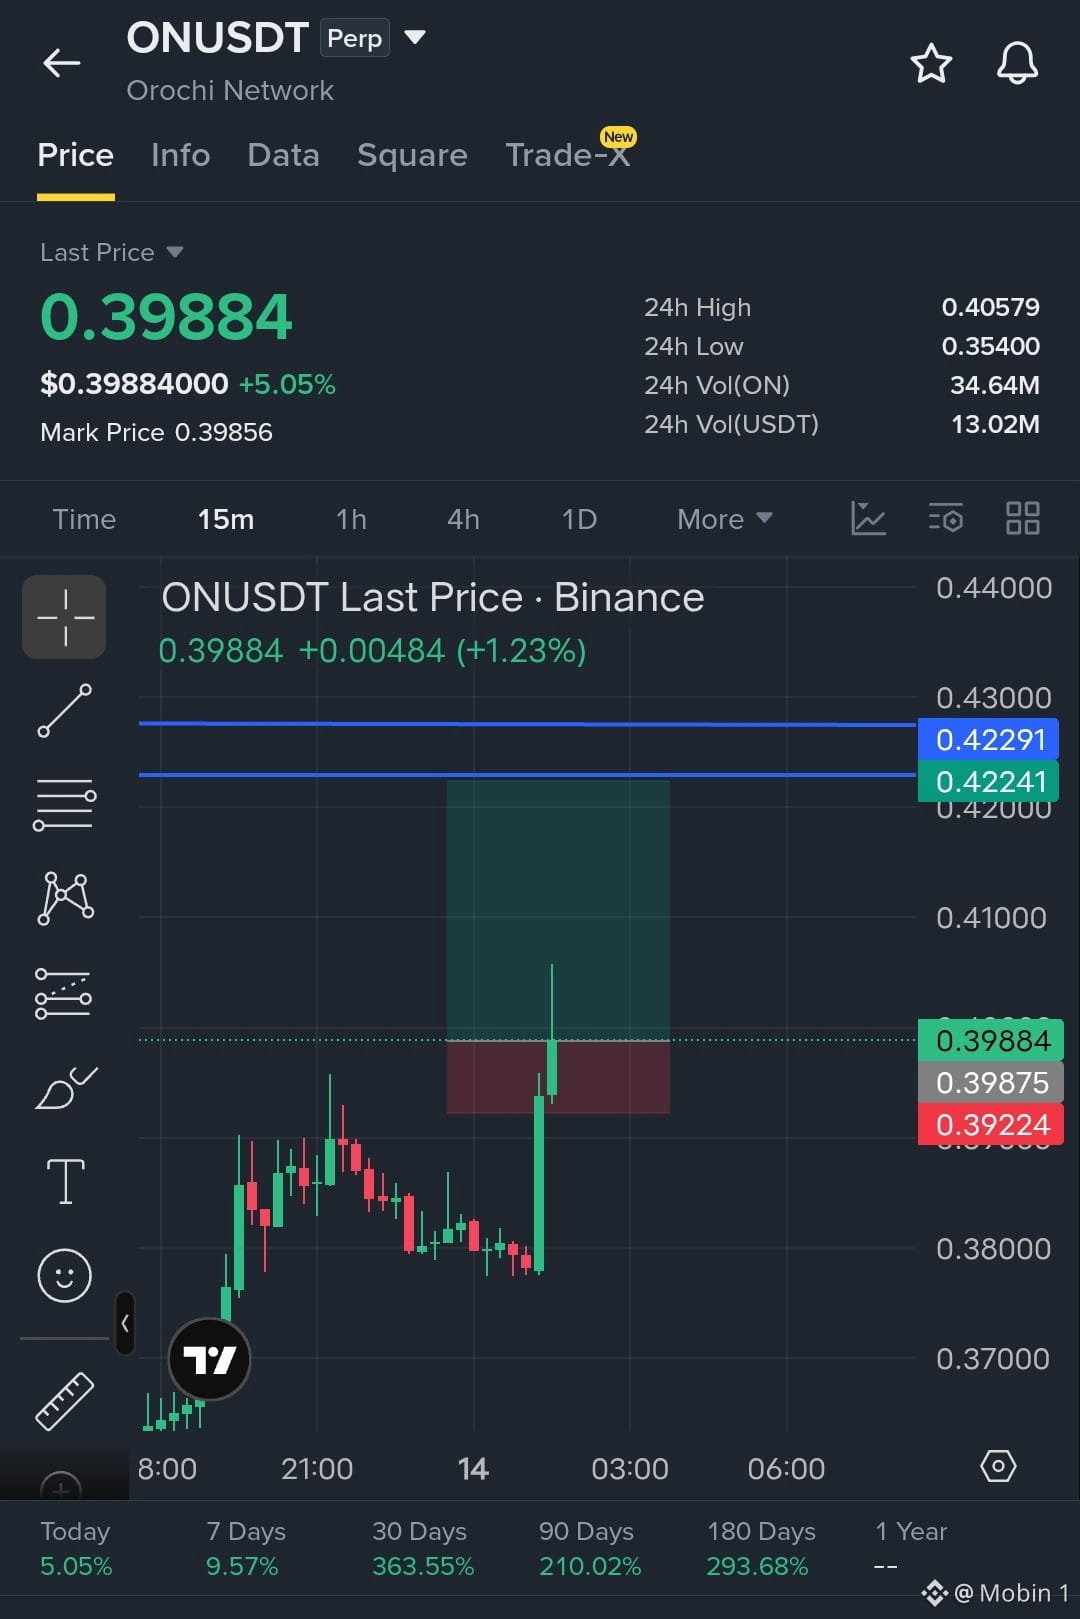
$ON Trade haussier
Entrée à l'achat :
Objectif : 0.42241
Stoploss : 39224
{future}(ONUSDT)
$ON Trade haussier
Entrée à l'achat :
Objectif : 0.42241
Stoploss : 39224
Entrée à l'achat :
Objectif : 0.42241
Stoploss : 39224
1
232
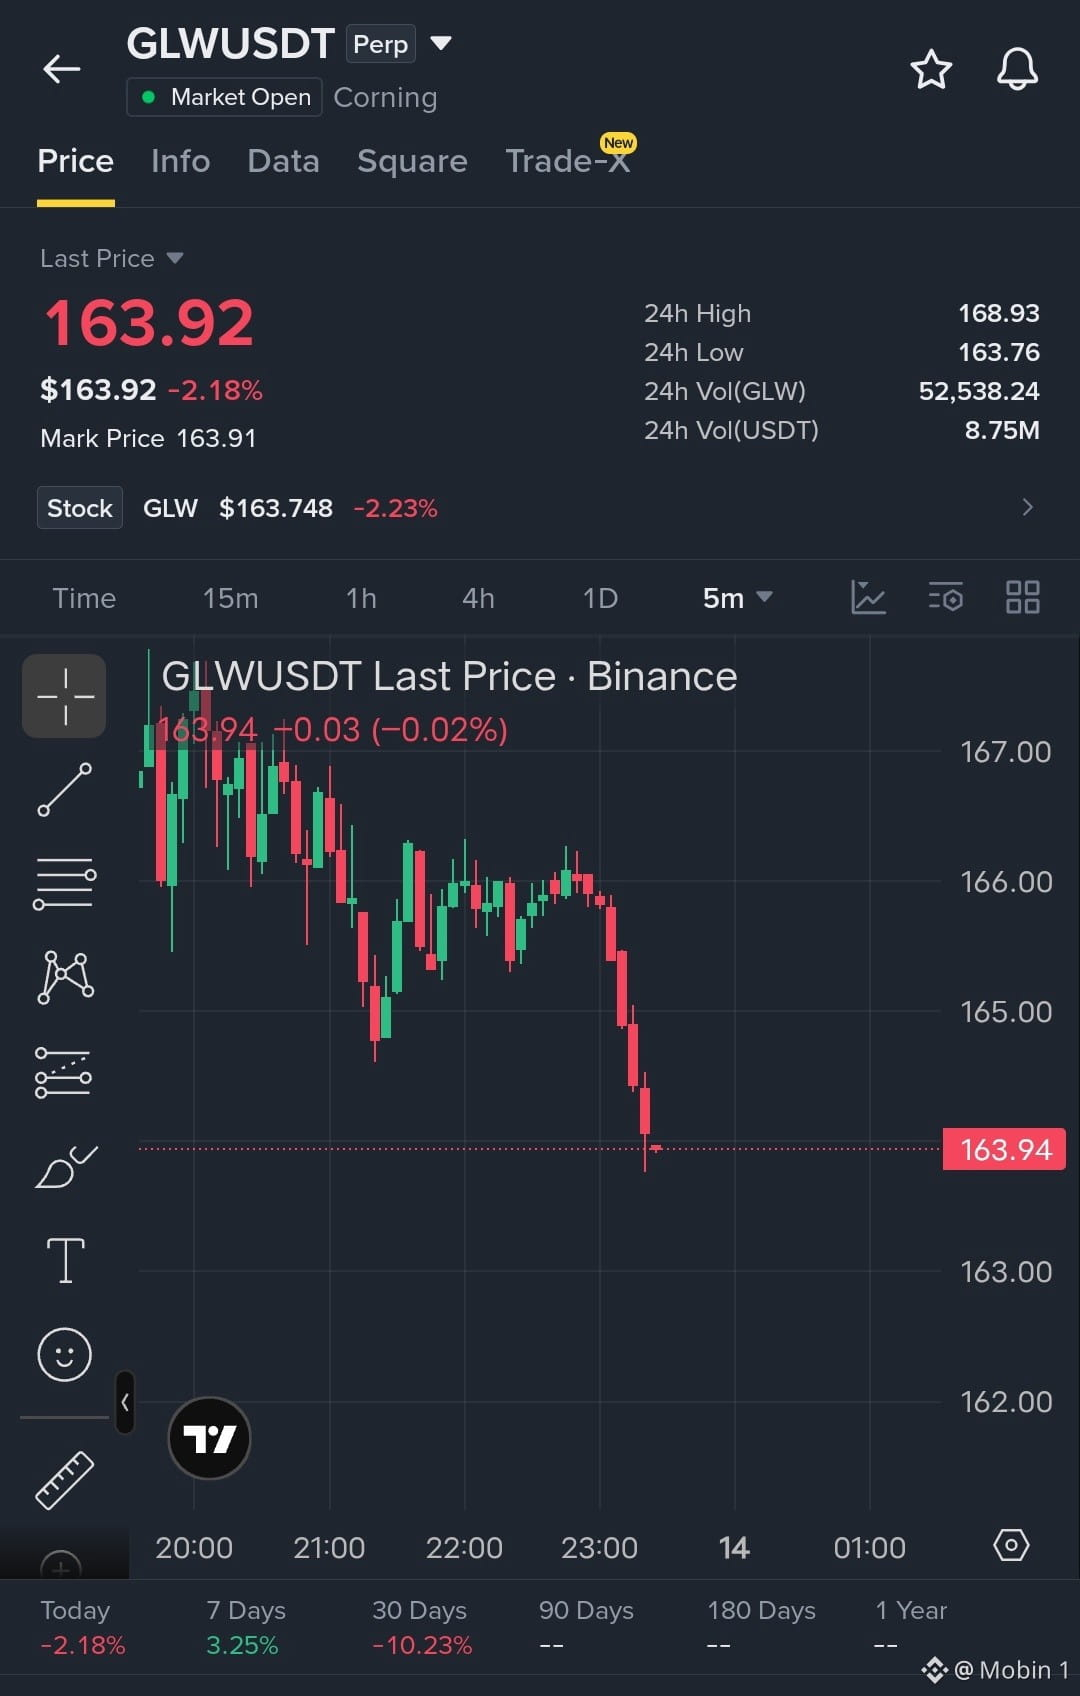
$GLW short Trade
Entrez dans une vente à découvert Objectif 🎯 163 - 🎯163.50
{future}(GLWUSDT)
$GLW short Trade
Entrez dans une vente à découvert Objectif 🎯 163 - 🎯163.50
Entrez dans une vente à découvert Objectif 🎯 163 - 🎯163.50
70
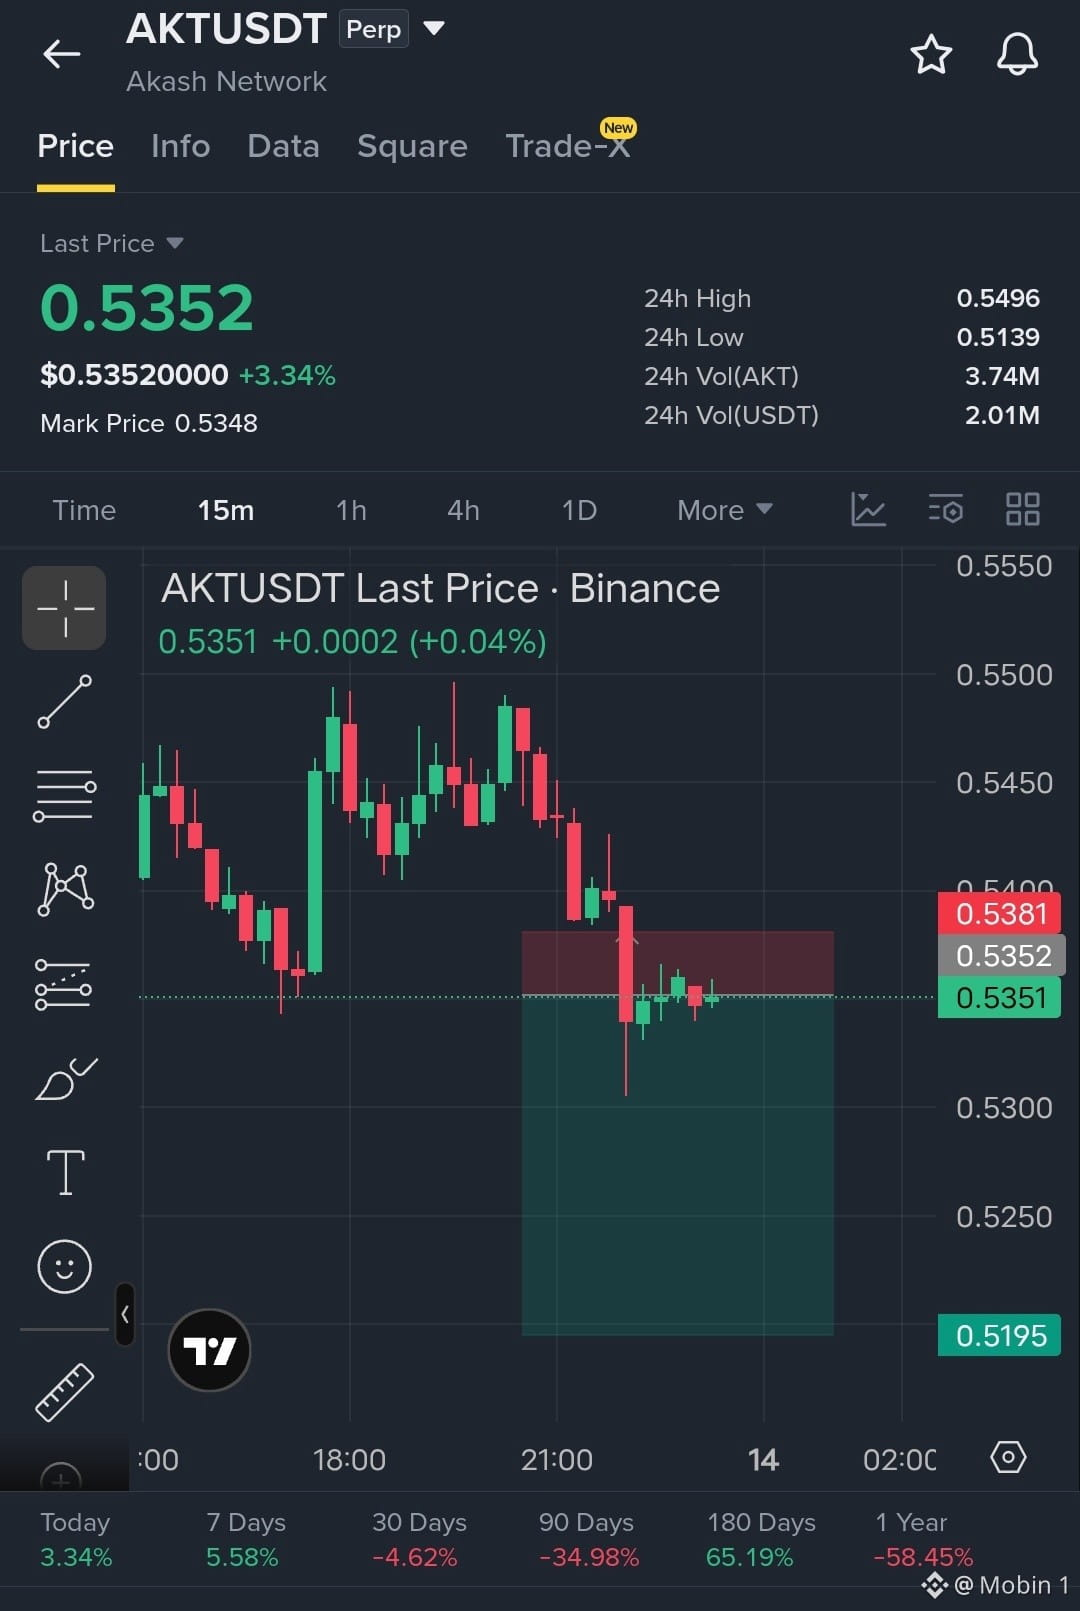
$AKT Short Sell Trade
Entrée :
Objectif : 🎯 0.5250 - 🎯 0.5195
Stoploss : 🛑 0.5381
{future}(AKTUSDT)
$AKT Short Sell Trade
Entrée :
Objectif : 🎯 0.5250 - 🎯 0.5195
Stoploss : 🛑 0.5381
Entrée :
Objectif : 🎯 0.5250 - 🎯 0.5195
Stoploss : 🛑 0.5381
16
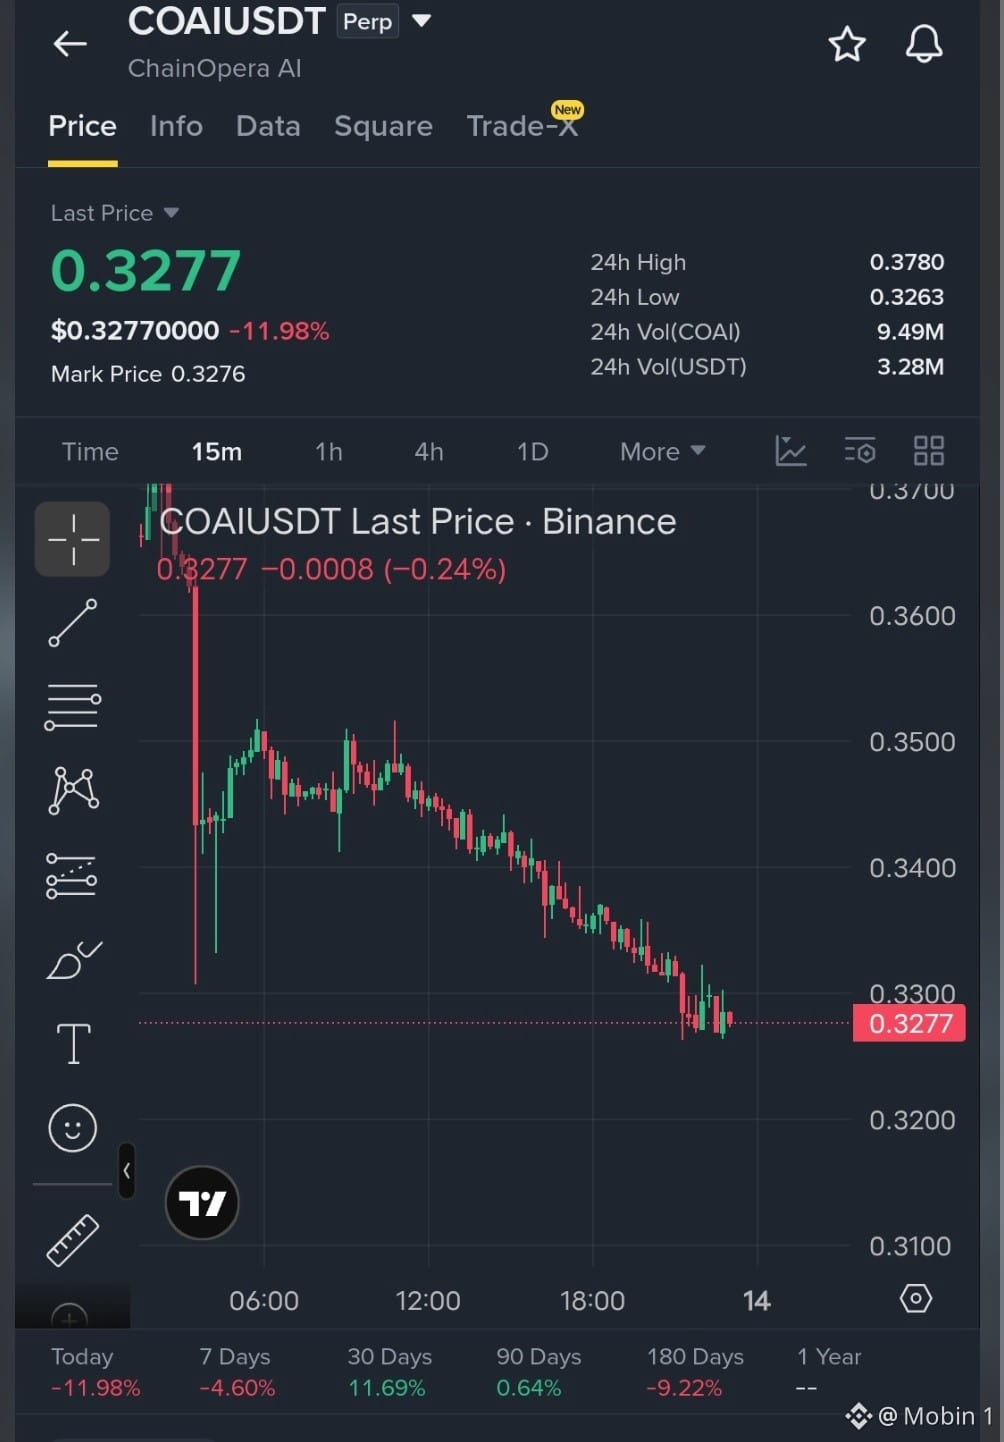
$COAI Strong short trade
Entrez en vente à découvert (Short Sell) en toute sécurité
Objectif 1 : 0.3200
Objectif 2 : 0.3100
Définir le Stop Loss : 0.3350
$COAI Strong short trade
Entrez en vente à découvert (Short Sell) en toute sécurité
Objectif 1 : 0.3200
Objectif 2 : 0.3100
Définir le Stop Loss : 0.3350
Entrez en vente à découvert (Short Sell) en toute sécurité
Objectif 1 : 0.3200
Objectif 2 : 0.3100
Définir le Stop Loss : 0.3350
260
·
--
Baissier
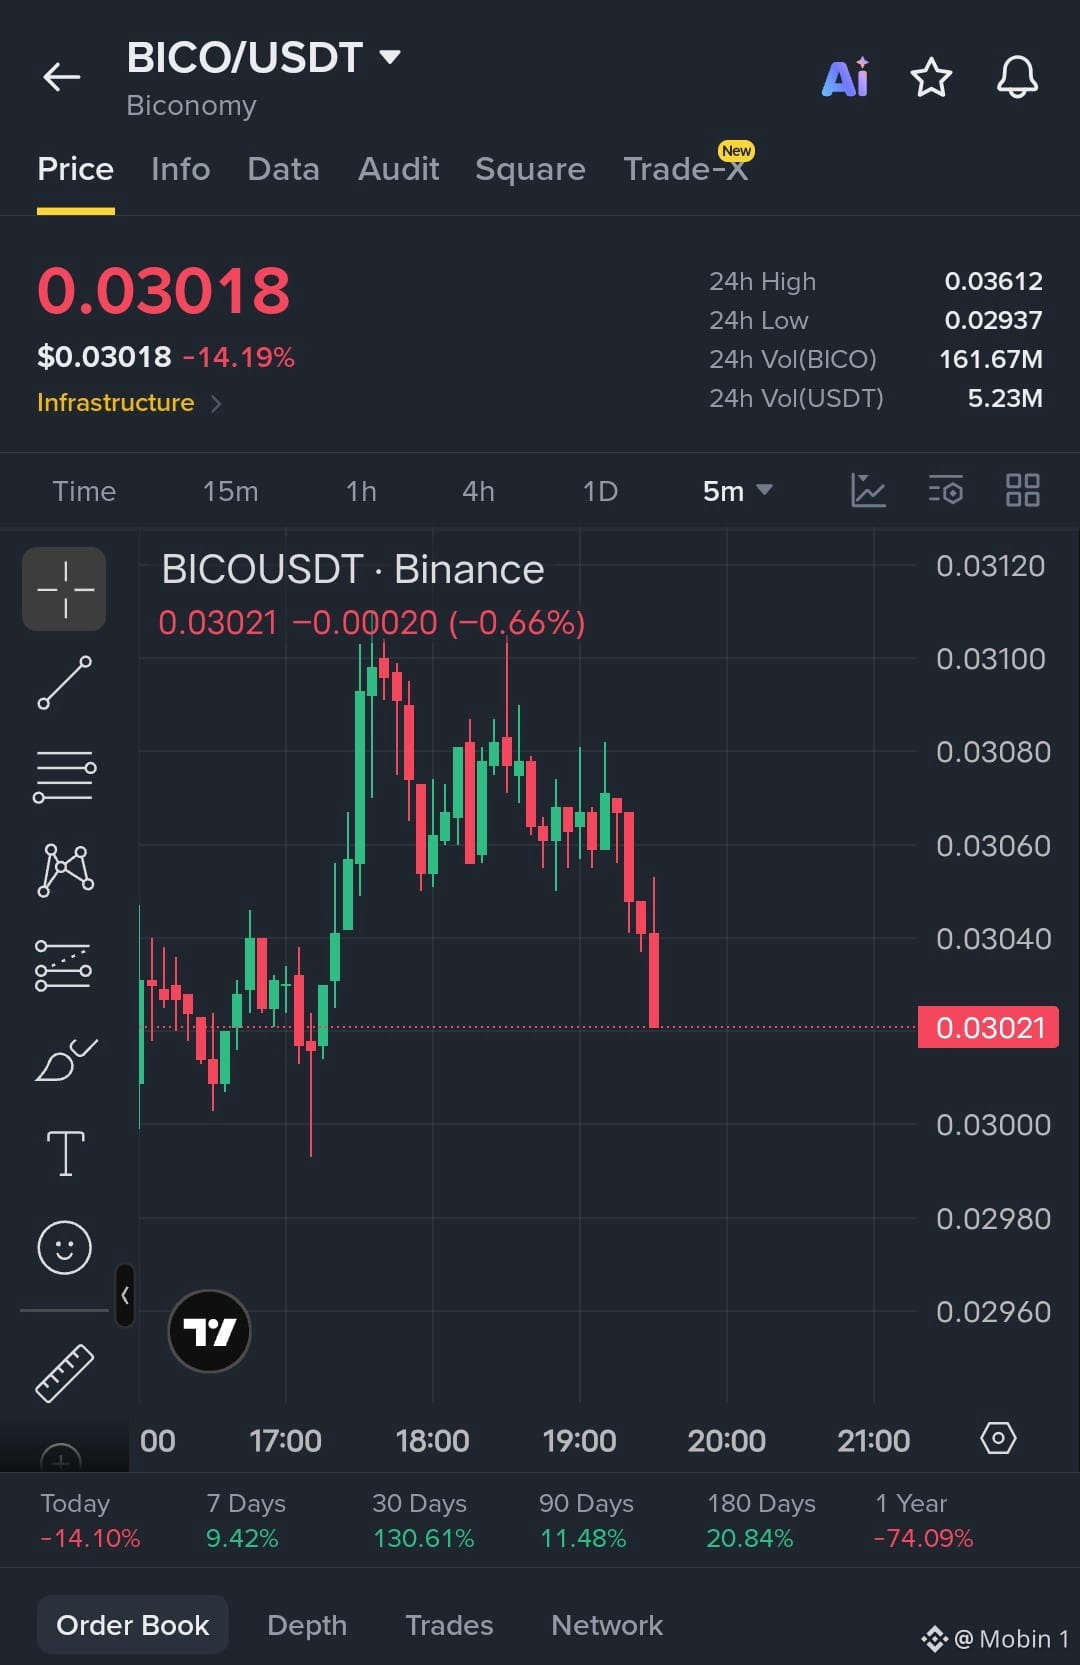
$BICO Strong Selling
Short this trade
Entry : 0.03040
Target : 0.02960
{future}(BICOUSDT)
$BICO Strong Selling
Short this trade
Entry : 0.03040
Target : 0.02960
Short this trade
Entry : 0.03040
Target : 0.02960
81
·
--
Baissier
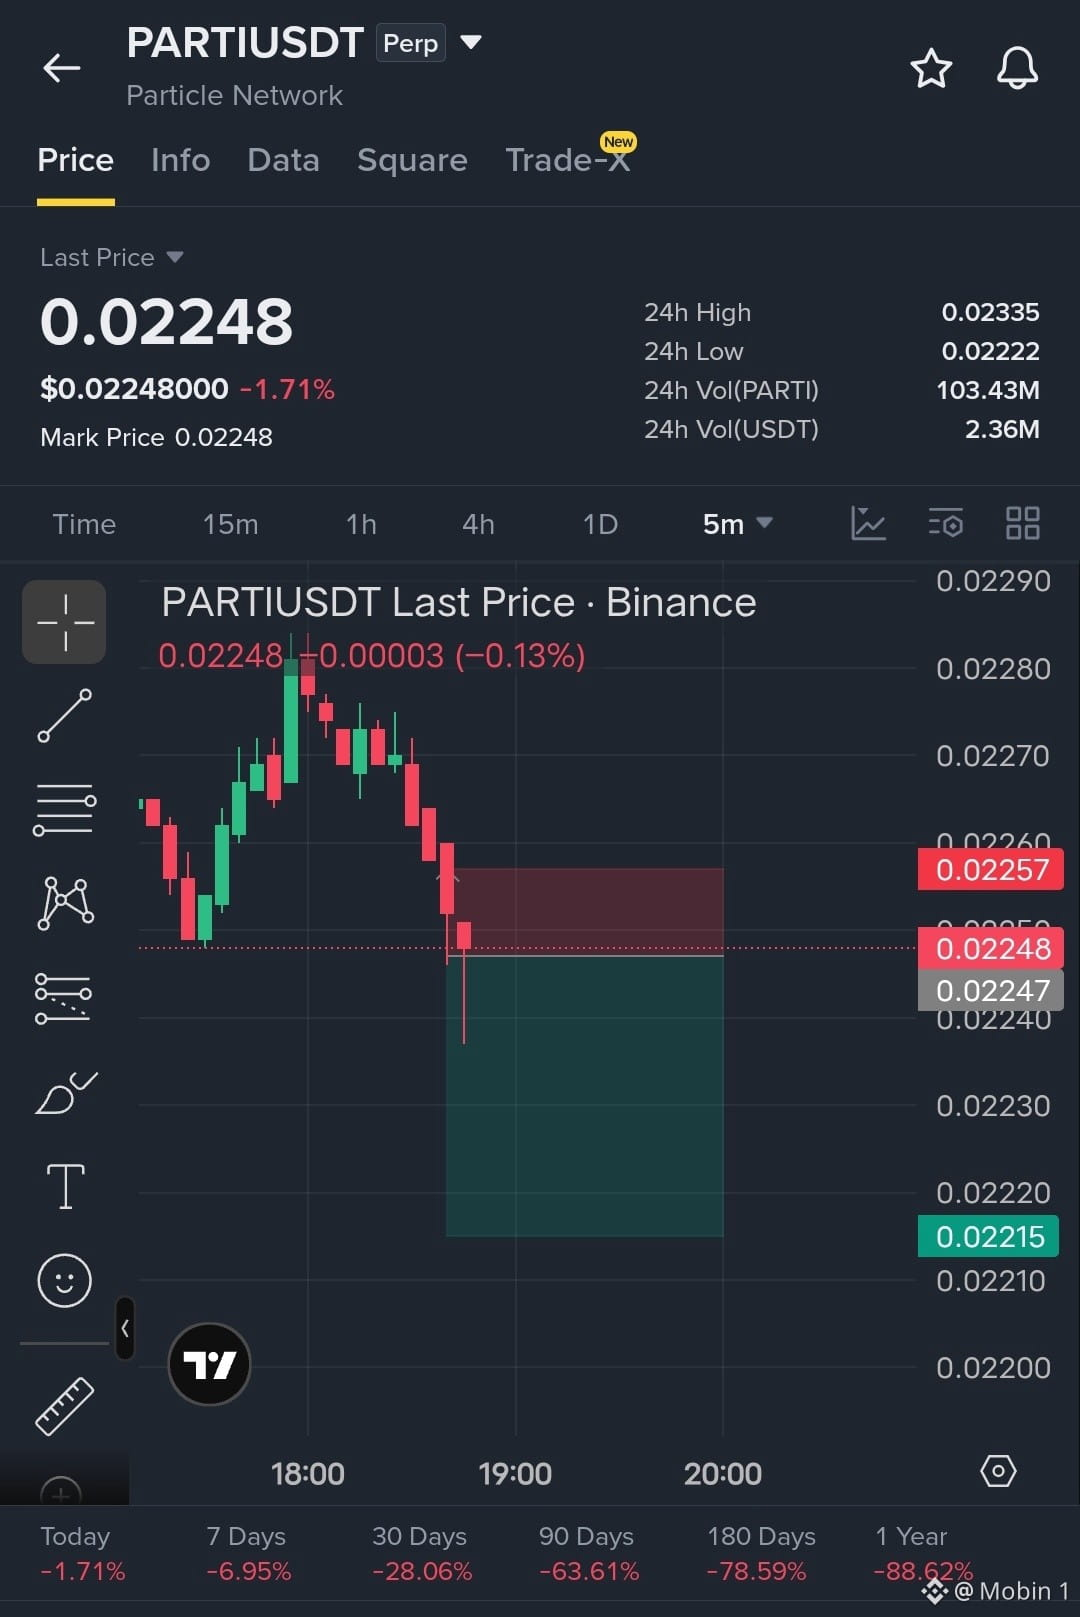
$PARTI Short Sell Trade
Objectif : 🎯 0.02215 - 0.02200
Stoploss : 0.02257
{future}(PARTIUSDT)
$PARTI Short Sell Trade
Objectif : 🎯 0.02215 - 0.02200
Stoploss : 0.02257
Objectif : 🎯 0.02215 - 0.02200
Stoploss : 0.02257
423
Connectez-vous pour découvrir plus de contenu
Rejoignez la communauté mondiale des adeptes de cryptomonnaies sur Binance Square
⚡️ Suviez les dernières informations importantes sur les cryptomonnaies.
💬 Jugé digne de confiance par la plus grande plateforme d’échange de cryptomonnaies au monde.
👍 Découvrez les connaissances que partagent les créateurs vérifiés.
Adresse e-mail/Nº de téléphone
Sujets d’actualité
CryptoSelloffTriggersMultipleWhaleLiquidations
222,121 vues
1,950 mentions
Les liquidations crypto dépassent les 2 milliards de dollars en 24 heures, 329 000 traders sont balayés
Binance News
·40 mentions J’aime
·59.6k vues
USSpotXRPETFsSeeLargestWeeklyOutflowIn8Months
186,934 vues
1,638 mentions
WillFOMCMinutesReinforceRateHikeExpectations?
62,792 vues
815 mentions