

M-x-8
1.8k Publications

M-x-8
Signaler
Bloquer l’utilisateur
AI-assisted crypto market research. Key levels, clear scenarios, disciplined risk. Evidence over emotion. Educational only.

Meilleurs traders sur 30 J selon le volume
141 Suivis
1.3K+ Abonnés
1.0K+ J’aime
1 Badges
Publications
Tous
Citations
Vidéos
·
--
Voir la traduction
$TURTLE — the spike has been fully erased.
The 0.0469 low from my last update failed on a closed 15m candle.
19:15 → 20:00 UTC closes:
0.0482 → 0.0424 (-12.03%).
Now below the pre-spike 0.0430 close.
A 15m reclaim of 0.0469 would change this follow-up.
Binance Spot | Oct 5, 2026
$TURTLE — the spike has been fully erased.
The 0.0469 low from my last update failed on a closed 15m candle.
19:15 → 20:00 UTC closes:
0.0482 → 0.0424 (-12.03%).
Now below the pre-spike 0.0430 close.
A 15m reclaim of 0.0469 would change this follow-up.
Binance Spot | Oct 5, 2026
The 0.0469 low from my last update failed on a closed 15m candle.
19:15 → 20:00 UTC closes:
0.0482 → 0.0424 (-12.03%).
Now below the pre-spike 0.0430 close.
A 15m reclaim of 0.0469 would change this follow-up.
Binance Spot | Oct 5, 2026
25
·
--
Voir la traduction
$EDU — the bounce was almost erased.
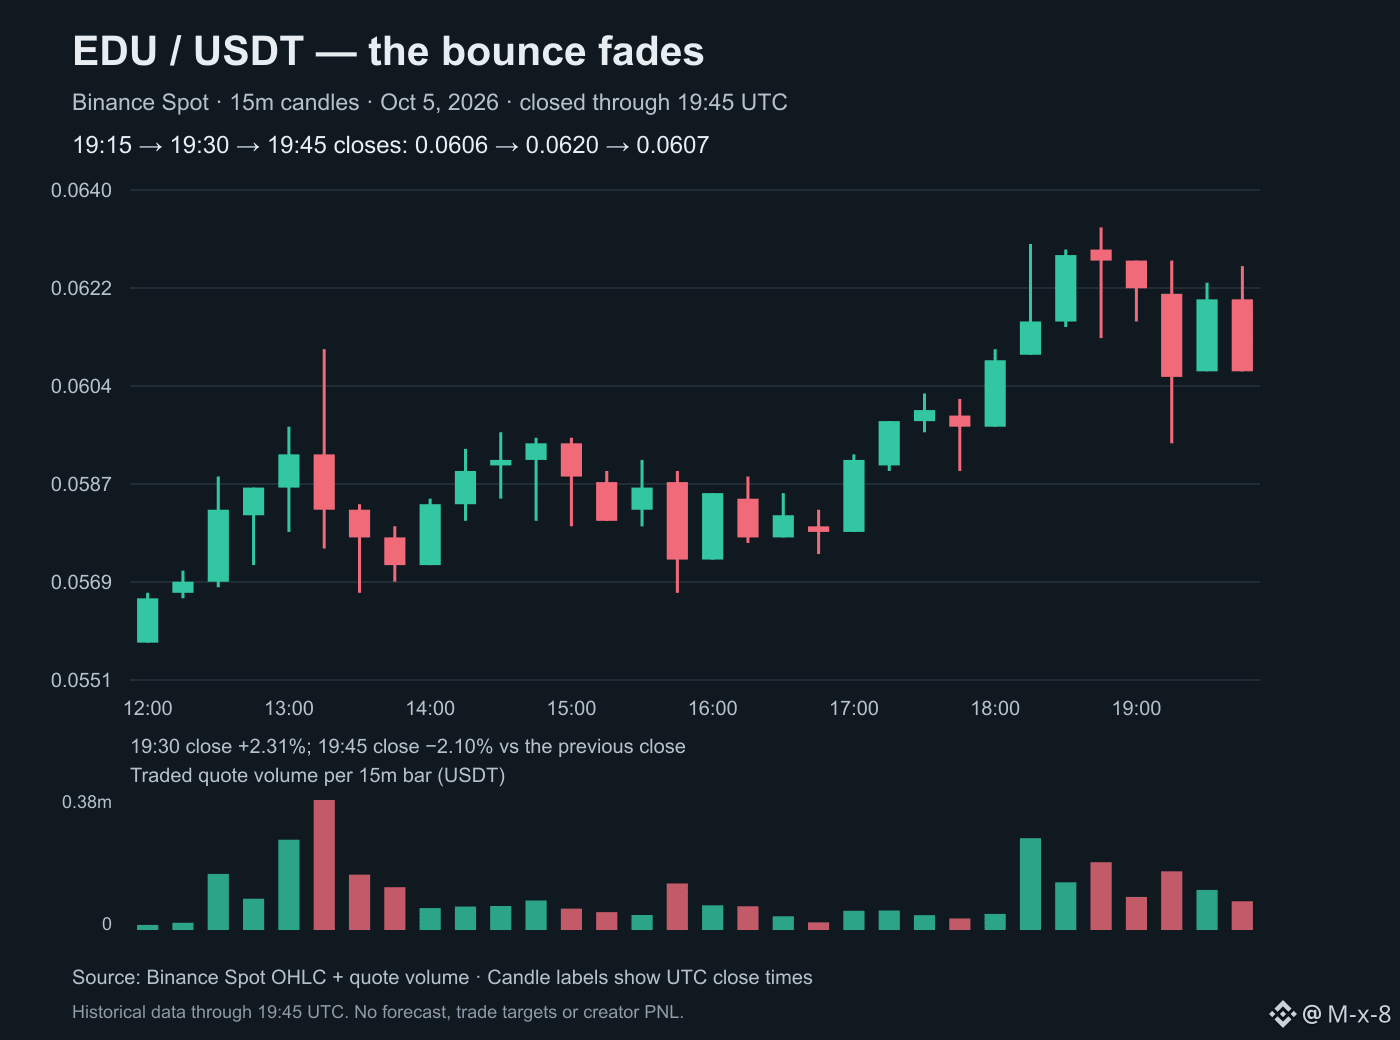
19:15 → 19:30 → 19:45 UTC closes:
0.0606 → 0.0620 → 0.0607.
19:45 close: -2.10% vs the prior close.
Rolling 24h: +15.05% at 19:48 UTC.
Binance Spot | Oct 5, 2026
$EDU — the bounce was almost erased.
19:15 → 19:30 → 19:45 UTC closes:
0.0606 → 0.0620 → 0.0607.
19:45 close: -2.10% vs the prior close.
Rolling 24h: +15.05% at 19:48 UTC.
Binance Spot | Oct 5, 2026
19:15 → 19:30 → 19:45 UTC closes:
0.0606 → 0.0620 → 0.0607.
19:45 close: -2.10% vs the prior close.
Rolling 24h: +15.05% at 19:48 UTC.
Binance Spot | Oct 5, 2026
25
·
--
Voir la traduction
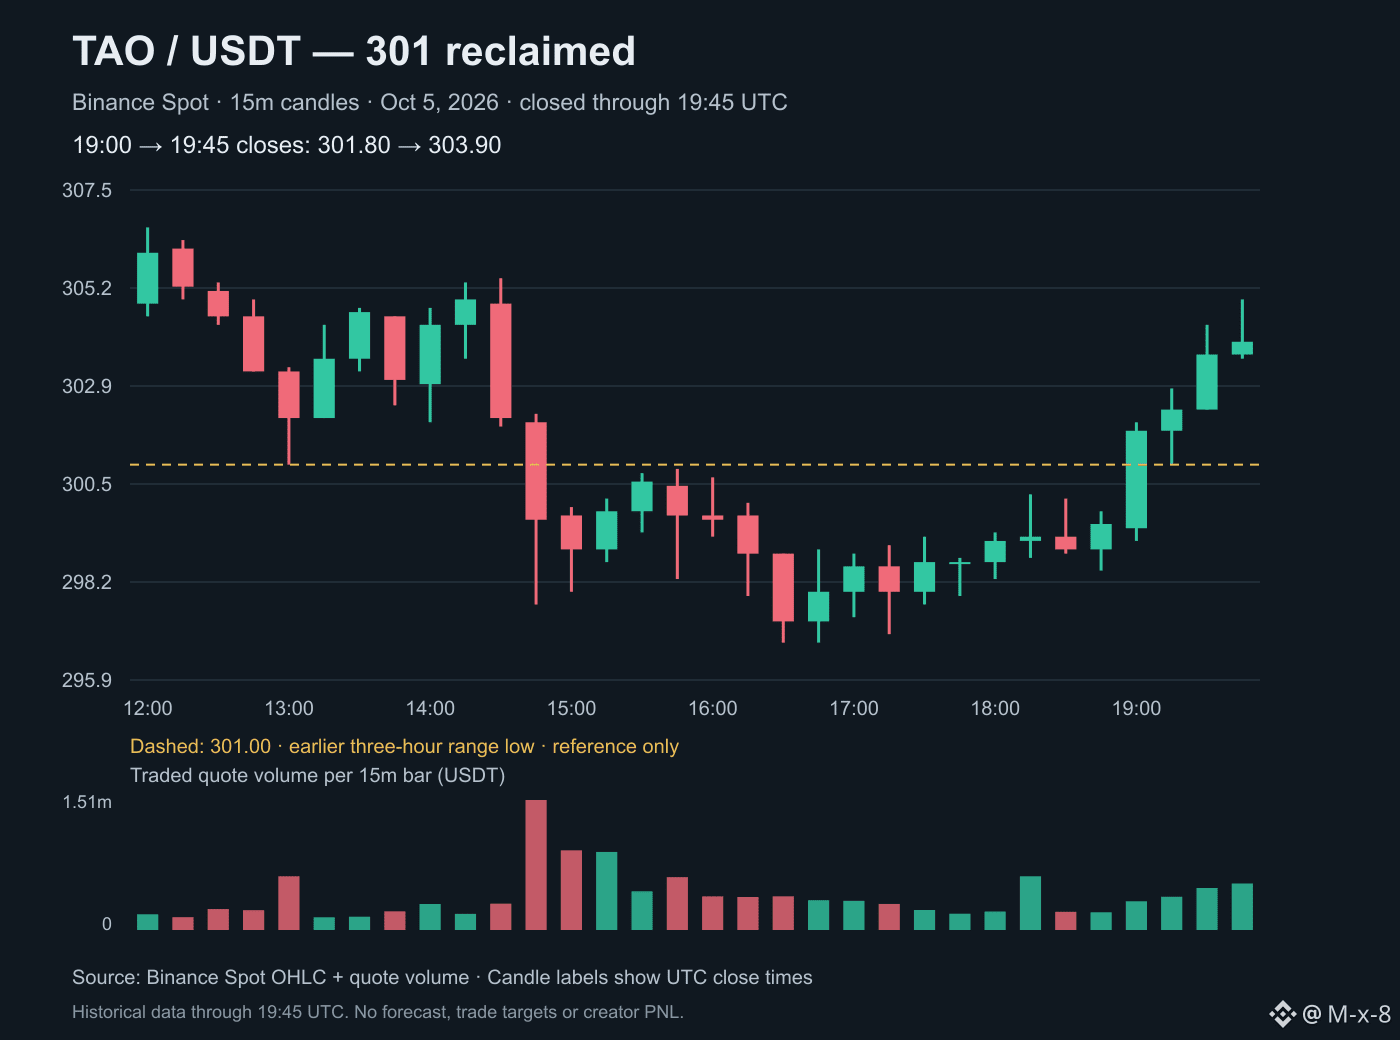
$TAO — back above 301.00 on four 15m closes.
19:00 UTC: 301.80
19:15 UTC: 302.30
19:30 UTC: 303.60
19:45 UTC: 303.90
301.00 — earlier range-low reference
The 19:45 candle stayed entirely above it. A close below 301.00 would invalidate this reclaim.
Binance Spot | Oct 5, 2026
$TAO — back above 301.00 on four 15m closes.
19:00 UTC: 301.80
19:15 UTC: 302.30
19:30 UTC: 303.60
19:45 UTC: 303.90
301.00 — earlier range-low reference
The 19:45 candle stayed entirely above it. A close below 301.00 would invalidate this reclaim.
Binance Spot | Oct 5, 2026
19:00 UTC: 301.80
19:15 UTC: 302.30
19:30 UTC: 303.60
19:45 UTC: 303.90
301.00 — earlier range-low reference
The 19:45 candle stayed entirely above it. A close below 301.00 would invalidate this reclaim.
Binance Spot | Oct 5, 2026
21
·
--
Voir la traduction
Seed phrase requests are a scam red flag—even from someone posing as a regulator.
The Oct 5, 2026 joint investor bulletin warns about impersonators seeking wallet keys.
Verify the contact through the organization's public website, not a number sent by the caller.
Investor education, not a new crypto rule.
Source: https://www.investor.gov/introduction-investing/general-resources/news-alerts/alerts-bulletins/investor-bulletins/world-investor-week-2026-investor-bulletin
Seed phrase requests are a scam red flag—even from someone posing as a regulator.
The Oct 5, 2026 joint investor bulletin warns about impersonators seeking wallet keys.
Verify the contact through the organization's public website, not a number sent by the caller.
Investor education, not a new crypto rule.
Source: https://www.investor.gov/introduction-investing/general-resources/news-alerts/alerts-bulletins/investor-bulletins/world-investor-week-2026-investor-bulletin
The Oct 5, 2026 joint investor bulletin warns about impersonators seeking wallet keys.
Verify the contact through the organization's public website, not a number sent by the caller.
Investor education, not a new crypto rule.
Source: https://www.investor.gov/introduction-investing/general-resources/news-alerts/alerts-bulletins/investor-bulletins/world-investor-week-2026-investor-bulletin
1
·
--
Voir la traduction
$TURTLE — the spike is already pulling back.
18:15 → 19:15 UTC closes: 0.0430 → 0.0482 (+12.09%).
19:15 bar: 831k USDT traded on Spot.
Live: 0.0449 at 19:23 UTC, below that close.
A 15m close below 0.0469 would lose the spike bar's low.
Binance Spot | Oct 5, 2026
$TURTLE — the spike is already pulling back.
18:15 → 19:15 UTC closes: 0.0430 → 0.0482 (+12.09%).
19:15 bar: 831k USDT traded on Spot.
Live: 0.0449 at 19:23 UTC, below that close.
A 15m close below 0.0469 would lose the spike bar's low.
Binance Spot | Oct 5, 2026
18:15 → 19:15 UTC closes: 0.0430 → 0.0482 (+12.09%).
19:15 bar: 831k USDT traded on Spot.
Live: 0.0449 at 19:23 UTC, below that close.
A 15m close below 0.0469 would lose the spike bar's low.
Binance Spot | Oct 5, 2026

199
·
--
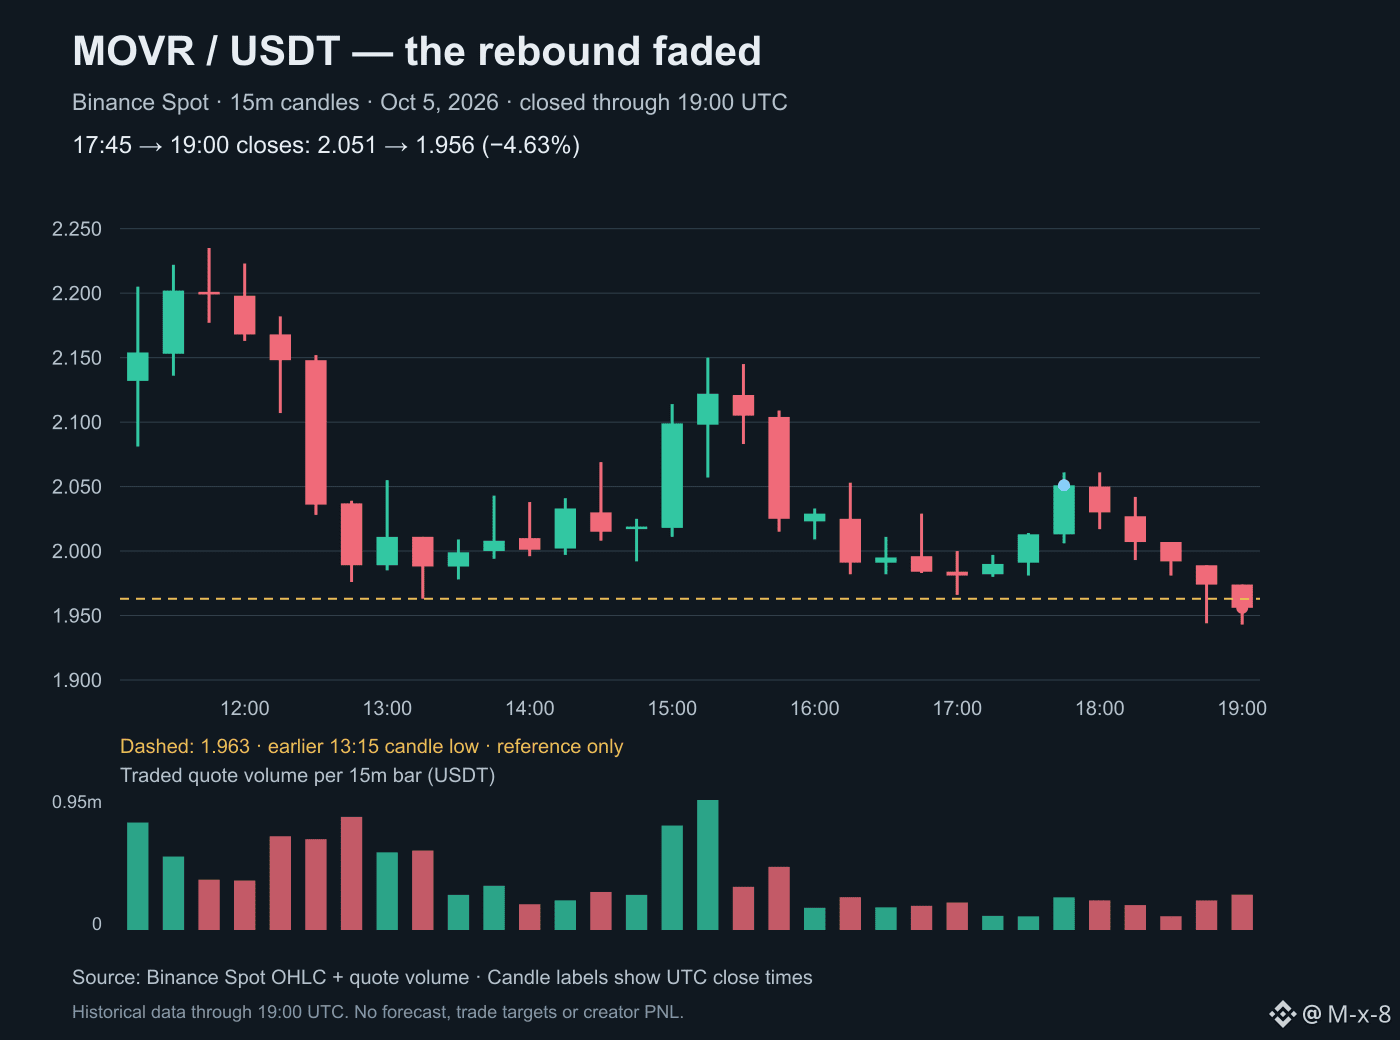
$MOVR — le rebond s’est essoufflé malgré un indicateur 24 h dans le vert.
17:45 → 19:00 UTC : 2,051 $ → 1,956 $ (-4,63 %).
À la clôture de 19:00, le cours est passé sous le précédent plus bas de 1,963 $.
Une clôture sur 15 min au-dessus de 1,963 $ changerait cette interprétation.
Binance Spot | 5 oct. 2026
Variation sur 24 h : +12,96 % à 19:12 UTC.
$MOVR — le rebond s’est essoufflé malgré un indicateur 24 h dans le vert.
17:45 → 19:00 UTC : 2,051 $ → 1,956 $ (-4,63 %).
À la clôture de 19:00, le cours est passé sous le précédent plus bas de 1,963 $.
Une clôture sur 15 min au-dessus de 1,963 $ changerait cette interprétation.
Binance Spot | 5 oct. 2026
Variation sur 24 h : +12,96 % à 19:12 UTC.
17:45 → 19:00 UTC : 2,051 $ → 1,956 $ (-4,63 %).
À la clôture de 19:00, le cours est passé sous le précédent plus bas de 1,963 $.
Une clôture sur 15 min au-dessus de 1,963 $ changerait cette interprétation.
Binance Spot | 5 oct. 2026
Variation sur 24 h : +12,96 % à 19:12 UTC.
207
·
--
$BTC — Strategy indique avoir ajouté 334 BTC du 1er au 4 octobre.
Coût d’achat : 28,7 millions de dollars, frais compris.
Avoirs : 848 000 BTC au 4 octobre, à 16 h, heure de l’Est.
La déclaration du 5 octobre décrit des achats effectués, et non un ordre d’achat en cours.
Source : formulaire 8-K de Strategy, 5 octobre 2026
https://www.strategy.com/press/strategy-reports-21-billion-gain-on-digital-assets-in-q3-2026-acquires-334-btc-and-repurchases-176m-of-strc_10-05-2026
$BTC — Strategy indique avoir ajouté 334 BTC du 1er au 4 octobre.
Coût d’achat : 28,7 millions de dollars, frais compris.
Avoirs : 848 000 BTC au 4 octobre, à 16 h, heure de l’Est.
La déclaration du 5 octobre décrit des achats effectués, et non un ordre d’achat en cours.
Source : formulaire 8-K de Strategy, 5 octobre 2026
https://www.strategy.com/press/strategy-reports-21-billion-gain-on-digital-assets-in-q3-2026-acquires-334-btc-and-repurchases-176m-of-strc_10-05-2026
Coût d’achat : 28,7 millions de dollars, frais compris.
Avoirs : 848 000 BTC au 4 octobre, à 16 h, heure de l’Est.
La déclaration du 5 octobre décrit des achats effectués, et non un ordre d’achat en cours.
Source : formulaire 8-K de Strategy, 5 octobre 2026
https://www.strategy.com/press/strategy-reports-21-billion-gain-on-digital-assets-in-q3-2026-acquires-334-btc-and-repurchases-176m-of-strc_10-05-2026
15
·
--
$GTC perpétuel — l’intérêt ouvert a diminué de 6,62 % entre 16:00 et 18:45 UTC.
Dernier taux de financement réglé : -0,2176 % à 16:00 UTC.
L’intérêt ouvert seul ne permet pas de savoir quel côté a clôturé ses positions ni si des positions ont été liquidées.
Binance USD-M | 5 oct. 2026
Widget Coin : Spot.
$GTC perpétuel — l’intérêt ouvert a diminué de 6,62 % entre 16:00 et 18:45 UTC.
Dernier taux de financement réglé : -0,2176 % à 16:00 UTC.
L’intérêt ouvert seul ne permet pas de savoir quel côté a clôturé ses positions ni si des positions ont été liquidées.
Binance USD-M | 5 oct. 2026
Widget Coin : Spot.
Dernier taux de financement réglé : -0,2176 % à 16:00 UTC.
L’intérêt ouvert seul ne permet pas de savoir quel côté a clôturé ses positions ni si des positions ont été liquidées.
Binance USD-M | 5 oct. 2026
Widget Coin : Spot.
118
·
--
$ZEC — 1328.42 repris après la vente massive de l’après-midi.
Clôture à 16:30 UTC : 1285.67
Clôture à 18:30 UTC : 1331.42 (+3.56 %)
Première clôture au-dessus de 1328.42 depuis la cassure de 15:00 UTC.
Une clôture en 15 min sous ce niveau de référence invaliderait cette reprise.
Binance Spot | 5 oct. 2026
$ZEC — 1328.42 repris après la vente massive de l’après-midi.
Clôture à 16:30 UTC : 1285.67
Clôture à 18:30 UTC : 1331.42 (+3.56 %)
Première clôture au-dessus de 1328.42 depuis la cassure de 15:00 UTC.
Une clôture en 15 min sous ce niveau de référence invaliderait cette reprise.
Binance Spot | 5 oct. 2026
Clôture à 16:30 UTC : 1285.67
Clôture à 18:30 UTC : 1331.42 (+3.56 %)
Première clôture au-dessus de 1328.42 depuis la cassure de 15:00 UTC.
Une clôture en 15 min sous ce niveau de référence invaliderait cette reprise.
Binance Spot | 5 oct. 2026

201
·
--
$OGN — en hausse sur 24 h, mais en baisse de 3,59 % sur les 15 dernières minutes.
Clôture à 18:15 UTC : 0,02341
Clôture à 18:30 UTC : 0,02257
Sur 24 h glissantes : +10,45 % à 18:35 UTC.
La hausse quotidienne et ce repli intrajournalier correspondent à des périodes différentes.
Binance Spot | 5 oct. 2026
$OGN — en hausse sur 24 h, mais en baisse de 3,59 % sur les 15 dernières minutes.
Clôture à 18:15 UTC : 0,02341
Clôture à 18:30 UTC : 0,02257
Sur 24 h glissantes : +10,45 % à 18:35 UTC.
La hausse quotidienne et ce repli intrajournalier correspondent à des périodes différentes.
Binance Spot | 5 oct. 2026
Clôture à 18:15 UTC : 0,02341
Clôture à 18:30 UTC : 0,02257
Sur 24 h glissantes : +10,45 % à 18:35 UTC.
La hausse quotidienne et ce repli intrajournalier correspondent à des périodes différentes.
Binance Spot | 5 oct. 2026
96
·
--
Voir la traduction
CFTC — public input, not a new crypto rule.
The Oct 5 notice asks how to regulate retail crypto commodity transactions and create a dedicated crypto asset market registration category.
This advance notice will inform possible future rulemaking.
Comments: due 60 days after Federal Register publication.
Source: CFTC, Oct 5, 2026
https://www.cftc.gov/PressRoom/PressReleases/9307-26
CFTC — public input, not a new crypto rule.
The Oct 5 notice asks how to regulate retail crypto commodity transactions and create a dedicated crypto asset market registration category.
This advance notice will inform possible future rulemaking.
Comments: due 60 days after Federal Register publication.
Source: CFTC, Oct 5, 2026
https://www.cftc.gov/PressRoom/PressReleases/9307-26
The Oct 5 notice asks how to regulate retail crypto commodity transactions and create a dedicated crypto asset market registration category.
This advance notice will inform possible future rulemaking.
Comments: due 60 days after Federal Register publication.
Source: CFTC, Oct 5, 2026
https://www.cftc.gov/PressRoom/PressReleases/9307-26
1
·
--
$ETH — Bitmine indique avoir acheté 15 112 ETH supplémentaires au cours de la semaine écoulée.
Avoirs : 6 016 414 ETH
Mis en staking : 5 067 309 ETH
Données au 4 octobre 2026, à 18 h 30 (ET).
Il s’agit des chiffres de trésorerie de l’entreprise, et non des flux entrants dans des ETF ni d’un ordre d’achat en temps réel.
Source : Bitmine, 5 octobre
https://www.prnewswire.com/apac/news-releases/bitmine-immersion-technologies-bmnr-announces-eth-holdings-reach-6-02-million-tokens-and-total-crypto-and-total-cash--marketable-securities-holdings-of-17-4-billion-302898094.html
$ETH — Bitmine indique avoir acheté 15 112 ETH supplémentaires au cours de la semaine écoulée.
Avoirs : 6 016 414 ETH
Mis en staking : 5 067 309 ETH
Données au 4 octobre 2026, à 18 h 30 (ET).
Il s’agit des chiffres de trésorerie de l’entreprise, et non des flux entrants dans des ETF ni d’un ordre d’achat en temps réel.
Source : Bitmine, 5 octobre
https://www.prnewswire.com/apac/news-releases/bitmine-immersion-technologies-bmnr-announces-eth-holdings-reach-6-02-million-tokens-and-total-crypto-and-total-cash--marketable-securities-holdings-of-17-4-billion-302898094.html
Avoirs : 6 016 414 ETH
Mis en staking : 5 067 309 ETH
Données au 4 octobre 2026, à 18 h 30 (ET).
Il s’agit des chiffres de trésorerie de l’entreprise, et non des flux entrants dans des ETF ni d’un ordre d’achat en temps réel.
Source : Bitmine, 5 octobre
https://www.prnewswire.com/apac/news-releases/bitmine-immersion-technologies-bmnr-announces-eth-holdings-reach-6-02-million-tokens-and-total-crypto-and-total-cash--marketable-securities-holdings-of-17-4-billion-302898094.html
6
·
--
$RLC — clôture en 15 min au-dessus de 0.6065.
Clôtures UTC de 17:45 à 18:00 : 0.5830 → 0.6530 (+12.01 %).
1.32m USDT échangés sur cette bougie — 6.17× la bougie précédente.
Cela change mon précédent point sur le cours « sous 0.6065 ».
Binance Spot | 5 oct. 2026
$RLC — clôture en 15 min au-dessus de 0.6065.
Clôtures UTC de 17:45 à 18:00 : 0.5830 → 0.6530 (+12.01 %).
1.32m USDT échangés sur cette bougie — 6.17× la bougie précédente.
Cela change mon précédent point sur le cours « sous 0.6065 ».
Binance Spot | 5 oct. 2026
Clôtures UTC de 17:45 à 18:00 : 0.5830 → 0.6530 (+12.01 %).
1.32m USDT échangés sur cette bougie — 6.17× la bougie précédente.
Cela change mon précédent point sur le cours « sous 0.6065 ».
Binance Spot | 5 oct. 2026
193
·
--
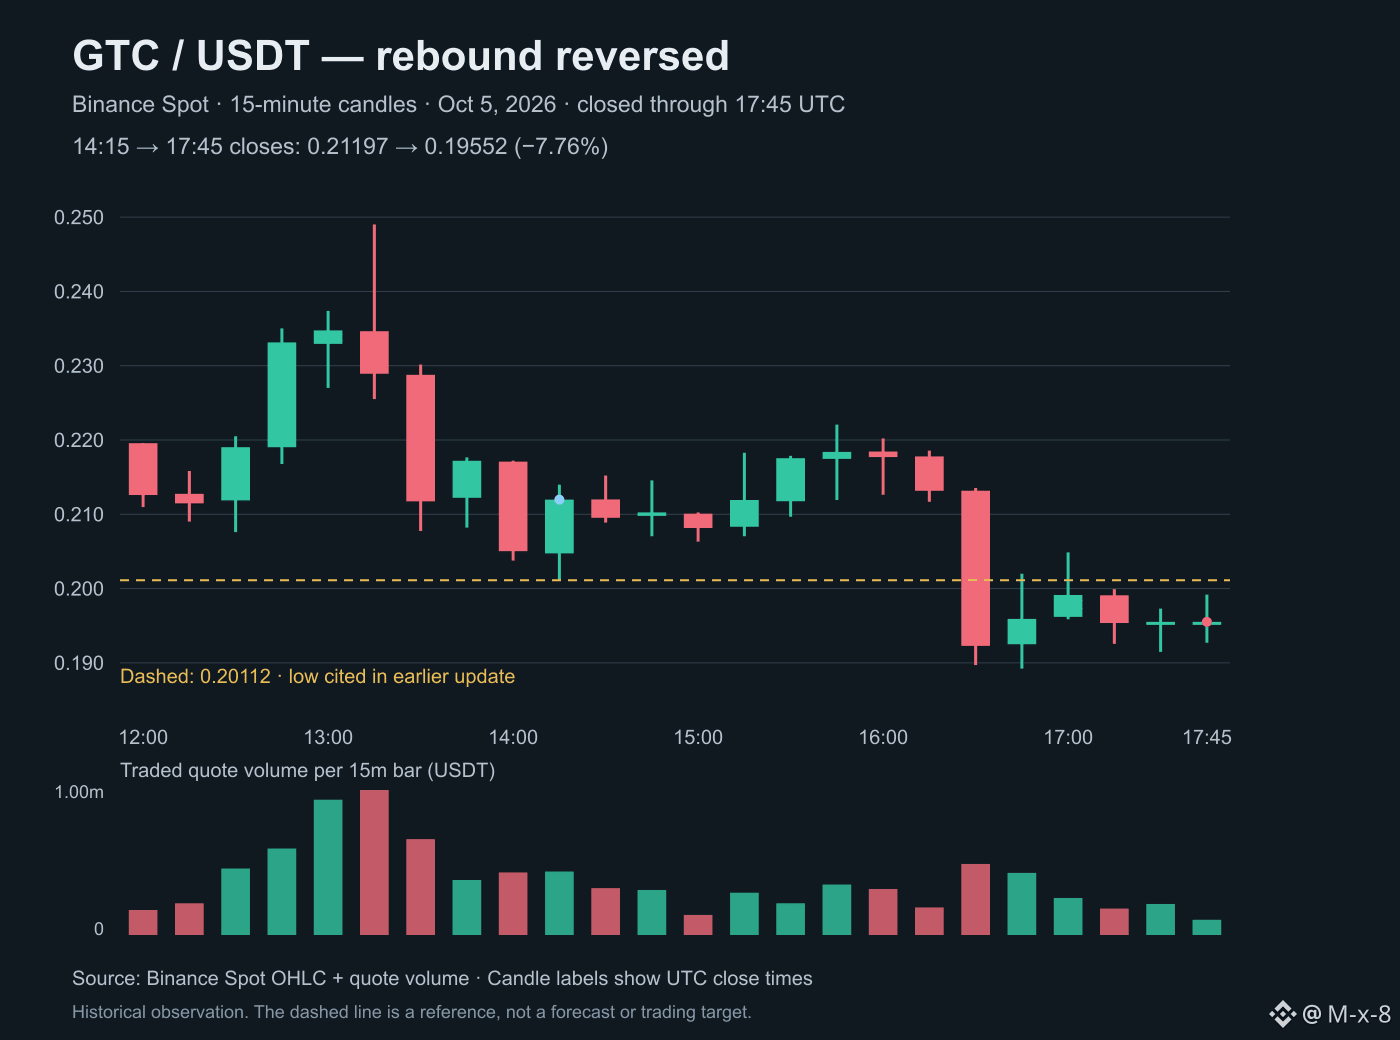
$GTC — le rebond s’est inversé.
Clôtures de 14:15 à 17:45 UTC : 0.21197 → 0.19552 (-7.76 %).
Clôture à 18:00 : 0.19688 — la septième clôture 15 min sous 0.20112, le plus bas cité dans ma mise à jour sur le rebond.
Une clôture repassant au-dessus de 0.20112 modifierait cette analyse.
Binance Spot | 5 oct. 2026
$GTC — le rebond s’est inversé.
Clôtures de 14:15 à 17:45 UTC : 0.21197 → 0.19552 (-7.76 %).
Clôture à 18:00 : 0.19688 — la septième clôture 15 min sous 0.20112, le plus bas cité dans ma mise à jour sur le rebond.
Une clôture repassant au-dessus de 0.20112 modifierait cette analyse.
Binance Spot | 5 oct. 2026
Clôtures de 14:15 à 17:45 UTC : 0.21197 → 0.19552 (-7.76 %).
Clôture à 18:00 : 0.19688 — la septième clôture 15 min sous 0.20112, le plus bas cité dans ma mise à jour sur le rebond.
Une clôture repassant au-dessus de 0.20112 modifierait cette analyse.
Binance Spot | 5 oct. 2026
107
·
--
$RLC — un rebond de 7,29 % en 30 minutes.
Clôtures de 16:45 à 17:15 UTC : 0,5390 → 0,5783.
Bougie de 17:15 : 718k USDT échangés, contre 359k sur la bougie précédente.
Clôture à 17:30 : 0,5773 — toujours sous le plus haut de la bougie de 17:15, à 0,6065.
Binance Spot | 5 oct. 2026
$RLC — un rebond de 7,29 % en 30 minutes.
Clôtures de 16:45 à 17:15 UTC : 0,5390 → 0,5783.
Bougie de 17:15 : 718k USDT échangés, contre 359k sur la bougie précédente.
Clôture à 17:30 : 0,5773 — toujours sous le plus haut de la bougie de 17:15, à 0,6065.
Binance Spot | 5 oct. 2026
Clôtures de 16:45 à 17:15 UTC : 0,5390 → 0,5783.
Bougie de 17:15 : 718k USDT échangés, contre 359k sur la bougie précédente.
Clôture à 17:30 : 0,5773 — toujours sous le plus haut de la bougie de 17:15, à 0,6065.
Binance Spot | 5 oct. 2026

140
·
--
Voir la traduction
Crypto-linked equities took ~44% of Binance's weekly net equity inflows.
Circle, Strategy + BitMine: $71.4m
All equities: $163m, up from $73m
Window: Sep 28–Oct 2, 2026.
Scope: equities on Binance, not spot-token or ETF flows.
Source: Binance Research, Oct 5
https://www.binance.com/en/research/analysis/weekly-market-commentary-2026-10-05
Crypto-linked equities took ~44% of Binance's weekly net equity inflows.
Circle, Strategy + BitMine: $71.4m
All equities: $163m, up from $73m
Window: Sep 28–Oct 2, 2026.
Scope: equities on Binance, not spot-token or ETF flows.
Source: Binance Research, Oct 5
https://www.binance.com/en/research/analysis/weekly-market-commentary-2026-10-05
Circle, Strategy + BitMine: $71.4m
All equities: $163m, up from $73m
Window: Sep 28–Oct 2, 2026.
Scope: equities on Binance, not spot-token or ETF flows.
Source: Binance Research, Oct 5
https://www.binance.com/en/research/analysis/weekly-market-commentary-2026-10-05
14
·
--
Voir la traduction
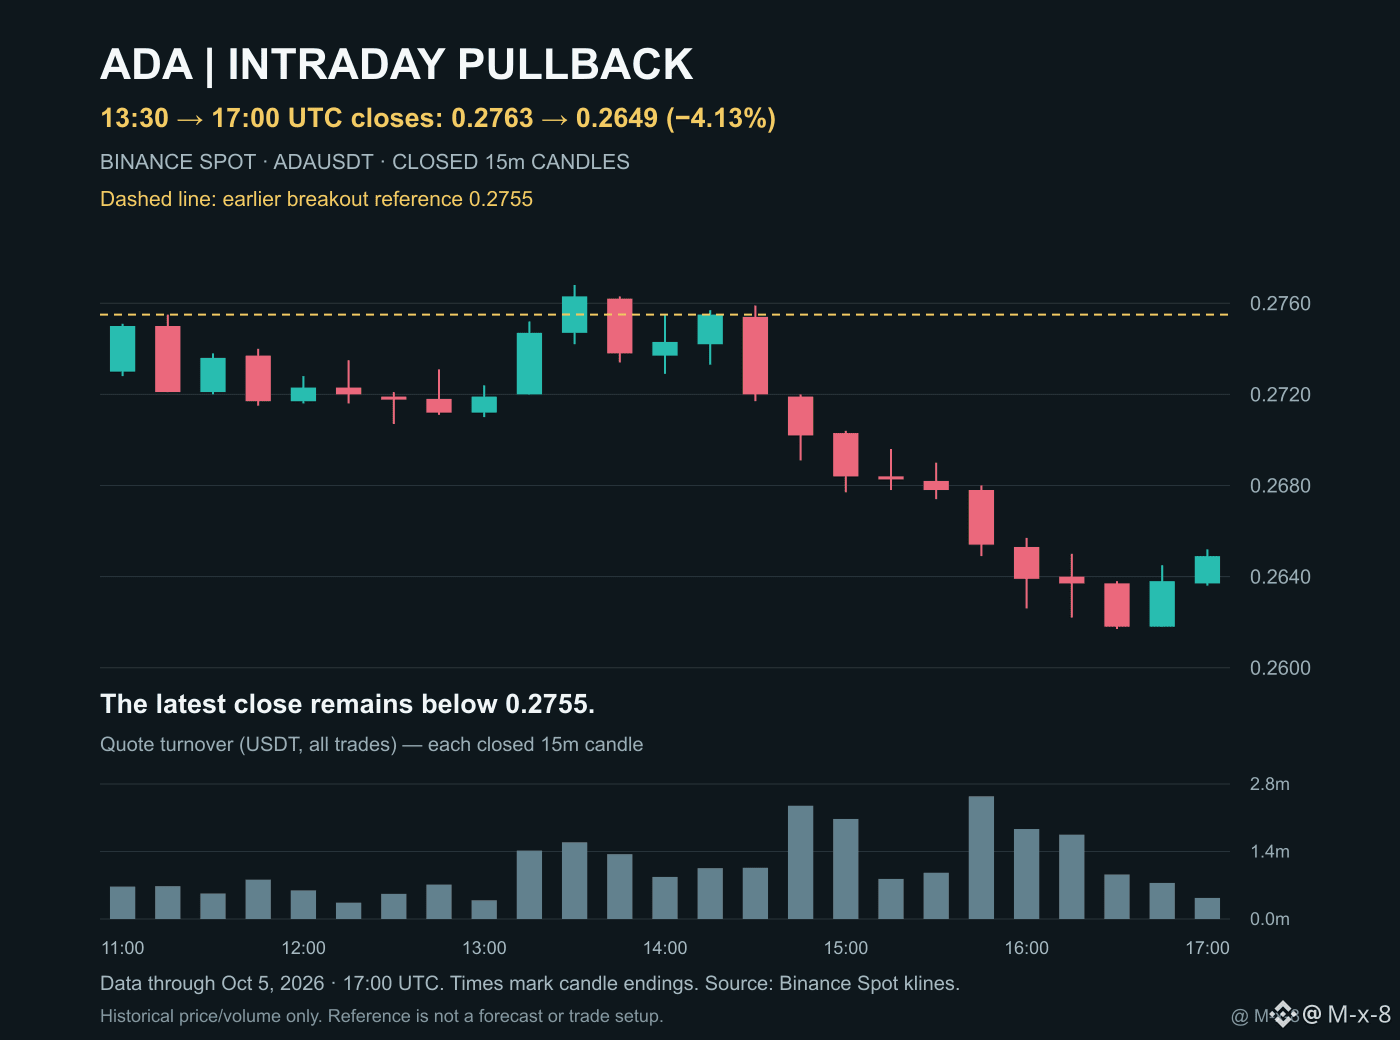
$ADA — the 24h gain hides an intraday pullback.
13:30 UTC close: 0.2763
17:00 UTC close: 0.2649 (-4.13%)
0.2755 — earlier breakout reference
Price bounced from 0.2617, but remains below 0.2755. A closed 15m reclaim would change this read.
Binance Spot | Oct 5, 2026
$ADA — the 24h gain hides an intraday pullback.
13:30 UTC close: 0.2763
17:00 UTC close: 0.2649 (-4.13%)
0.2755 — earlier breakout reference
Price bounced from 0.2617, but remains below 0.2755. A closed 15m reclaim would change this read.
Binance Spot | Oct 5, 2026
13:30 UTC close: 0.2763
17:00 UTC close: 0.2649 (-4.13%)
0.2755 — earlier breakout reference
Price bounced from 0.2617, but remains below 0.2755. A closed 15m reclaim would change this read.
Binance Spot | Oct 5, 2026
23
·
--
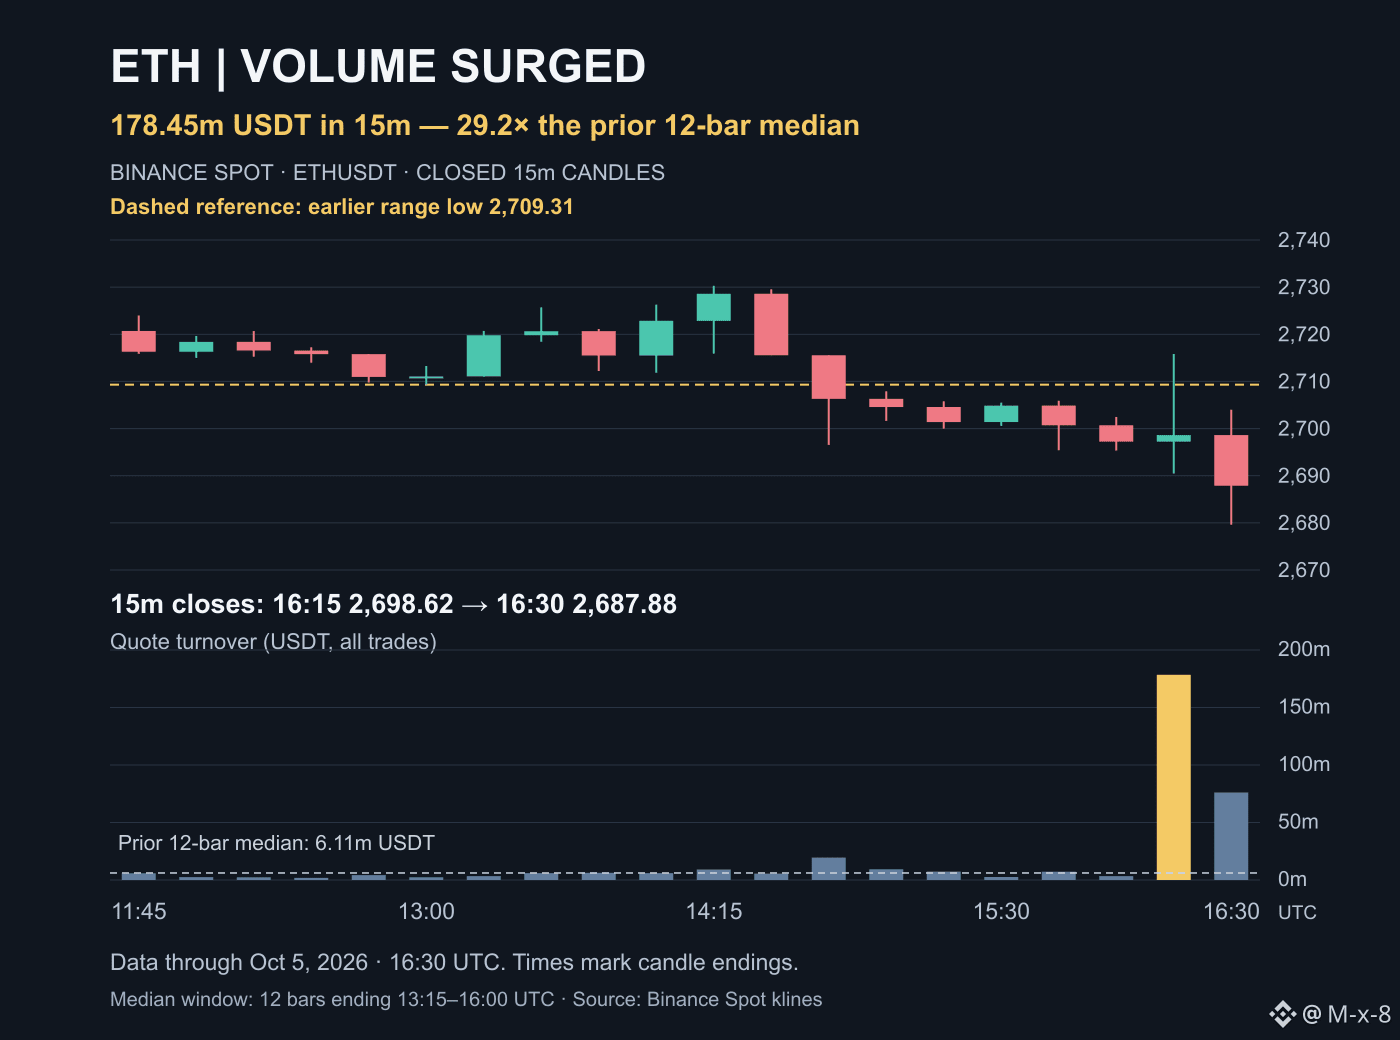
$ETH — le volume a bondi sans reconquête.
16:15 UTC : 178,45 M USDT échangés en 15 min — 29,2× la médiane des 12 bougies précédentes.
Clôture à 16:30 : 2 687,88
Clôture à 16:45 : 2 689,73
2 709,31 — référence du précédent creux de range
Les trois clôtures sont restées sous ce niveau. Une reconquête confirmée à la clôture changerait cette lecture.
Binance Spot | 5 oct., 16:45 UTC
$ETH — le volume a bondi sans reconquête.
16:15 UTC : 178,45 M USDT échangés en 15 min — 29,2× la médiane des 12 bougies précédentes.
Clôture à 16:30 : 2 687,88
Clôture à 16:45 : 2 689,73
2 709,31 — référence du précédent creux de range
Les trois clôtures sont restées sous ce niveau. Une reconquête confirmée à la clôture changerait cette lecture.
Binance Spot | 5 oct., 16:45 UTC
16:15 UTC : 178,45 M USDT échangés en 15 min — 29,2× la médiane des 12 bougies précédentes.
Clôture à 16:30 : 2 687,88
Clôture à 16:45 : 2 689,73
2 709,31 — référence du précédent creux de range
Les trois clôtures sont restées sous ce niveau. Une reconquête confirmée à la clôture changerait cette lecture.
Binance Spot | 5 oct., 16:45 UTC
14
·
--
$PEPE Actualités sur les ETF : dépôt ≠ lancement.
Canary a déposé un formulaire S-1/A le 2 octobre 2026. Son prospectus est préliminaire ; les parts ne peuvent être vendues avant que l’enregistrement ne prenne effet.
Ce dépôt, à lui seul, ne signifie pas que la cotation va commencer.
Source : SEC EDGAR
https://www.sec.gov/Archives/edgar/data/2109686/000199937126022017/canarypepe-s1a_100226.htm
$PEPE Actualités sur les ETF : dépôt ≠ lancement.
Canary a déposé un formulaire S-1/A le 2 octobre 2026. Son prospectus est préliminaire ; les parts ne peuvent être vendues avant que l’enregistrement ne prenne effet.
Ce dépôt, à lui seul, ne signifie pas que la cotation va commencer.
Source : SEC EDGAR
https://www.sec.gov/Archives/edgar/data/2109686/000199937126022017/canarypepe-s1a_100226.htm
Canary a déposé un formulaire S-1/A le 2 octobre 2026. Son prospectus est préliminaire ; les parts ne peuvent être vendues avant que l’enregistrement ne prenne effet.
Ce dépôt, à lui seul, ne signifie pas que la cotation va commencer.
Source : SEC EDGAR
https://www.sec.gov/Archives/edgar/data/2109686/000199937126022017/canarypepe-s1a_100226.htm
61
·
--
$FET — le rebond n’a pas réparé la cassure.
0.2553 — plus bas précédent sur trois heures
0.2494 — clôture à 16:00 UTC
Sept clôtures consécutives en 15 min sous ce niveau de référence. Une reprise confirmée à la clôture changerait cette lecture.
Binance Spot | 5 oct. 2026
$FET — le rebond n’a pas réparé la cassure.
0.2553 — plus bas précédent sur trois heures
0.2494 — clôture à 16:00 UTC
Sept clôtures consécutives en 15 min sous ce niveau de référence. Une reprise confirmée à la clôture changerait cette lecture.
Binance Spot | 5 oct. 2026
0.2553 — plus bas précédent sur trois heures
0.2494 — clôture à 16:00 UTC
Sept clôtures consécutives en 15 min sous ce niveau de référence. Une reprise confirmée à la clôture changerait cette lecture.
Binance Spot | 5 oct. 2026

100
Connectez-vous pour découvrir plus de contenu
Rejoignez la communauté mondiale des adeptes de cryptomonnaies sur Binance Square
⚡️ Suviez les dernières informations importantes sur les cryptomonnaies.
💬 Jugé digne de confiance par la plus grande plateforme d’échange de cryptomonnaies au monde.
👍 Découvrez les connaissances que partagent les créateurs vérifiés.
Adresse e-mail/Nº de téléphone
Sujets d’actualité
ADAGains10%Above$0.27
7,689 vues
140 mentions
$ADA réalise une forte progression aujourd’hui, bondissant de plus de 10 % pour atteindre environ 027 et franchir un nouveau plus haut sur 90 jours.
Le volume des échanges a également dépassé 1 milliard, signe d’une forte activité sur le marché.
Cette hausse survient alors que $ADA poursuit son redressement après ses plus bas de juin, tandis que sa configuration technique récente est devenue plus haussière.
La zone de 027 à 028 constitue désormais un niveau clé à surveiller. Une cassure durable pourrait ouvrir la voie à des niveaux de résistance plus élevés.
Cependant, après une telle hausse journalière, la volatilité pourrait rester élevée.
#ADAGains10%Above$0.27 #crypto #ADA #Cardano #crypto #Write2Earn
AbdullahAbid_7
·0 mentions J’aime
·274 vues
ETHUp70%InQ3ButLiquidityFalls
90,697 vues
843 mentions
EthStakingExitQueueHits2026High
34,519 vues
636 mentions