

أميرة سيد
2.6k Publications

أميرة سيد
Signaler
Bloquer l’utilisateur
Professional Trader | Free Chart Analysis | Signal & Update about Crypto |
Ouvert au trading
Trade occasionnellement
1.3 an(s)
29 Suivis
1.0K+ Abonnés
499 J’aime
Publications
Portefeuille
Tous
Citations
·
--
Voir la traduction
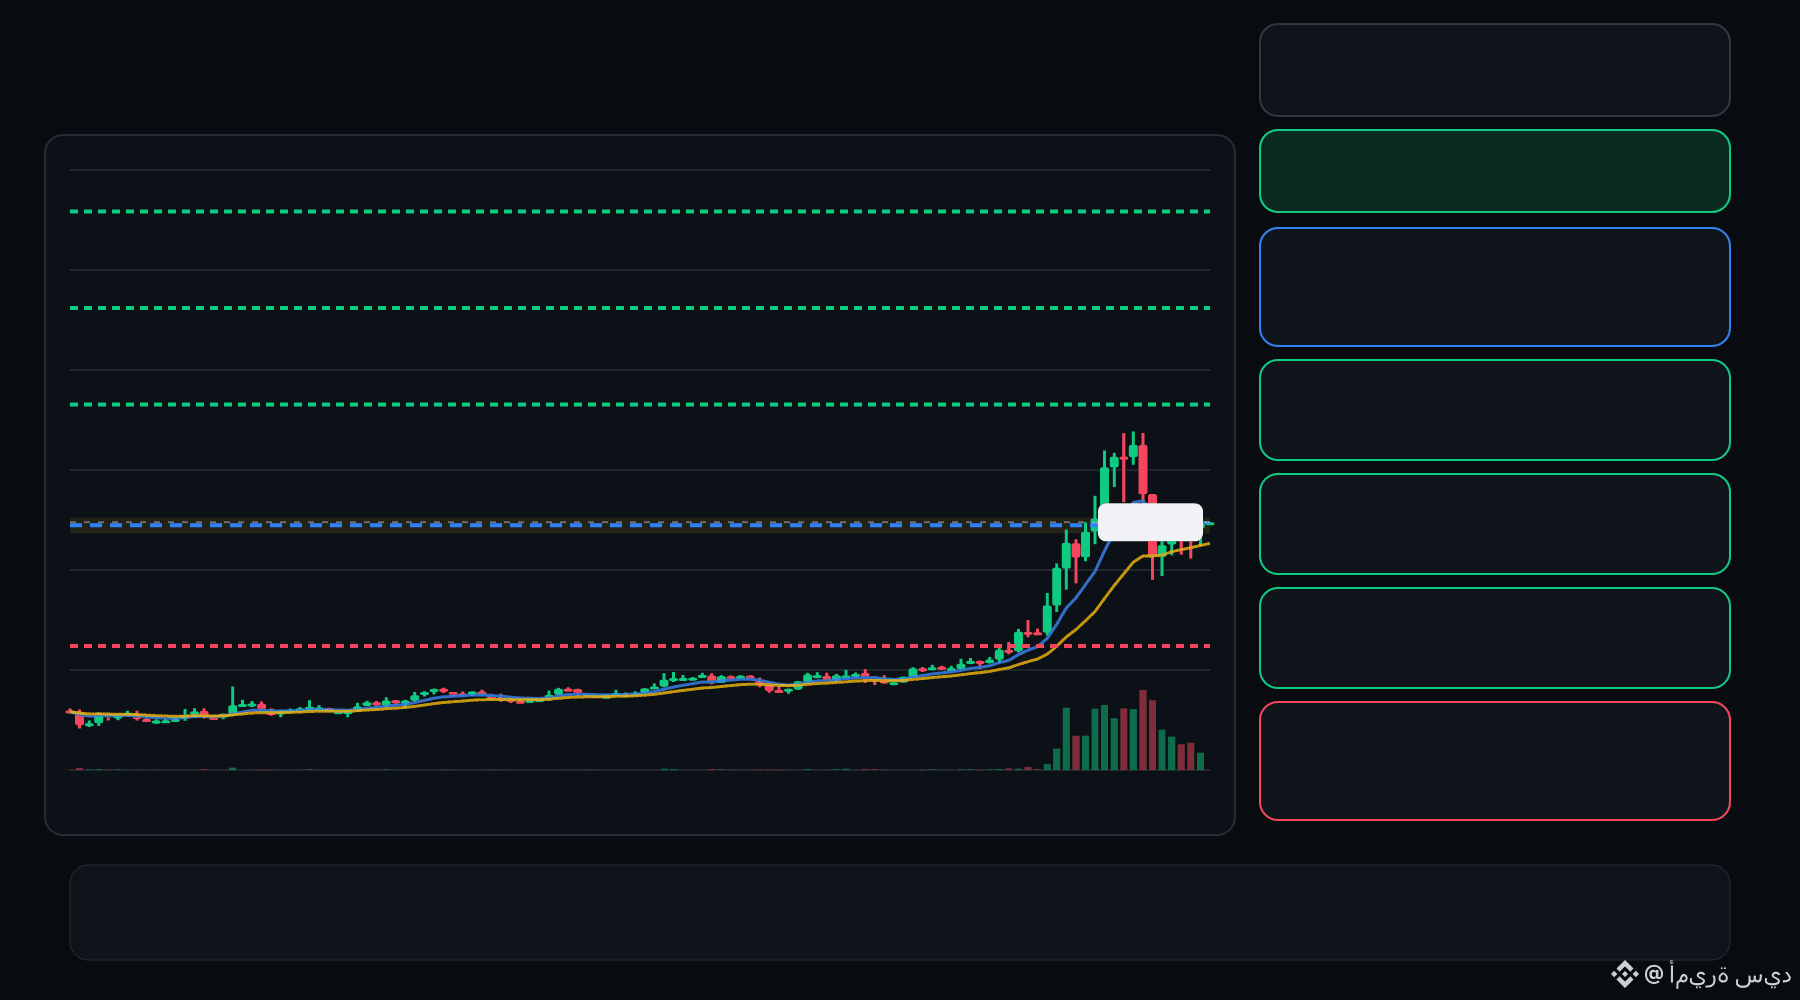
🟢 AIOT bulls are defending the pullback… is continuation setting up ⁉️
🟩 AIOT LONG
Entry: 0.08529 – 0.08669
TP1: 0.09667
TP2: 0.1052
TP3: 0.1138
Stop Loss: 0.07530
The 15M chart shows a bullish structure with momentum and volume confirmation. A controlled retest of the entry zone may give the setup a cleaner trigger.
Plan: Wait for confirmation/rejection inside the entry zone; don’t chase the move.
DYOR | Manage Risk | Avoid Over-Leverage
1
·
--
Voir la traduction
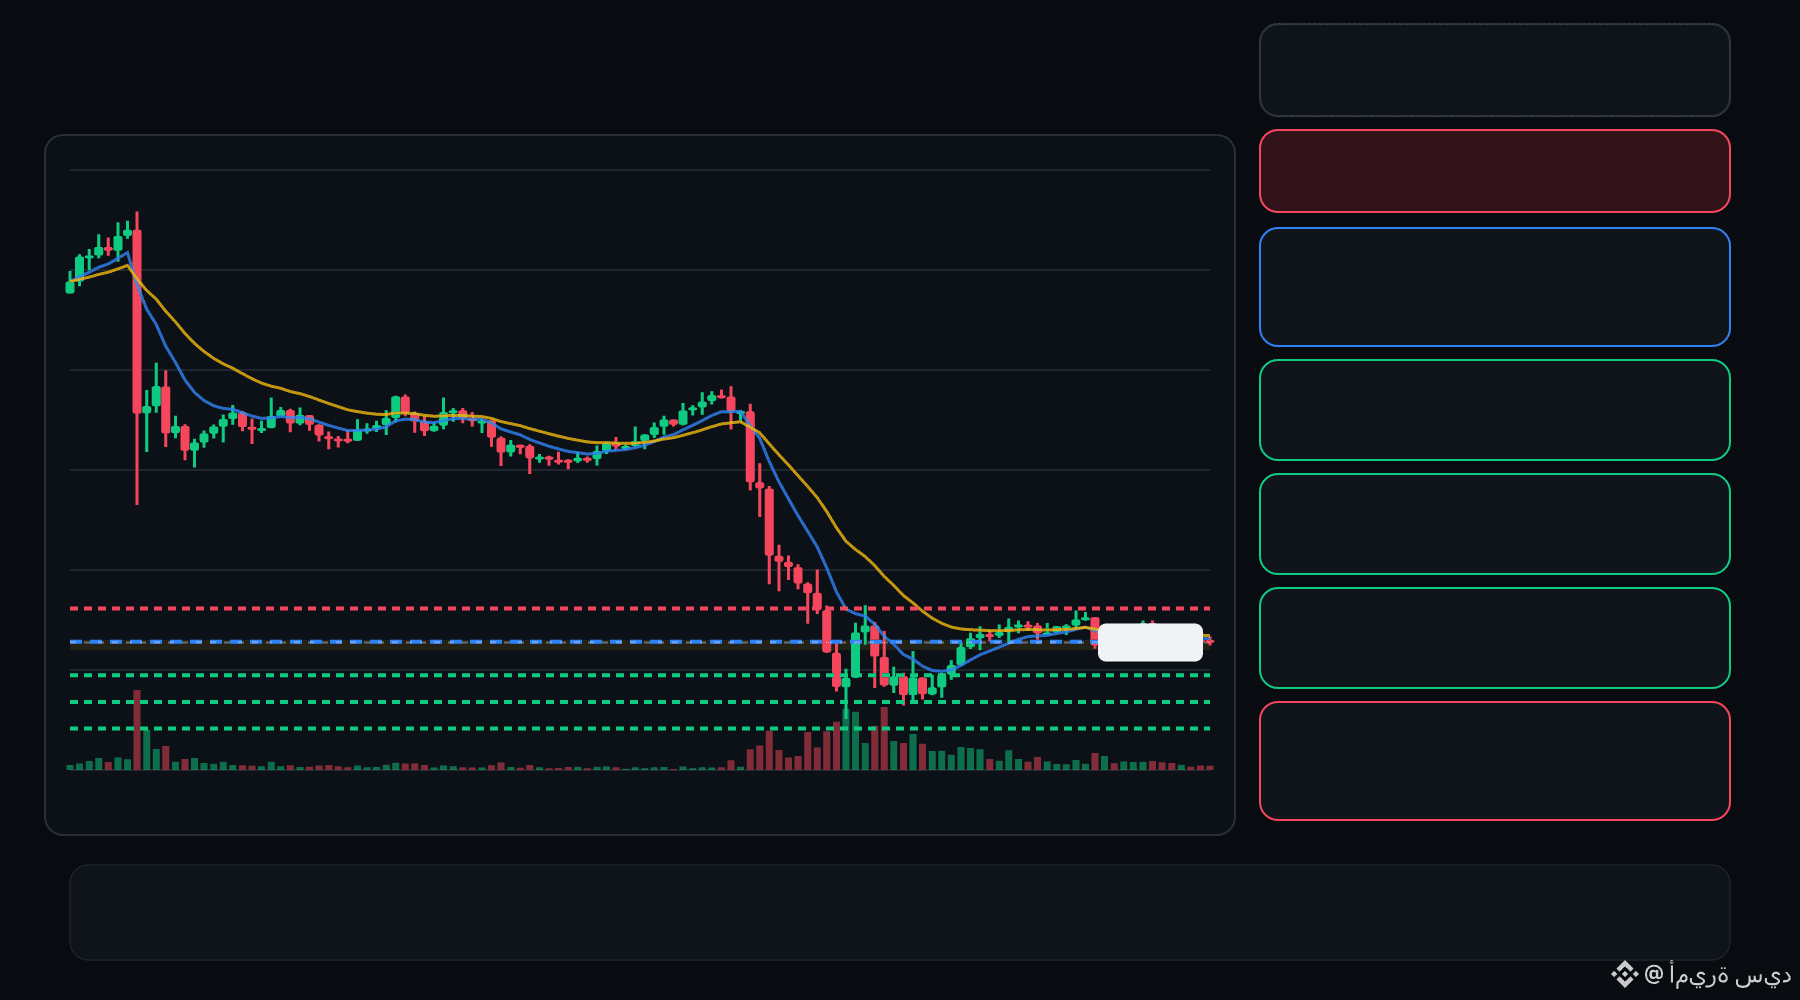
🔴 Q bears are pressing the pullback… is the rejection getting deeper ⁉️
🔴 Q SHORT
Entry: 0.03159 – 0.03185
TP1: 0.02933
TP2: 0.02742
TP3: 0.02551
Stop Loss: 0.03411
The 15M chart shows a bearish structure with momentum and volume confirmation. A controlled retest of the entry zone may give the setup a cleaner trigger.
Plan: Wait for confirmation/rejection inside the entry zone; don’t chase the move.
DYOR | Manage Risk | Avoid Over-Leverage
2
·
--
Voir la traduction
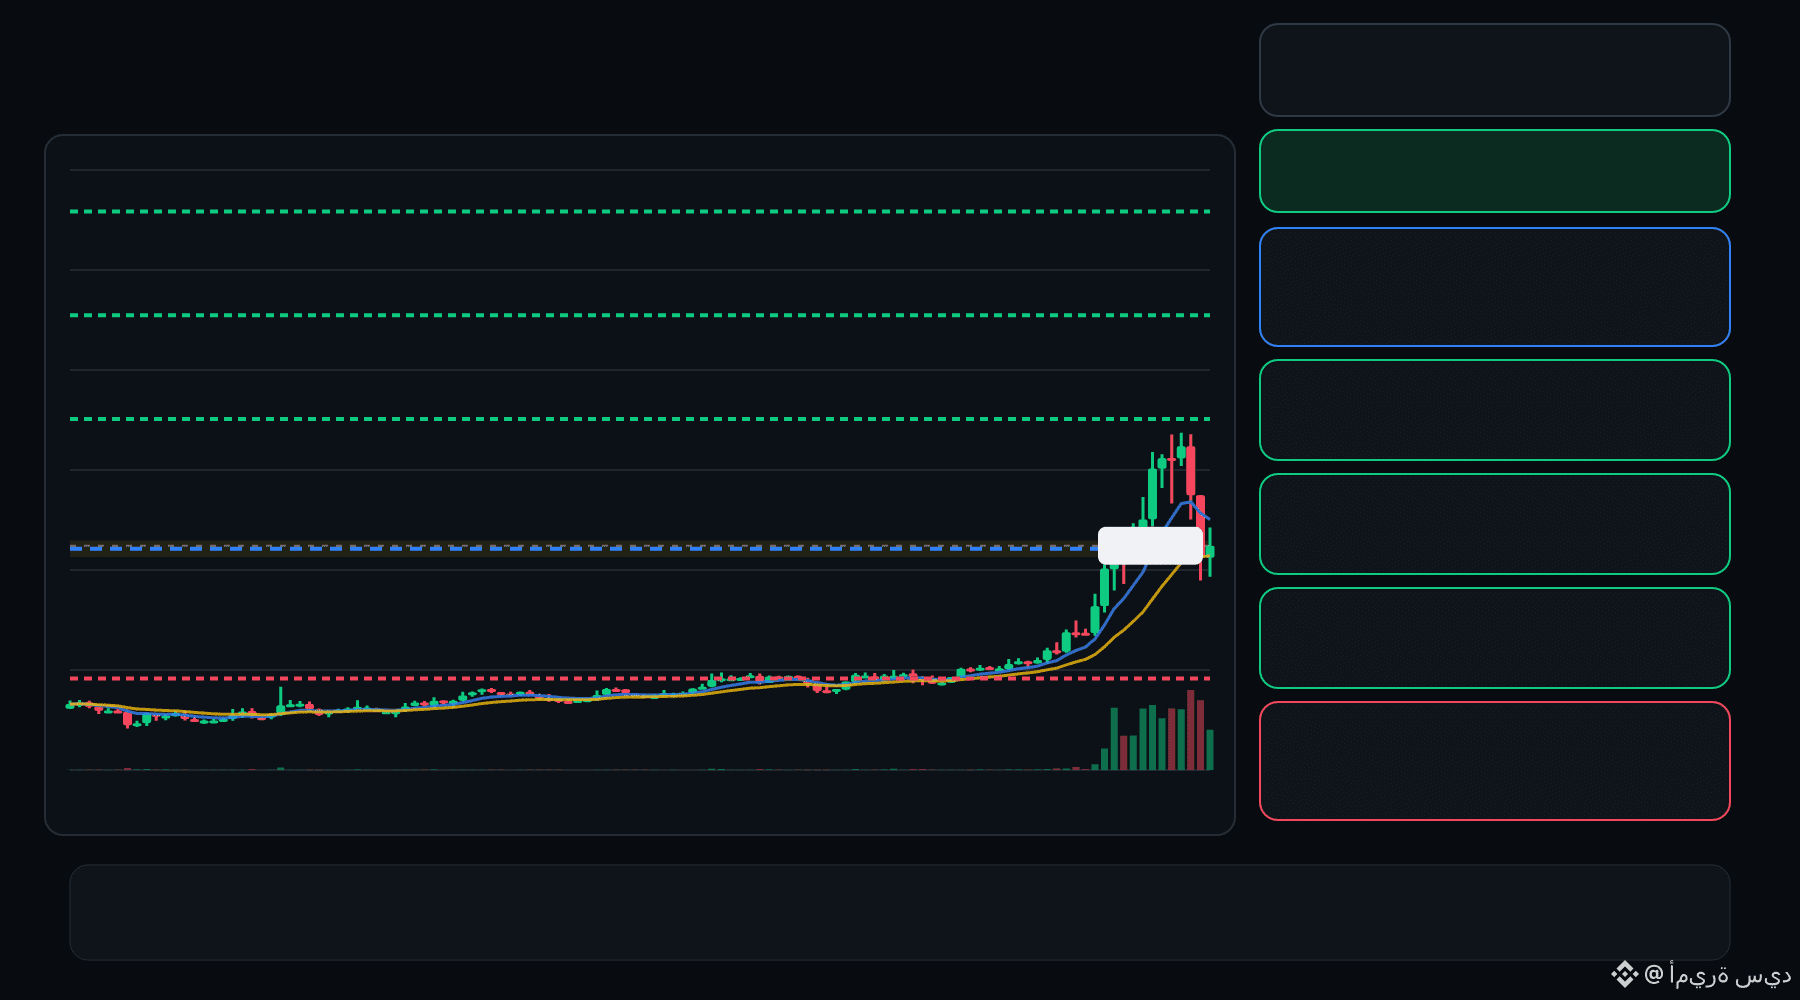
🟢 AIOT bulls are defending the pullback… is continuation setting up ⁉️
🟩 AIOT LONG
Entry: 0.08326 – 0.08472
TP1: 0.09552
TP2: 0.1048
TP3: 0.1140
Stop Loss: 0.07245
The 15M chart shows a bullish structure with momentum and volume confirmation. A controlled retest of the entry zone may give the setup a cleaner trigger.
Plan: Wait for confirmation/rejection inside the entry zone; don’t chase the move.
DYOR | Manage Risk | Avoid Over-Leverage
·
--
Voir la traduction
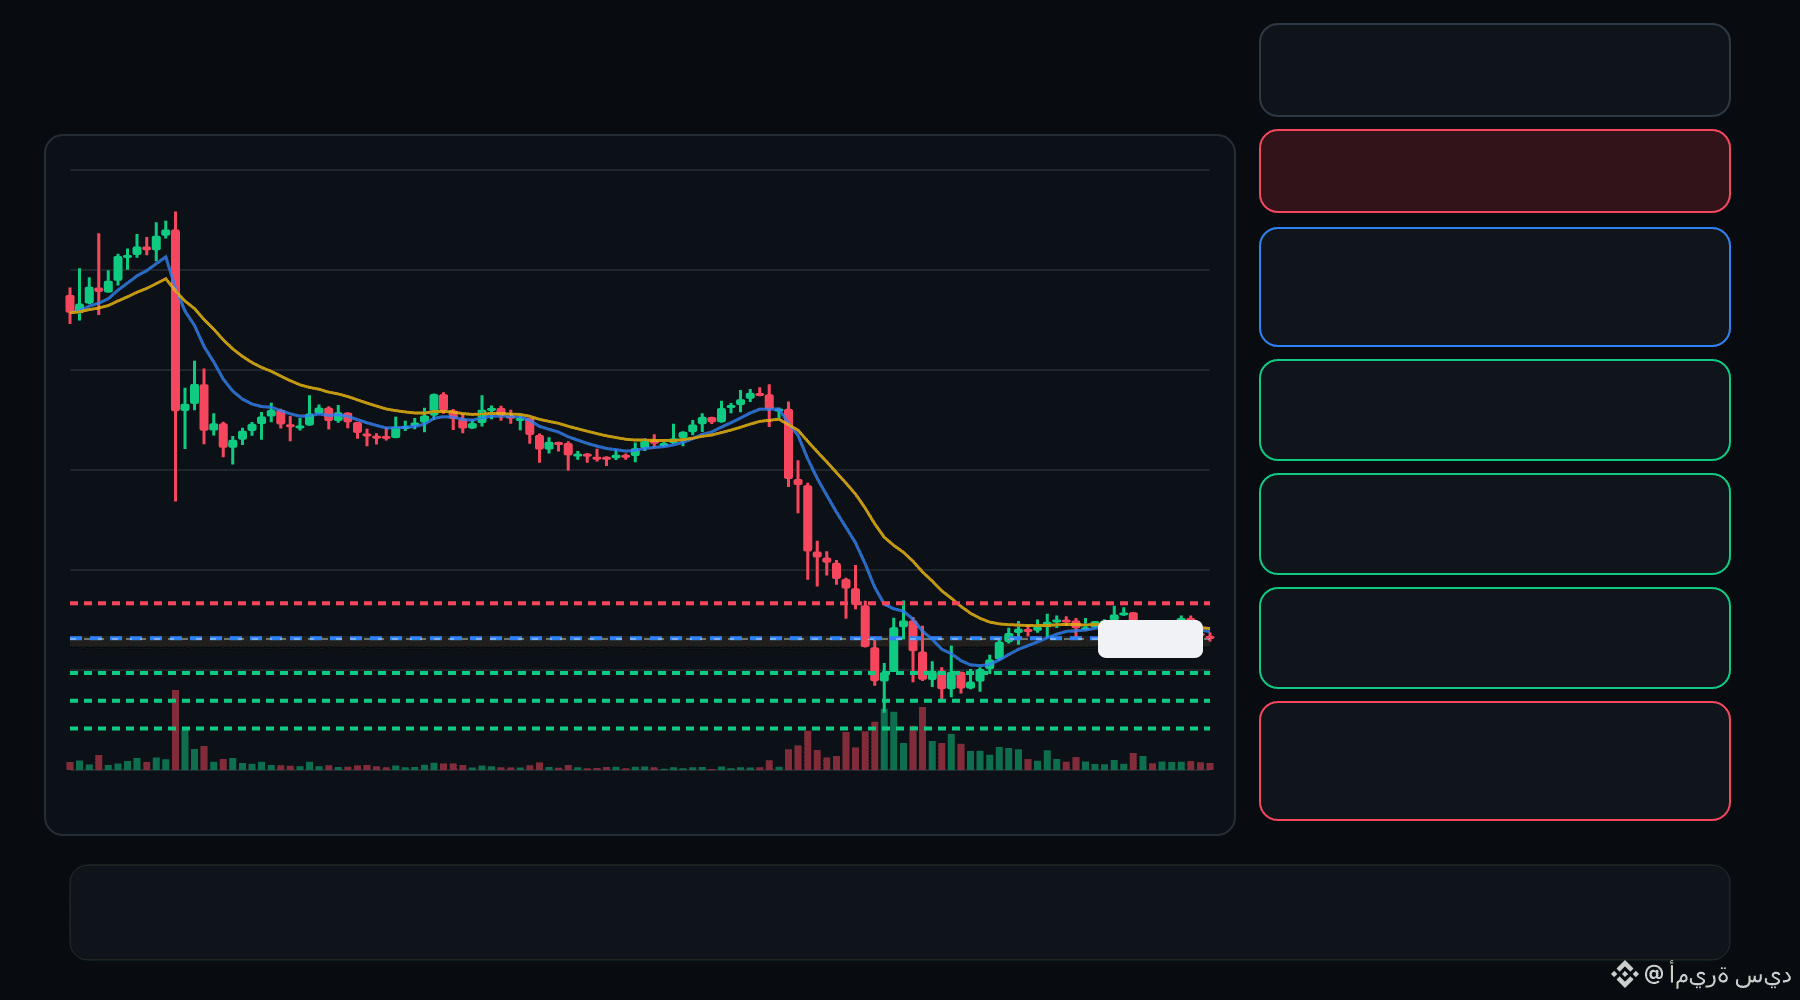
🔴 Q bears are pressing the pullback… is the rejection getting deeper ⁉️
🔴 Q SHORT
Entry: 0.03146 – 0.03175
TP1: 0.02909
TP2: 0.02707
TP3: 0.02505
Stop Loss: 0.03412
The 15M chart shows a bearish structure with momentum and volume confirmation. A controlled retest of the entry zone may give the setup a cleaner trigger.
Plan: Wait for confirmation/rejection inside the entry zone; don’t chase the move.
DYOR | Manage Risk | Avoid Over-Leverage
3
·
--
Voir la traduction
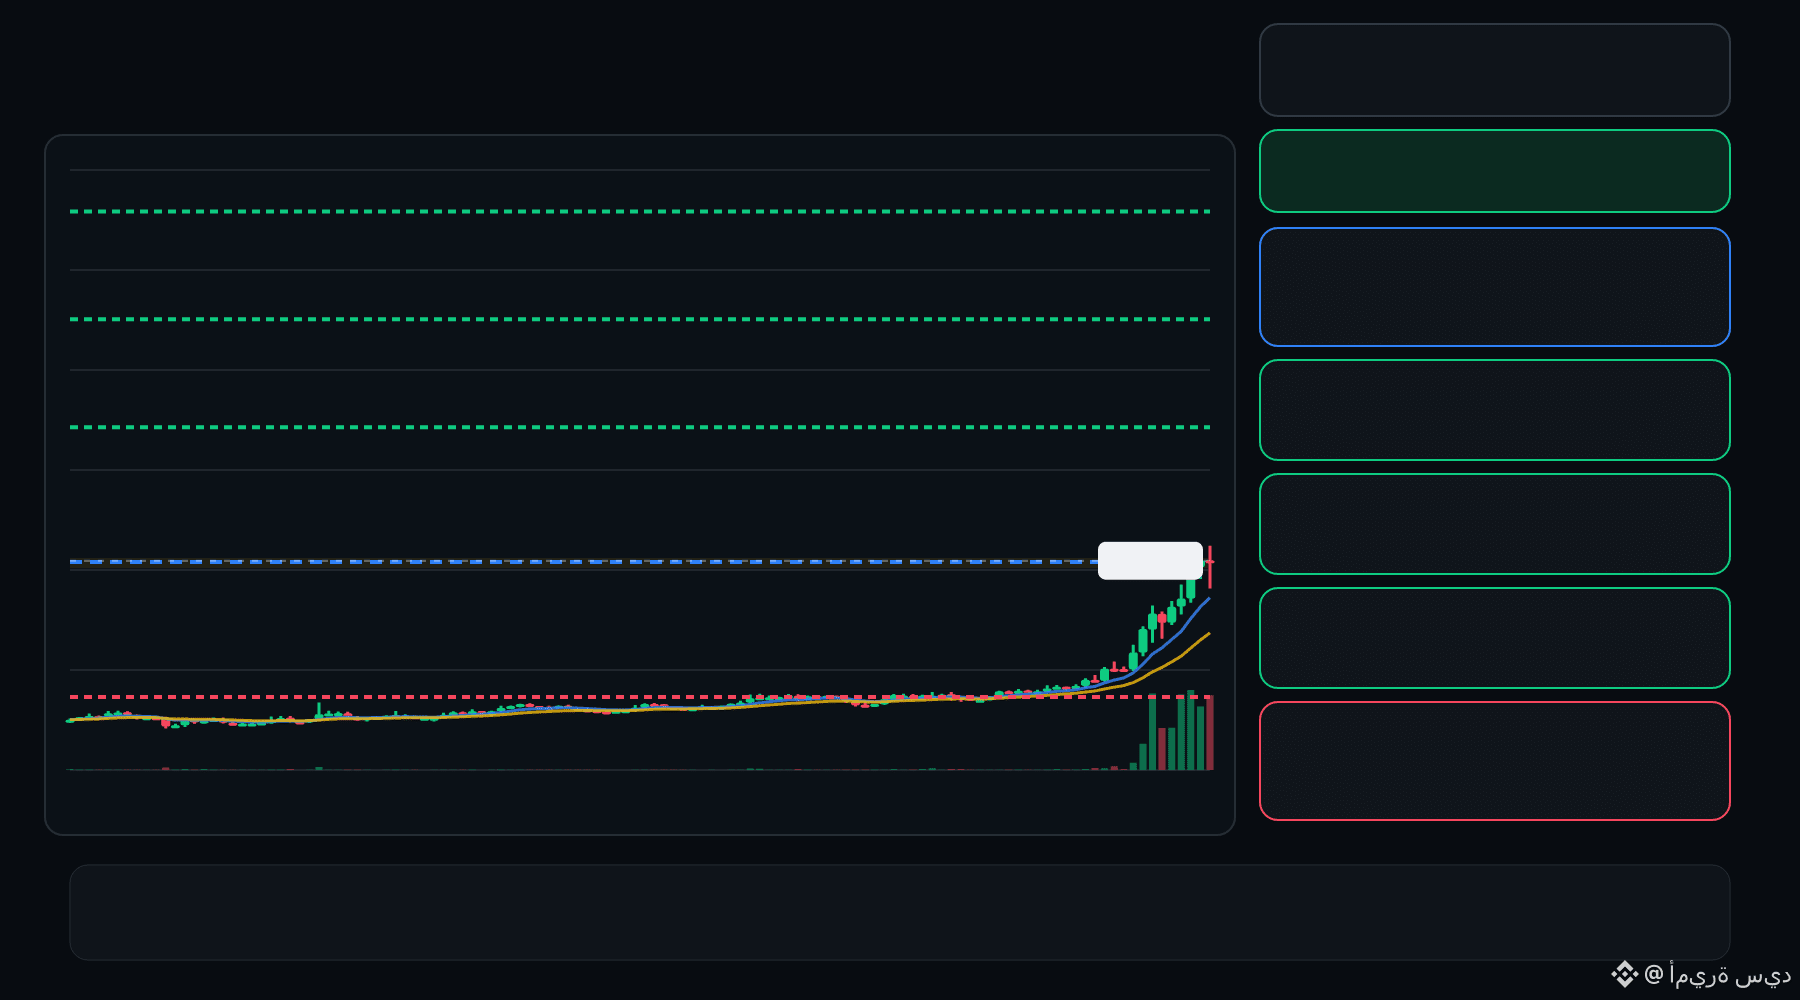
🟢 AIOT bulls are defending the pullback… is continuation setting up ⁉️
🟩 AIOT LONG
Entry: 0.09127 – 0.09235
TP1: 0.1111
TP2: 0.1265
TP3: 0.1420
Stop Loss: 0.07252
The 15M chart shows a bullish structure with momentum and volume confirmation. A controlled retest of the entry zone may give the setup a cleaner trigger.
Plan: Wait for confirmation/rejection inside the entry zone; don’t chase the move.
DYOR | Manage Risk | Avoid Over-Leverage
·
--
Voir la traduction
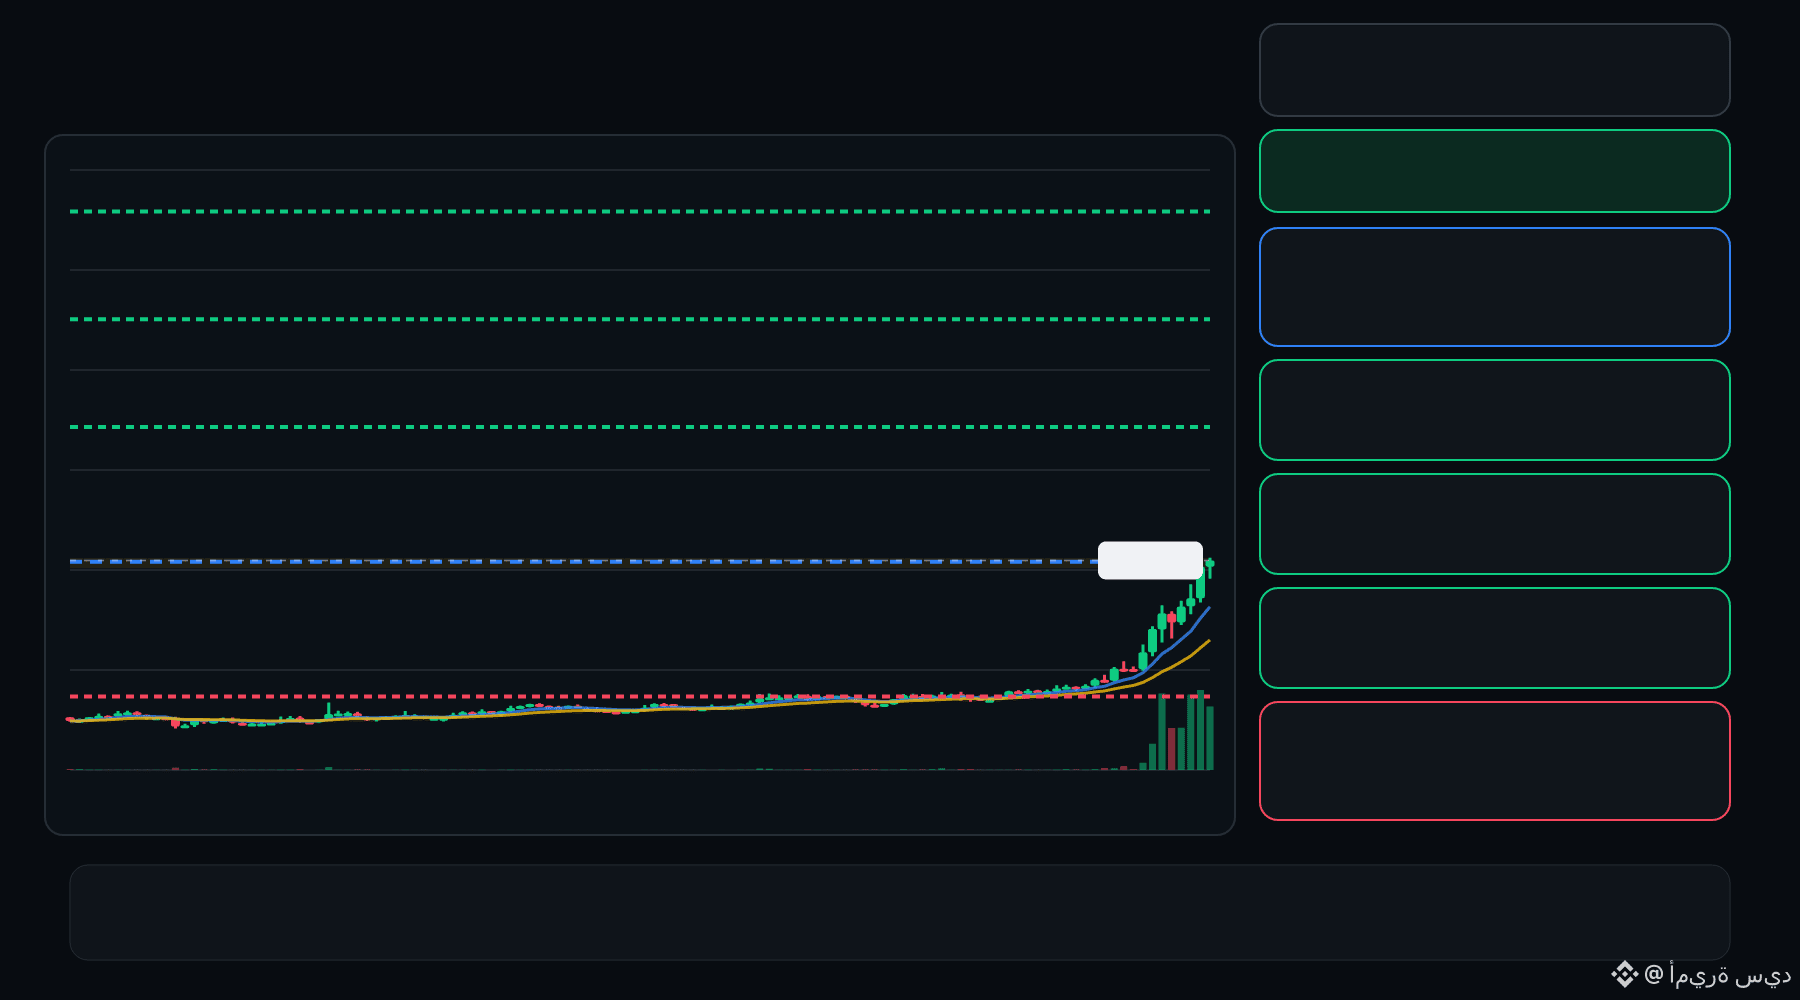
🟢 AIOT bulls are defending the pullback… is continuation setting up ⁉️
🟩 AIOT LONG
Entry: 0.09134 – 0.09230
TP1: 0.1110
TP2: 0.1264
TP3: 0.1418
Stop Loss: 0.07259
The 15M chart shows a bullish structure with momentum and volume confirmation. A controlled retest of the entry zone may give the setup a cleaner trigger.
Plan: Wait for confirmation/rejection inside the entry zone; don’t chase the move.
DYOR | Manage Risk | Avoid Over-Leverage
·
--
Voir la traduction
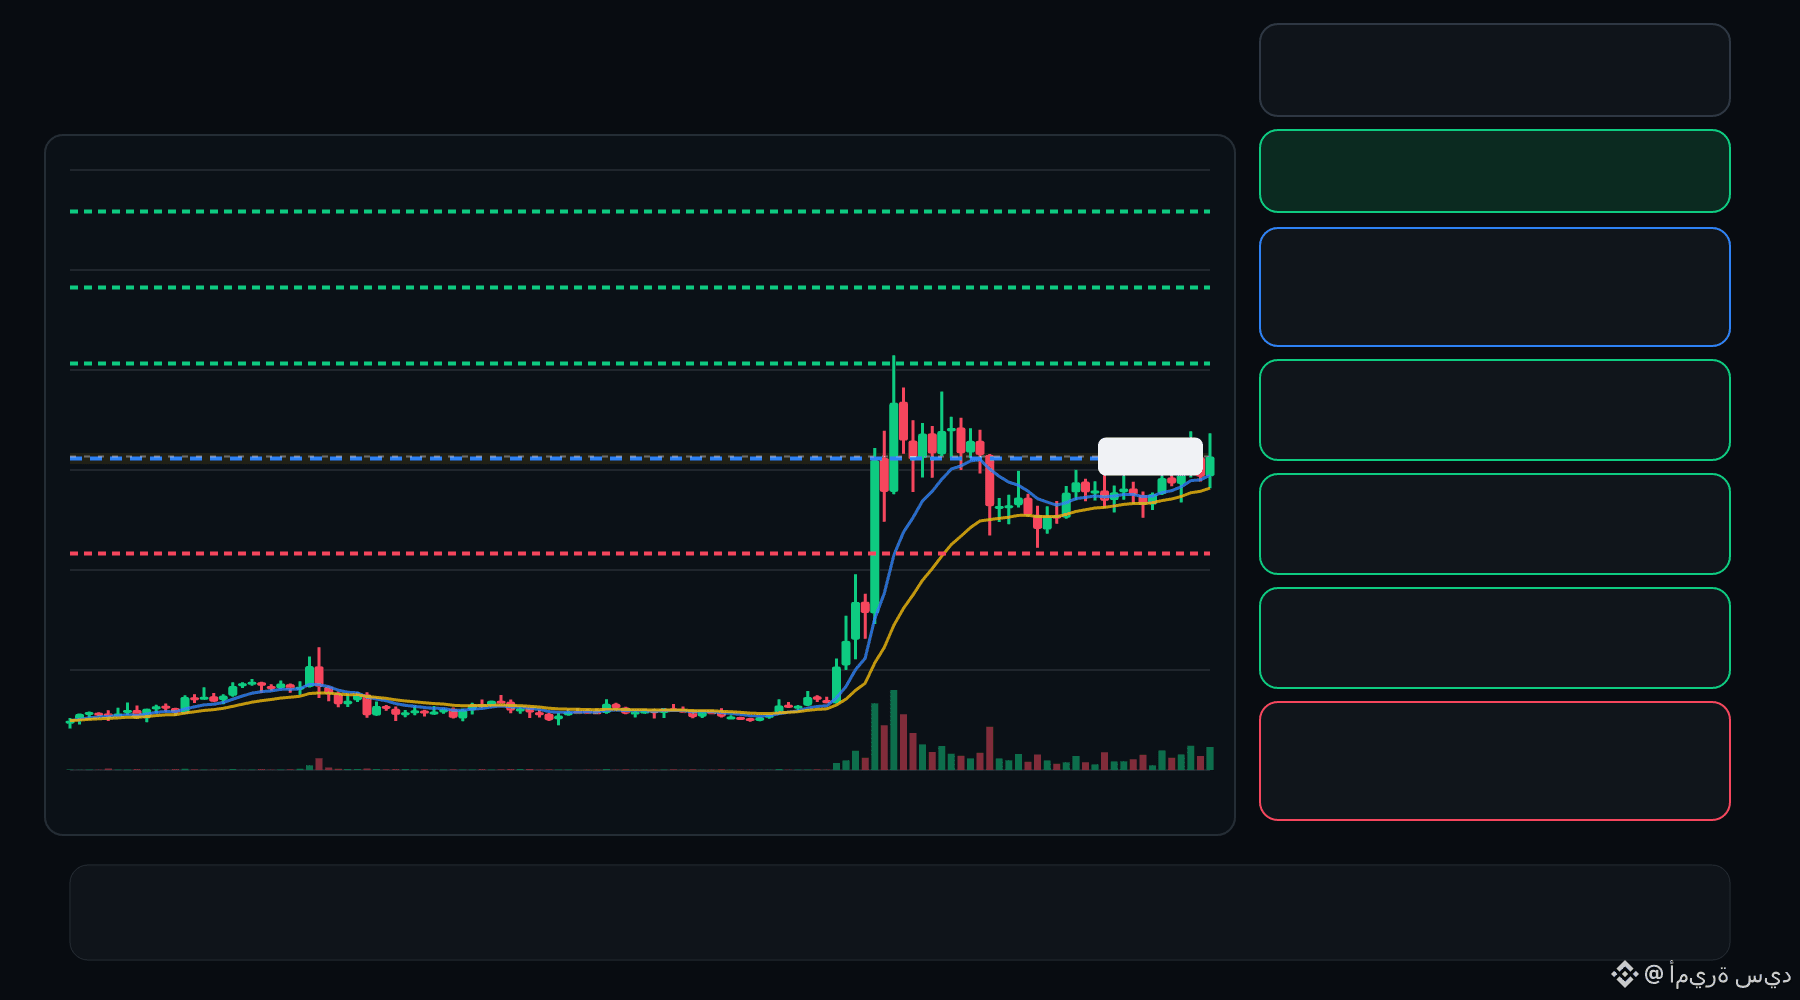
🟢 WET bulls are defending the pullback… is continuation setting up ⁉️
🟩 WET LONG
Entry: 0.06277 – 0.06322
TP1: 0.06705
TP2: 0.07030
TP3: 0.07355
Stop Loss: 0.05894
The 15M chart shows a bullish structure with momentum and volume confirmation. A controlled retest of the entry zone may give the setup a cleaner trigger.
Plan: Wait for confirmation/rejection inside the entry zone; don’t chase the move.
DYOR | Manage Risk | Avoid Over-Leverage
1
·
--
Voir la traduction
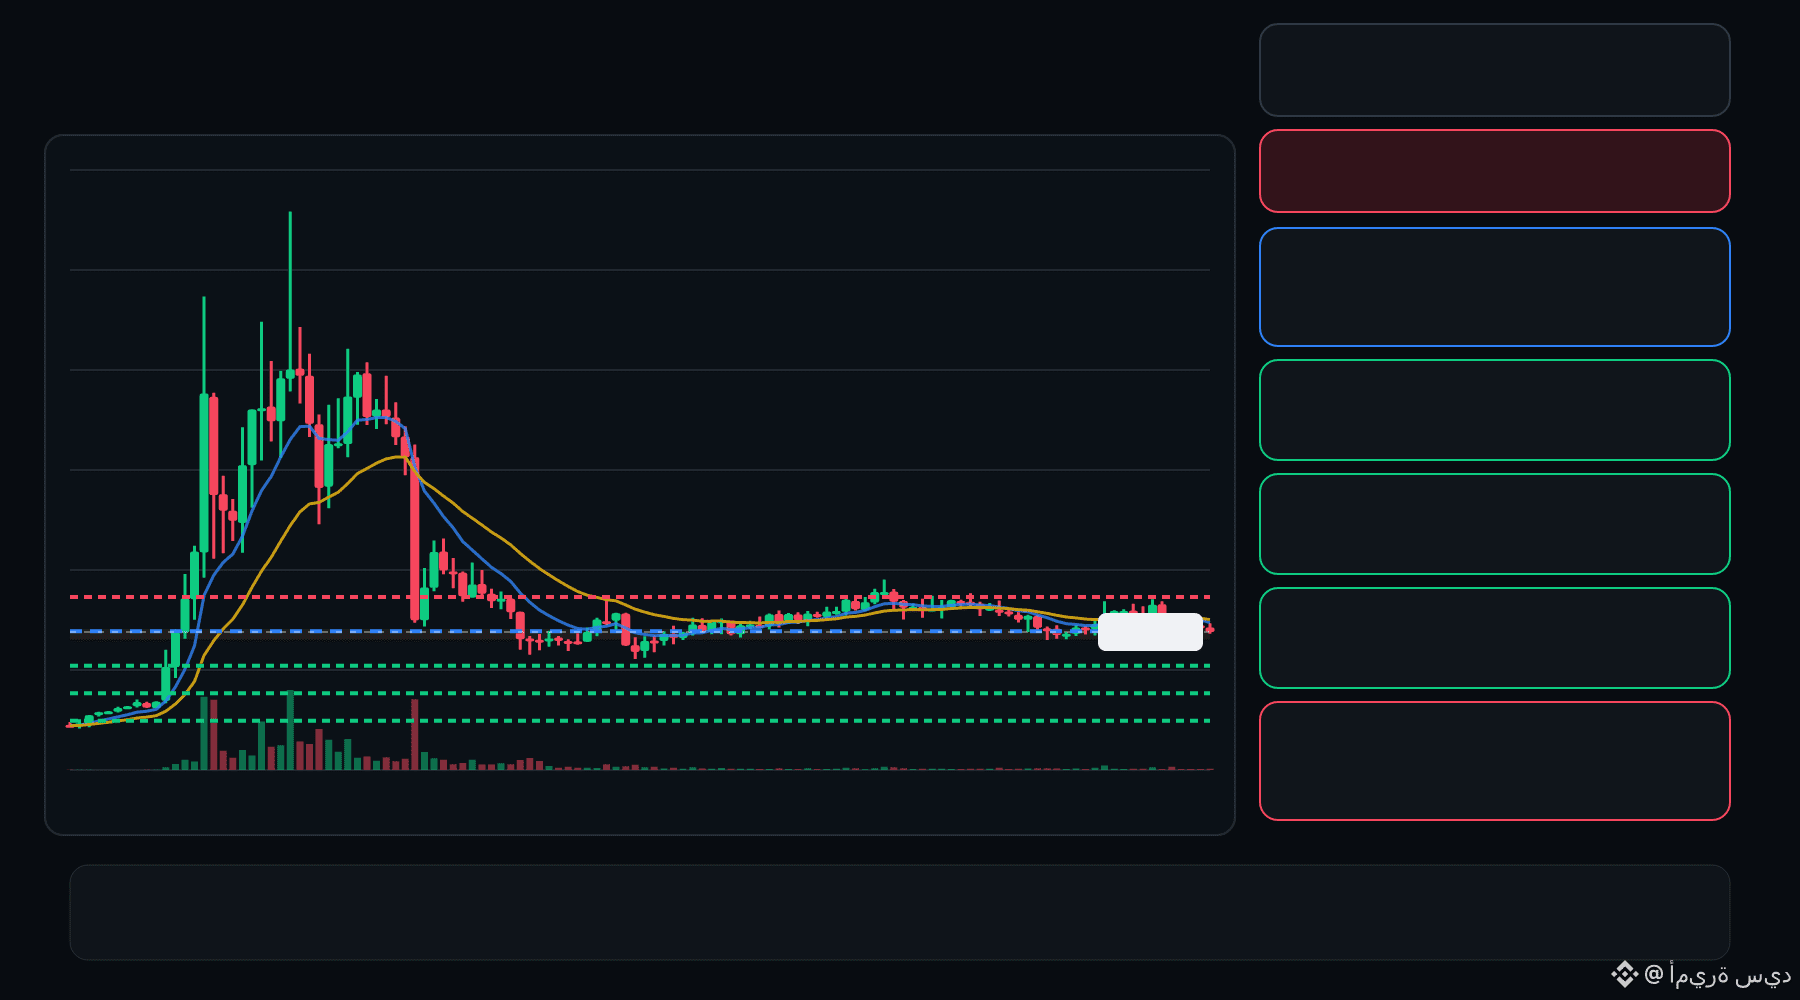
🔴 ALPINE bears are pressing the pullback… is the rejection getting deeper ⁉️
🔴 ALPINE SHORT
Entry: 0.2999 – 0.3009
TP1: 0.2922
TP2: 0.2857
TP3: 0.2792
Stop Loss: 0.3085
The 15M chart shows a bearish structure with momentum and volume confirmation. A controlled retest of the entry zone may give the setup a cleaner trigger.
Plan: Wait for confirmation/rejection inside the entry zone; don’t chase the move.
DYOR | Manage Risk | Avoid Over-Leverage
·
--
Voir la traduction
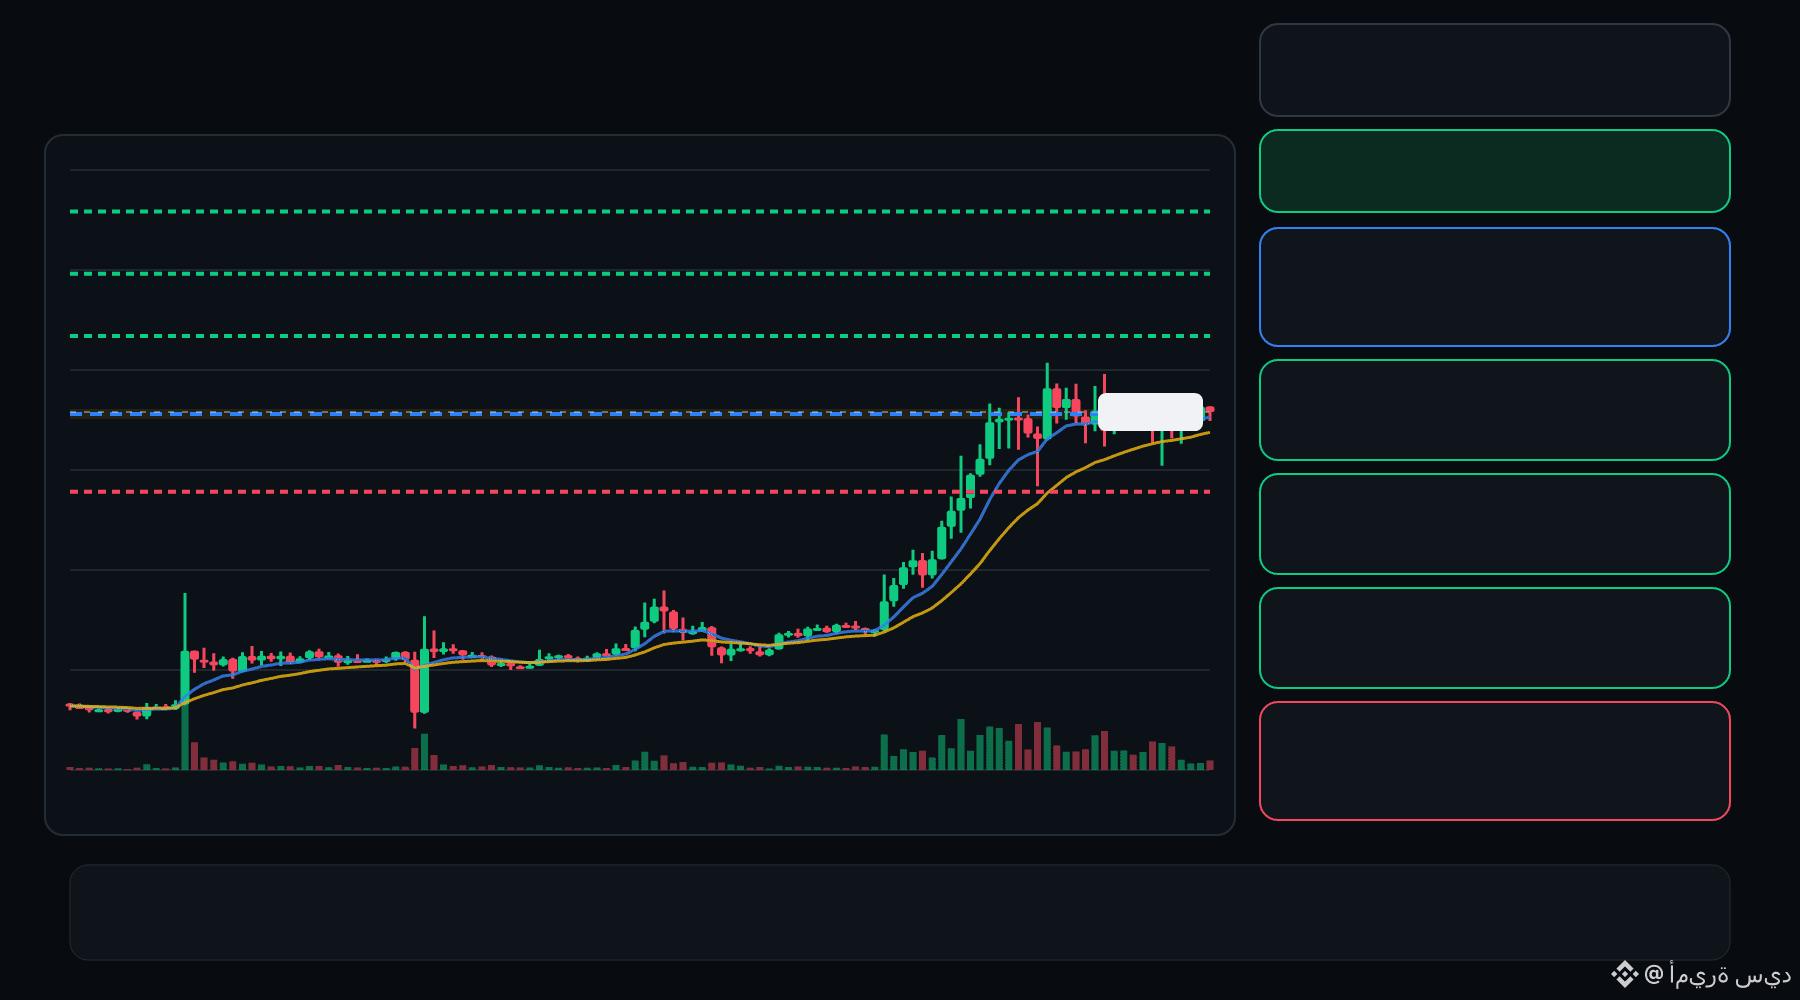
🟢 AIN bulls are defending the pullback… is continuation setting up ⁉️
🟩 AIN LONG
Entry: 0.2694 – 0.2735
TP1: 0.3038
TP2: 0.3297
TP3: 0.3556
Stop Loss: 0.2390
The 15M chart shows a bullish structure with momentum and volume confirmation. A controlled retest of the entry zone may give the setup a cleaner trigger.
Plan: Wait for confirmation/rejection inside the entry zone; don’t chase the move.
DYOR | Manage Risk | Avoid Over-Leverage
2
·
--
Voir la traduction
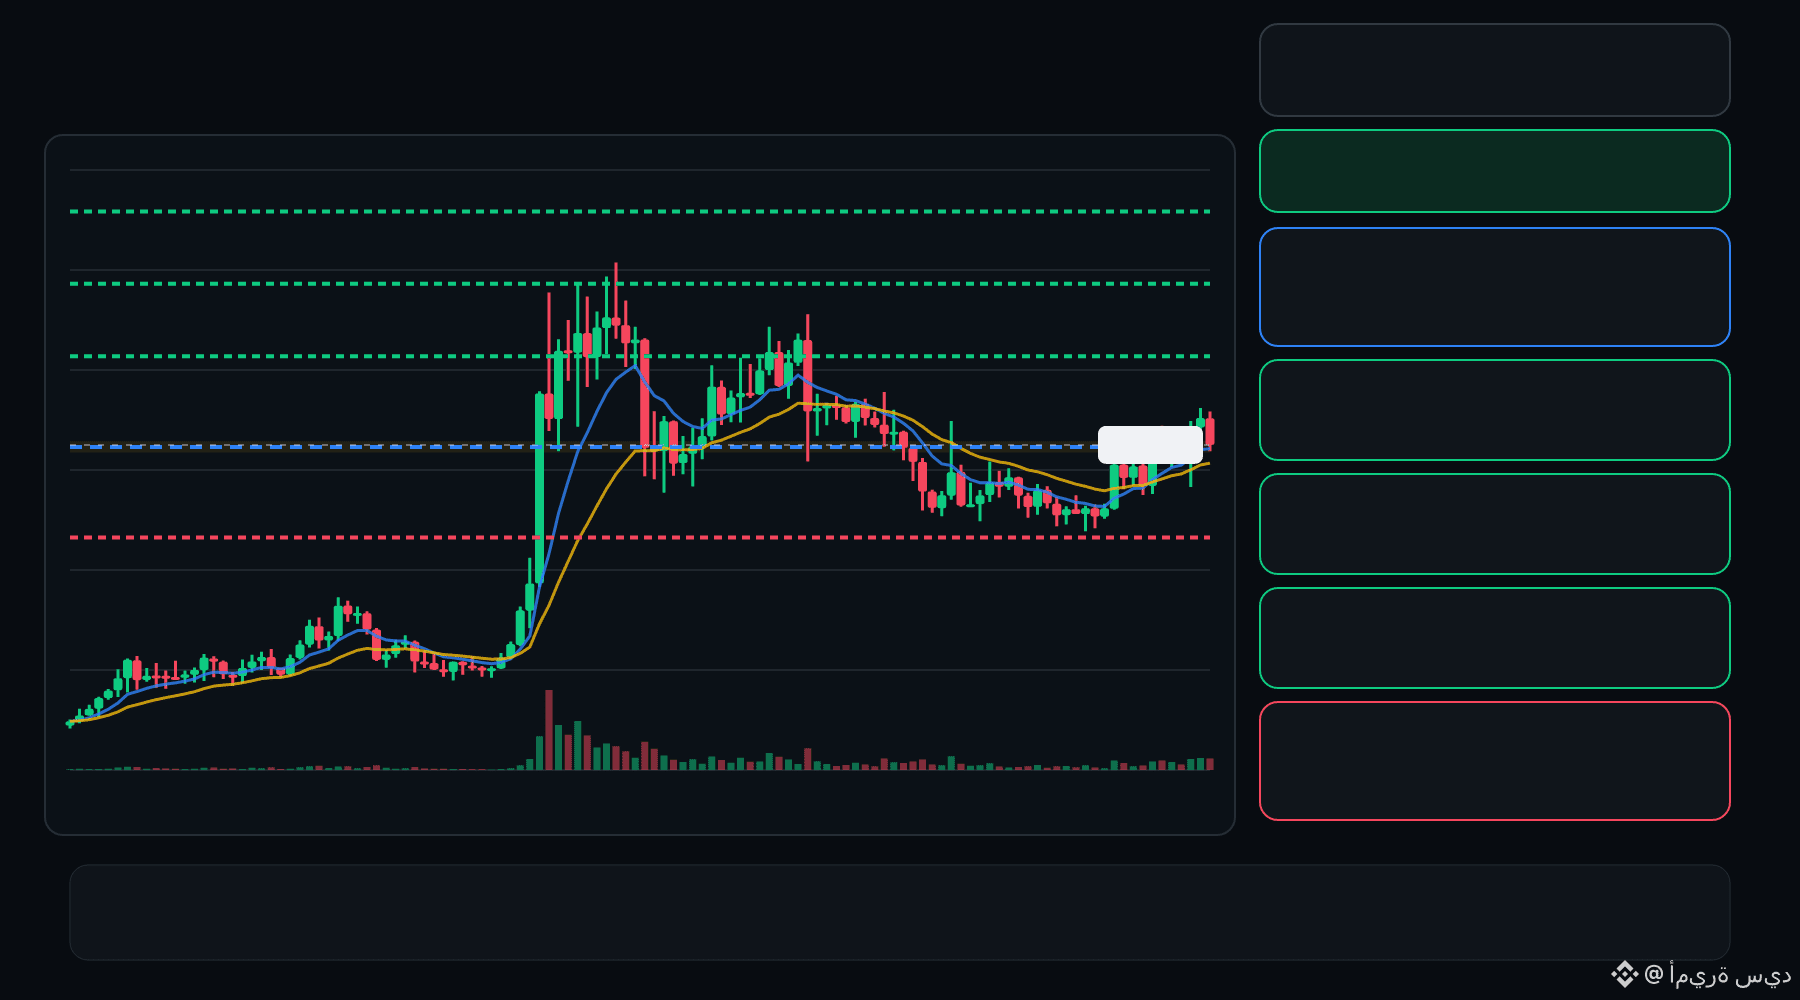
🟢 BIRB bulls are defending the pullback… is continuation setting up ⁉️
🟩 BIRB LONG
Entry: 0.09015 – 0.09098
TP1: 0.09728
TP2: 0.1026
TP3: 0.1080
Stop Loss: 0.08385
The 15M chart shows a bullish structure with momentum and volume confirmation. A controlled retest of the entry zone may give the setup a cleaner trigger.
Plan: Wait for confirmation/rejection inside the entry zone; don’t chase the move.
DYOR | Manage Risk | Avoid Over-Leverage
1
·
--
Voir la traduction
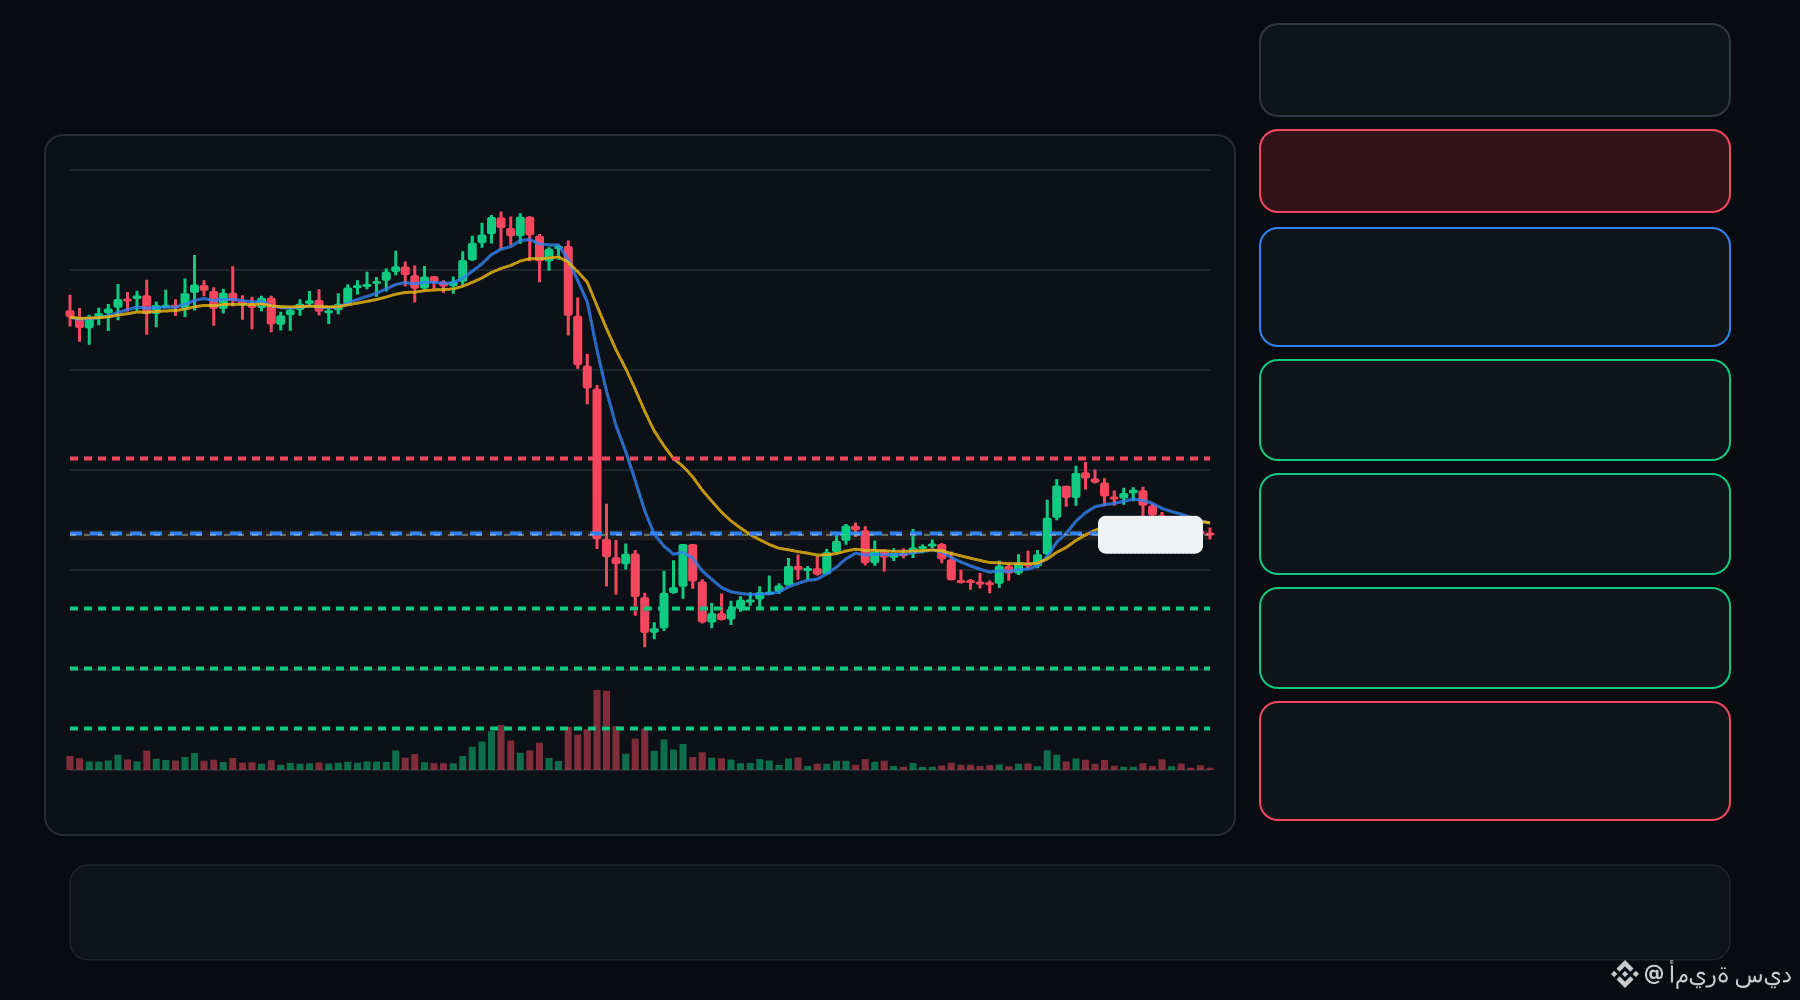
🔴 BLESS bears are pressing the pullback… is the rejection getting deeper ⁉️
🔴 BLESS SHORT
Entry: 0.009885 – 0.009963
TP1: 0.008988
TP2: 0.008240
TP3: 0.007492
Stop Loss: 0.01086
The 15M chart shows a bearish structure with momentum and volume confirmation. A controlled retest of the entry zone may give the setup a cleaner trigger.
Plan: Wait for confirmation/rejection inside the entry zone; don’t chase the move.
DYOR | Manage Risk | Avoid Over-Leverage
·
--
Voir la traduction
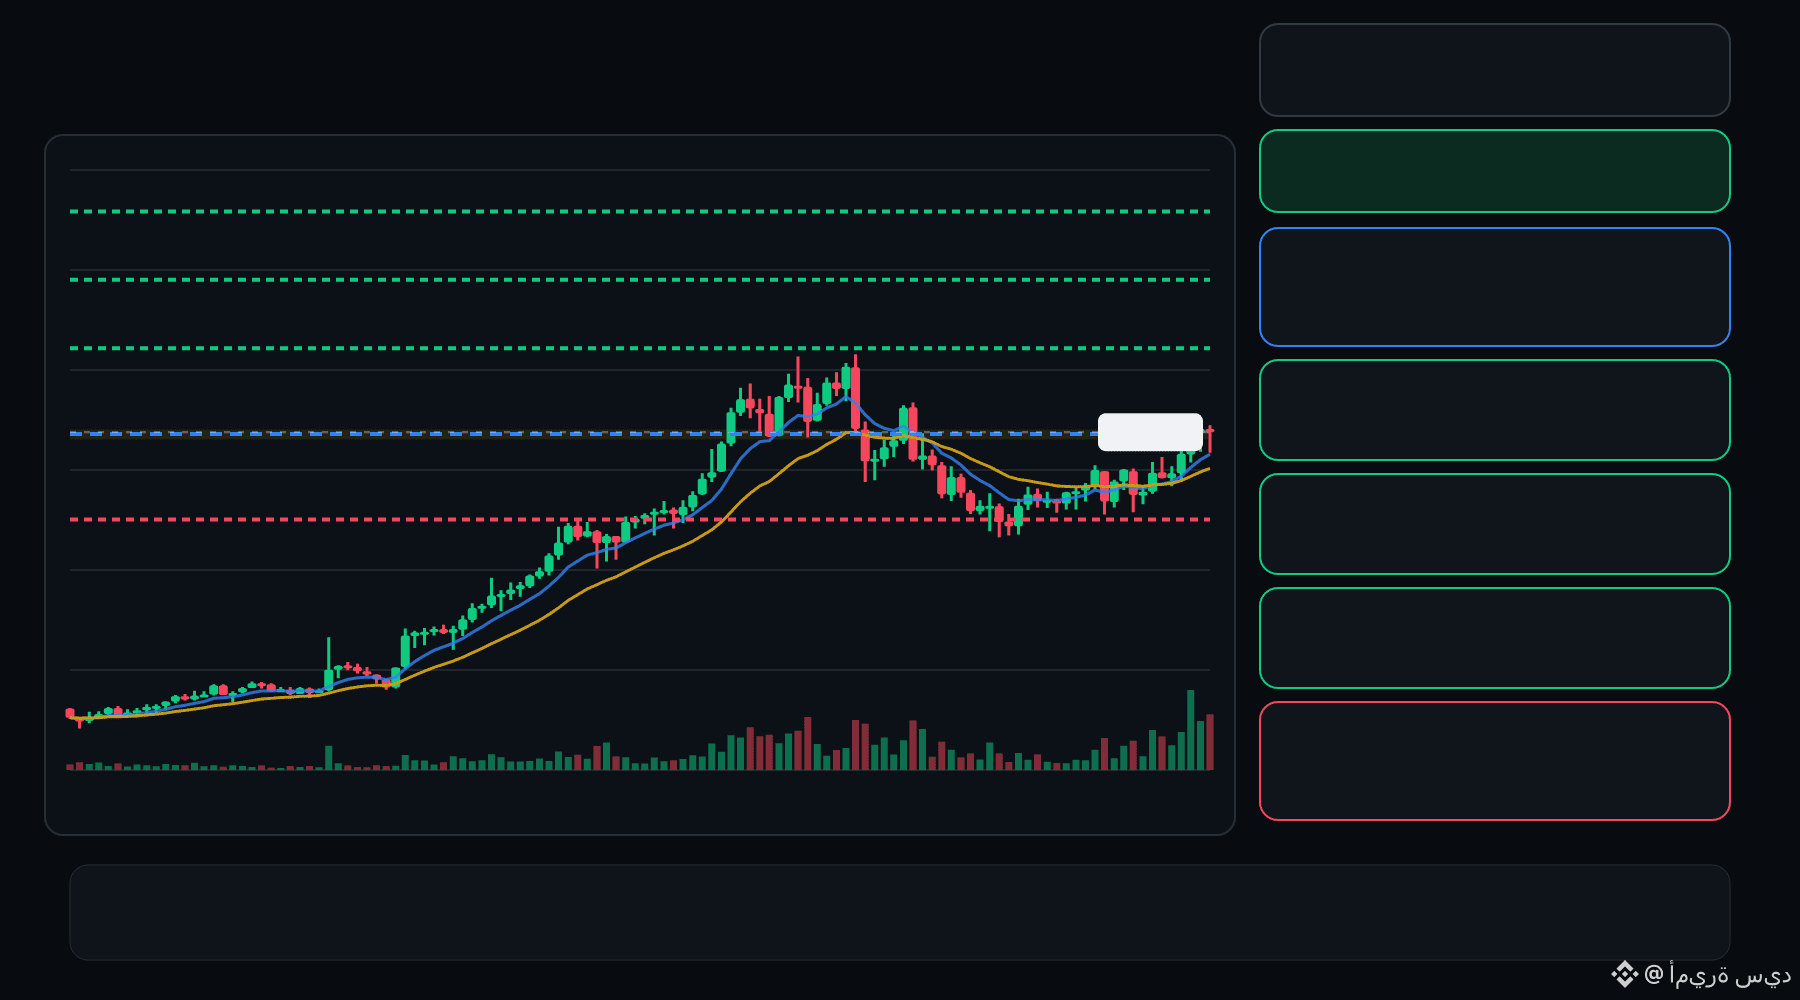
🟢 GWEI bulls are defending the pullback… is continuation setting up ⁉️
🟩 GWEI LONG
Entry: 0.02272 – 0.02288
TP1: 0.02438
TP2: 0.02565
TP3: 0.02691
Stop Loss: 0.02122
The 15M chart shows a bullish structure with momentum and volume confirmation. A controlled retest of the entry zone may give the setup a cleaner trigger.
Plan: Wait for confirmation/rejection inside the entry zone; don’t chase the move.
DYOR | Manage Risk | Avoid Over-Leverage
·
--
Voir la traduction
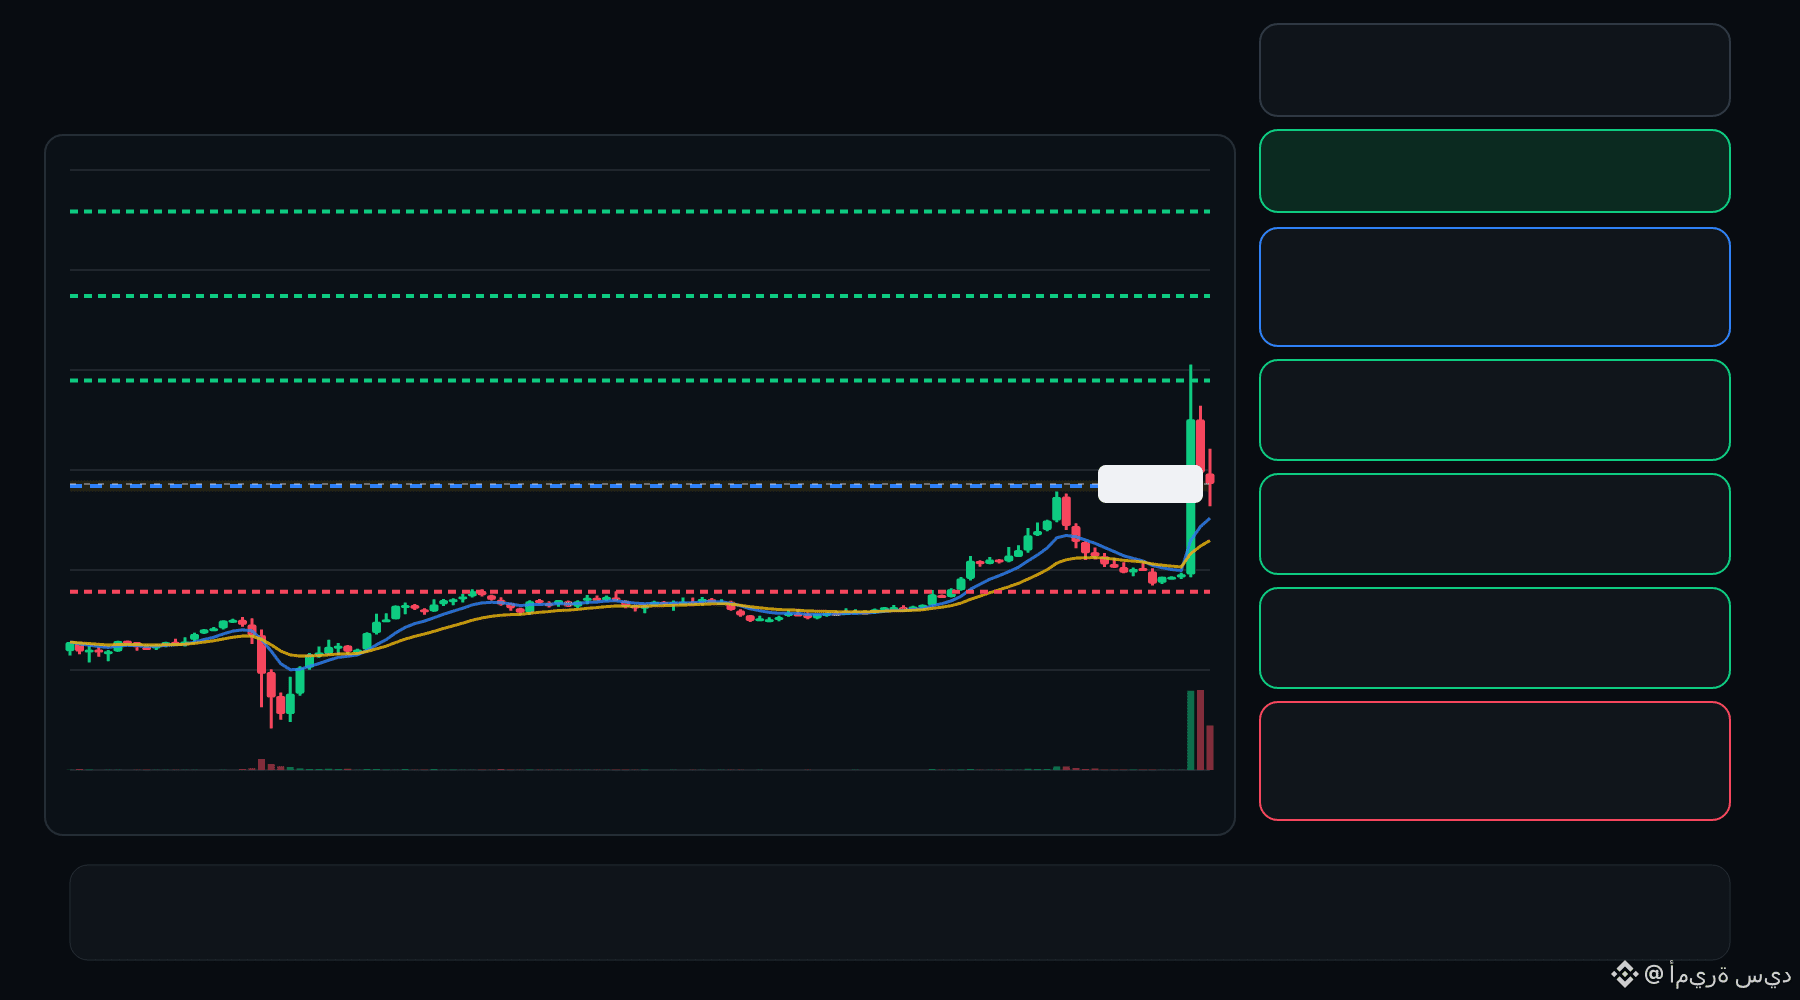
🟢 SLP bulls are defending the pullback… is continuation setting up ⁉️
🟩 SLP LONG
Entry: 0.0005468 – 0.0005516
TP1: 0.0005957
TP2: 0.0006329
TP3: 0.0006701
Stop Loss: 0.0005027
The 15M chart shows a bullish structure with momentum and volume confirmation. A controlled retest of the entry zone may give the setup a cleaner trigger.
Plan: Wait for confirmation/rejection inside the entry zone; don’t chase the move.
DYOR | Manage Risk | Avoid Over-Leverage
4
·
--
Voir la traduction
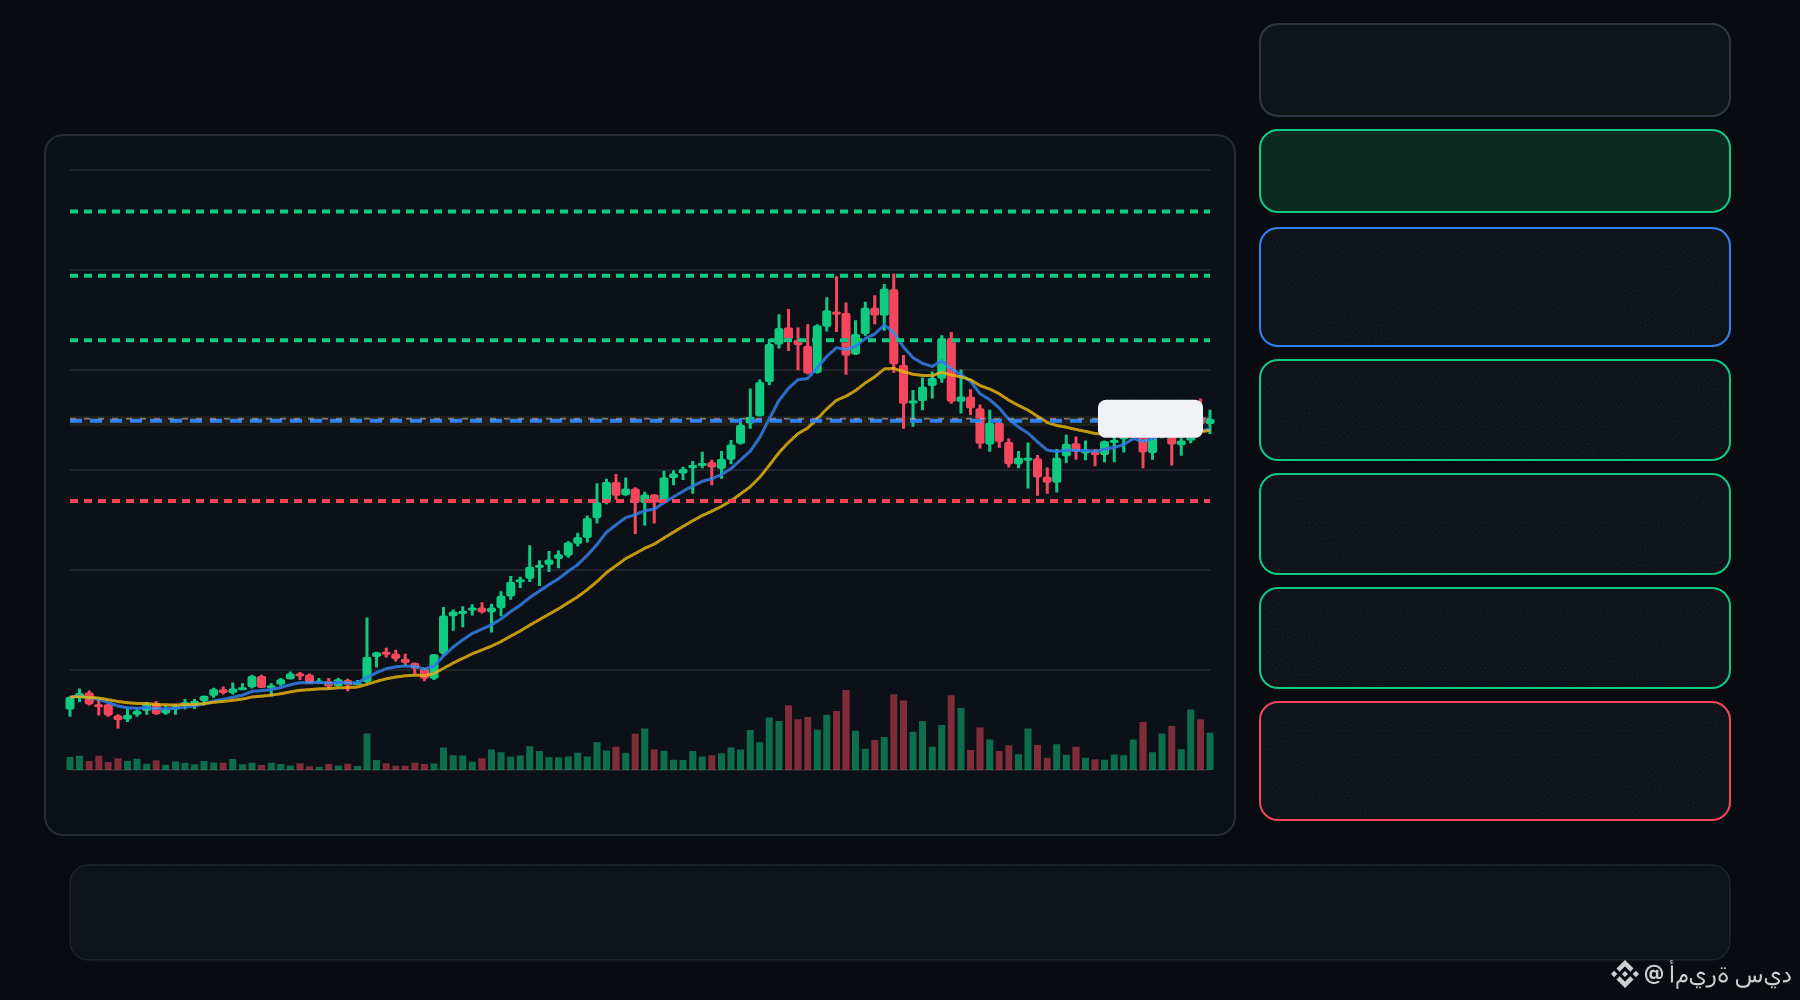
🟢 GWEI bulls are defending the pullback… is continuation setting up ⁉️
🟩 GWEI LONG
Entry: 0.02196 – 0.02210
TP1: 0.02326
TP2: 0.02424
TP3: 0.02521
Stop Loss: 0.02081
The 15M chart shows a bullish structure with momentum and volume confirmation. A controlled retest of the entry zone may give the setup a cleaner trigger.
Plan: Wait for confirmation/rejection inside the entry zone; don’t chase the move.
DYOR | Manage Risk | Avoid Over-Leverage
·
--
Voir la traduction
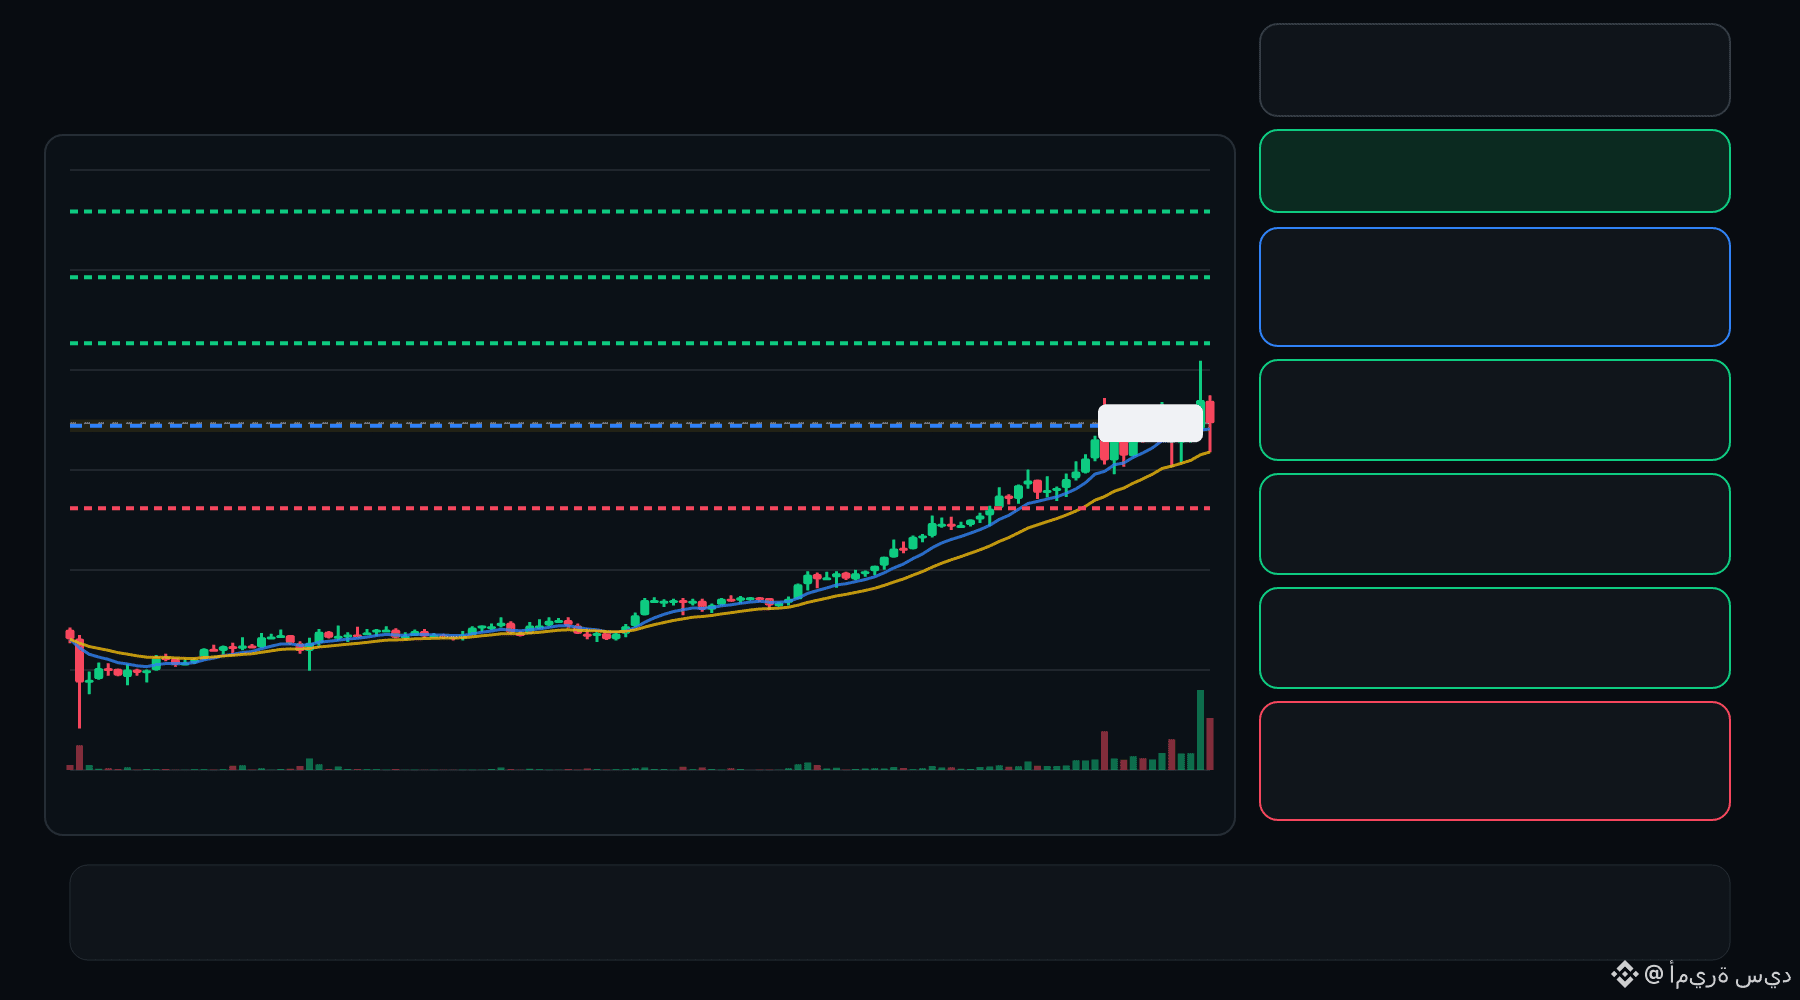
🟢 SPK bulls are defending the pullback… is continuation setting up ⁉️
🟩 SPK LONG
Entry: 0.02006 – 0.02025
TP1: 0.02135
TP2: 0.02231
TP3: 0.02327
Stop Loss: 0.01896
The 15M chart shows a bullish structure with momentum and volume confirmation. A controlled retest of the entry zone may give the setup a cleaner trigger.
Plan: Wait for confirmation/rejection inside the entry zone; don’t chase the move.
DYOR | Manage Risk | Avoid Over-Leverage
·
--
Voir la traduction
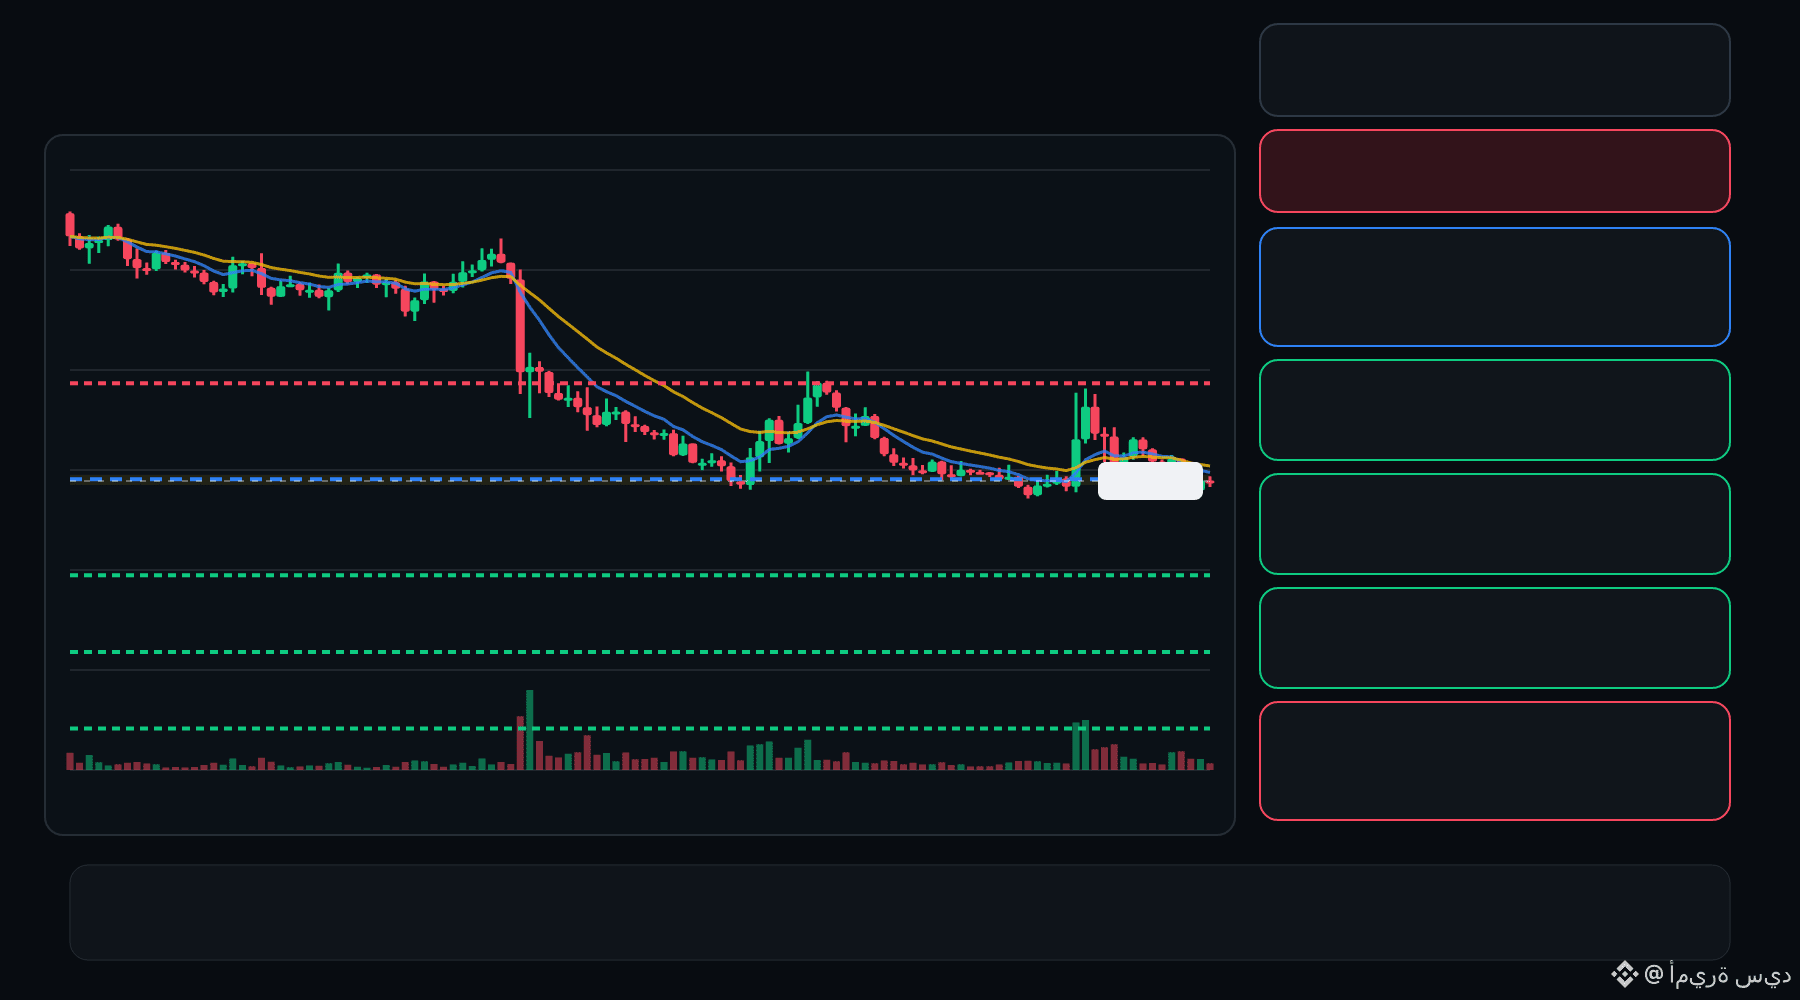
🔴 BTW bears are pressing the pullback… is the rejection getting deeper ⁉️
🔴 BTW SHORT
Entry: 1.129 – 1.145
TP1: 0.9686
TP2: 0.8338
TP3: 0.6990
Stop Loss: 1.306
The 15M chart shows a bearish structure with momentum and volume confirmation. A controlled retest of the entry zone may give the setup a cleaner trigger.
Plan: Wait for confirmation/rejection inside the entry zone; don’t chase the move.
DYOR | Manage Risk | Avoid Over-Leverage
9
·
--
Voir la traduction
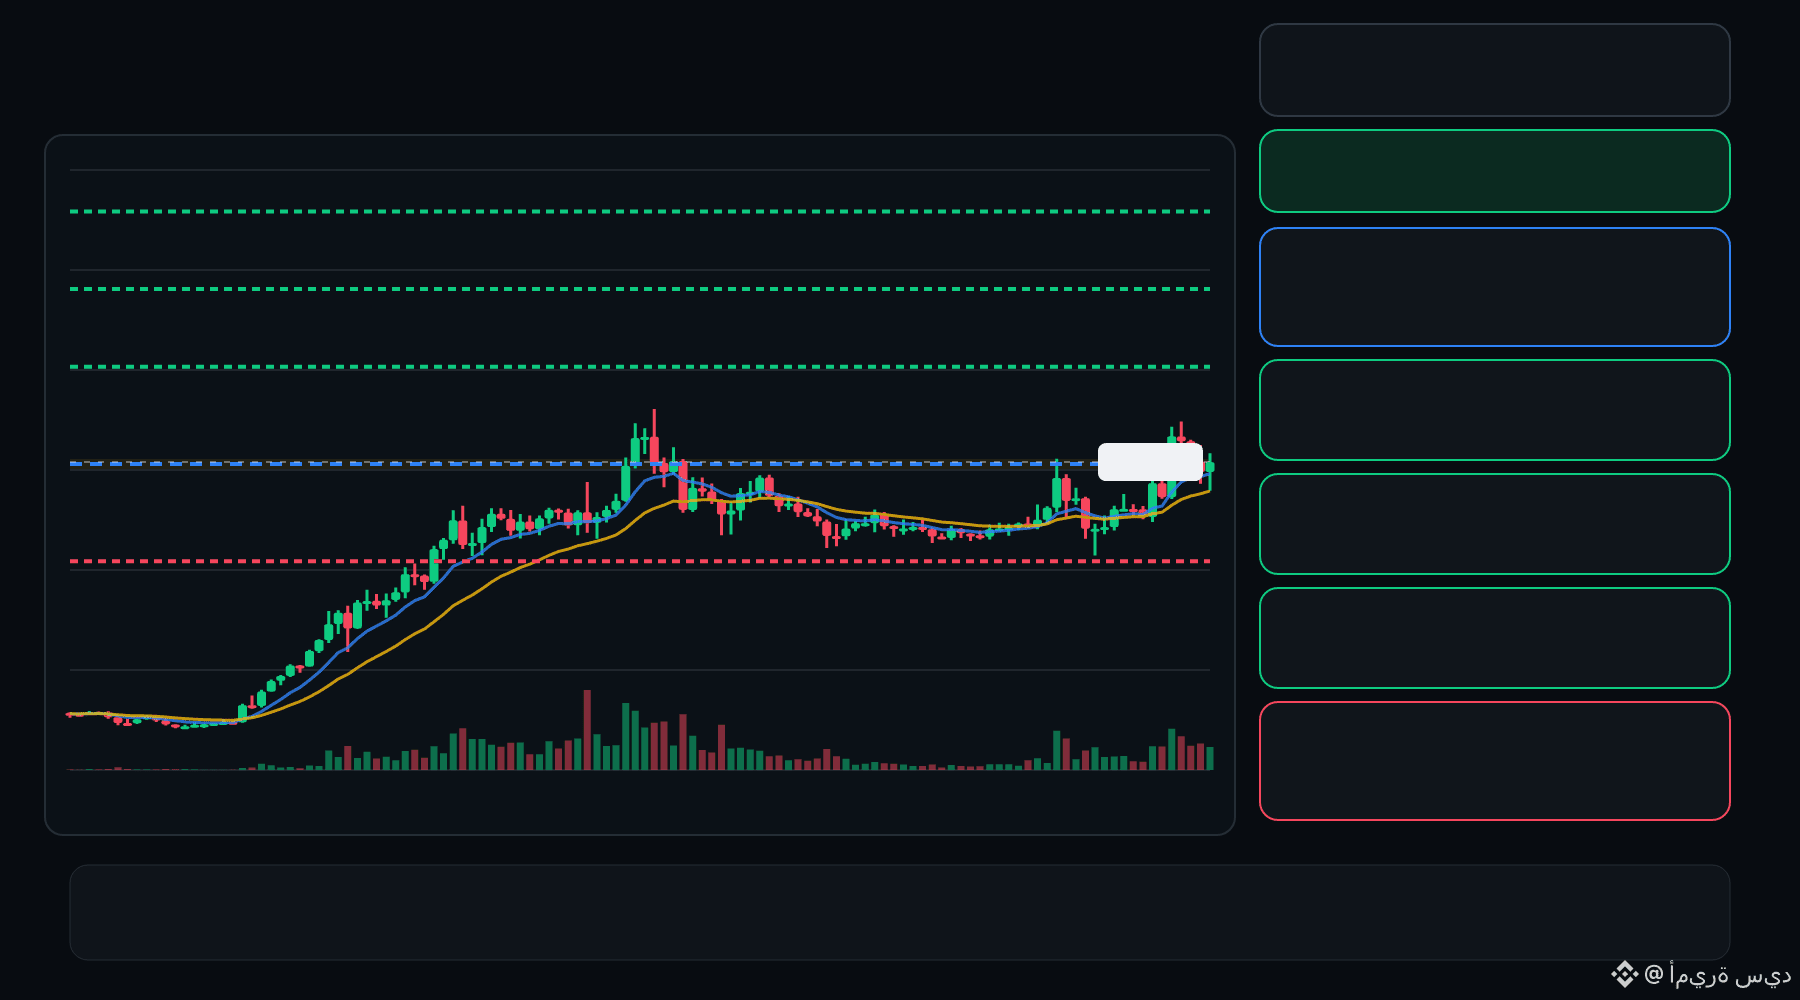
🟢 BEAMX bulls are defending the pullback… is continuation setting up ⁉️
🟩 BEAMX LONG
Entry: 0.005018 – 0.005088
TP1: 0.005724
TP2: 0.006261
TP3: 0.006798
Stop Loss: 0.004382
The 15M chart shows a bullish structure with momentum and volume confirmation. A controlled retest of the entry zone may give the setup a cleaner trigger.
Plan: Wait for confirmation/rejection inside the entry zone; don’t chase the move.
DYOR | Manage Risk | Avoid Over-Leverage
2
·
--
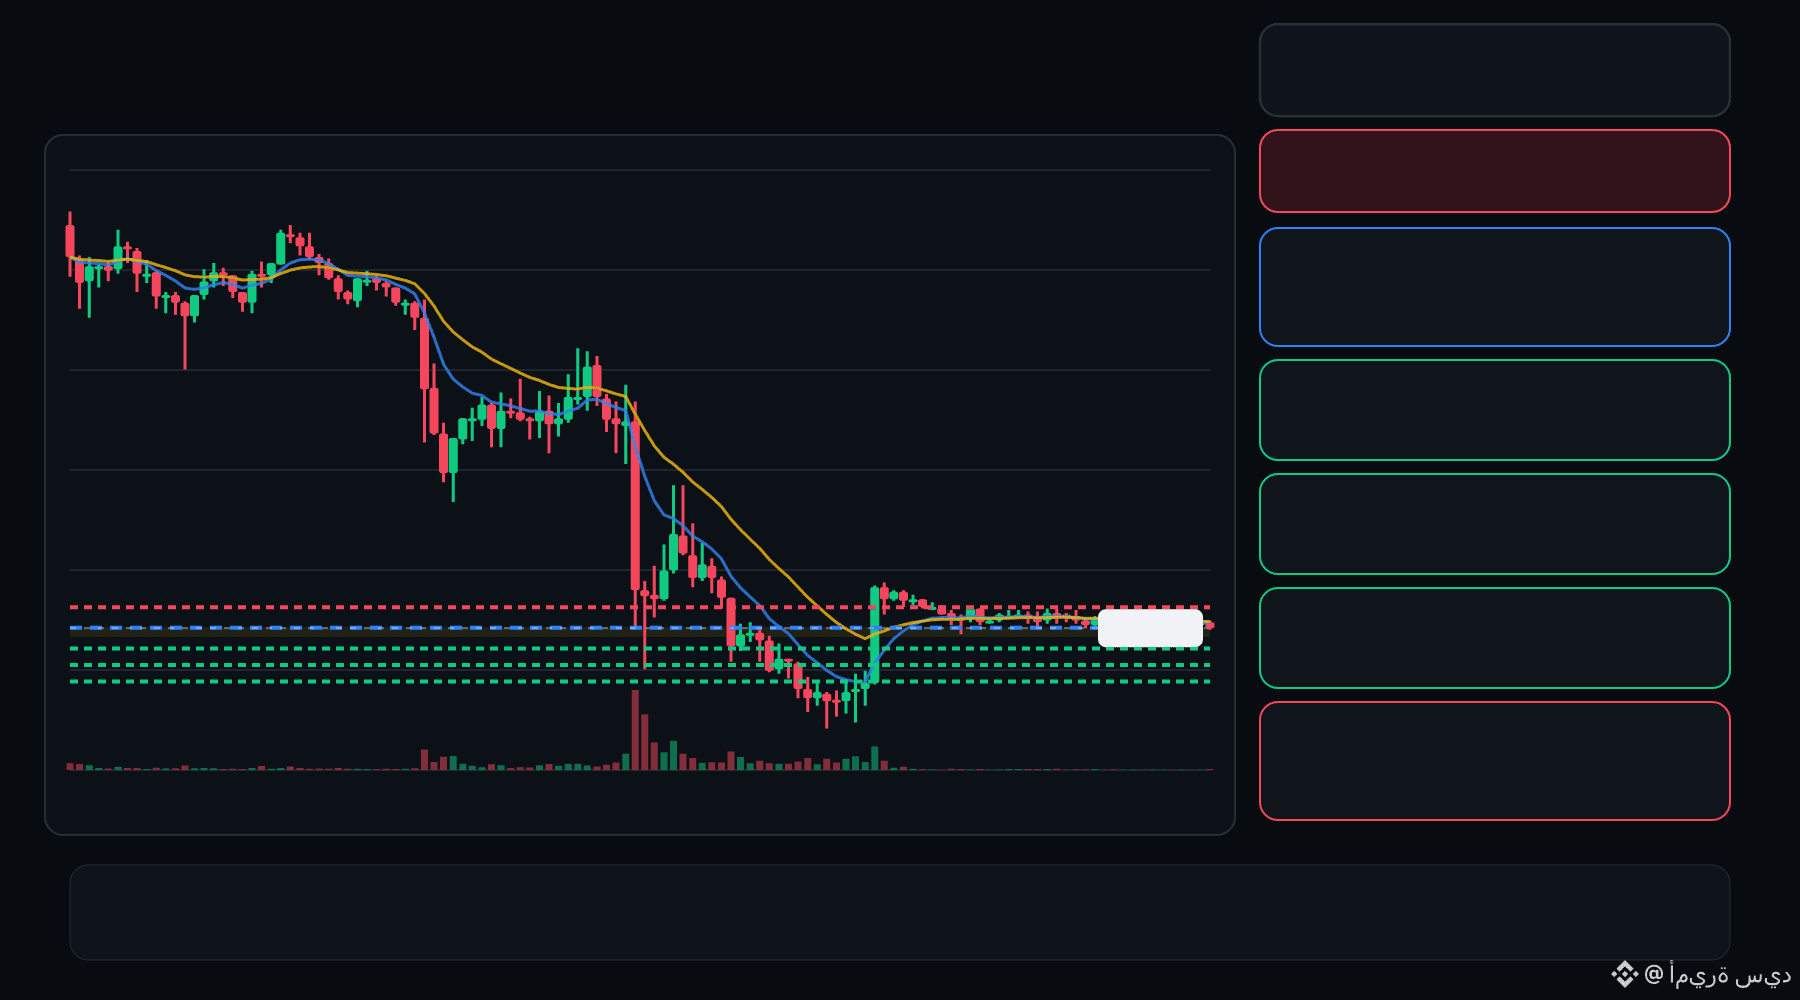
🔴 Les vendeurs d’INTW mettent la pression sur le rebond… le rejet s’accentue-t-il ⁉️
🔴 INTW SHORT
Entrée : 7.265 – 7.280
TP1 : 7.137
TP2 : 7.029
TP3 : 6.920
Stop loss : 7.408
Le graphique en 15 min montre une structure baissière, confirmée par le momentum et le volume. Un nouveau test maîtrisé de la zone d’entrée pourrait offrir un signal de déclenchement plus net.
Plan : attendre une confirmation/un rejet dans la zone d’entrée ; ne pas courir après le mouvement.
Faites vos propres recherches | Gérez le risque | Évitez un effet de levier excessif
1
·
--
Voir la traduction
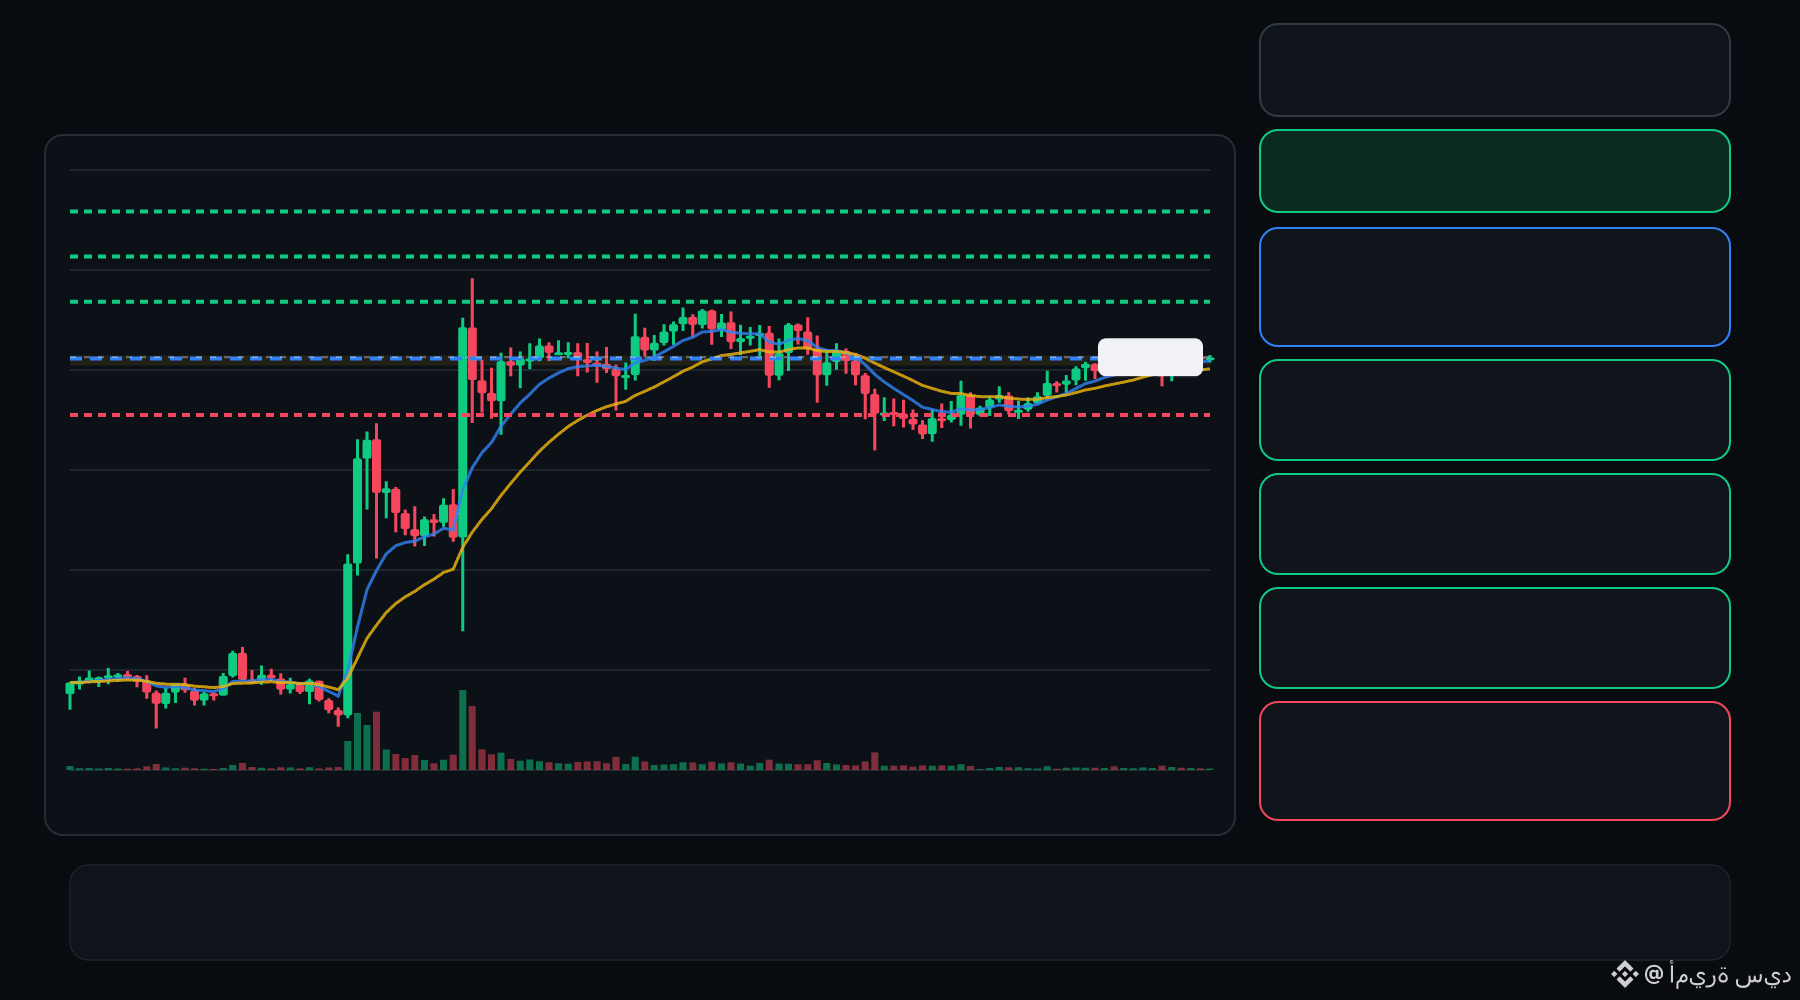
🟢 MAGMA bulls are defending the pullback… is continuation setting up ⁉️
🟩 MAGMA LONG
Entry: 0.3741 – 0.3756
TP1: 0.3895
TP2: 0.4012
TP3: 0.4130
Stop Loss: 0.3601
The 15M chart shows a bullish structure with momentum and volume confirmation. A controlled retest of the entry zone may give the setup a cleaner trigger.
Plan: Wait for confirmation/rejection inside the entry zone; don’t chase the move.
DYOR | Manage Risk | Avoid Over-Leverage
·
--
Voir la traduction
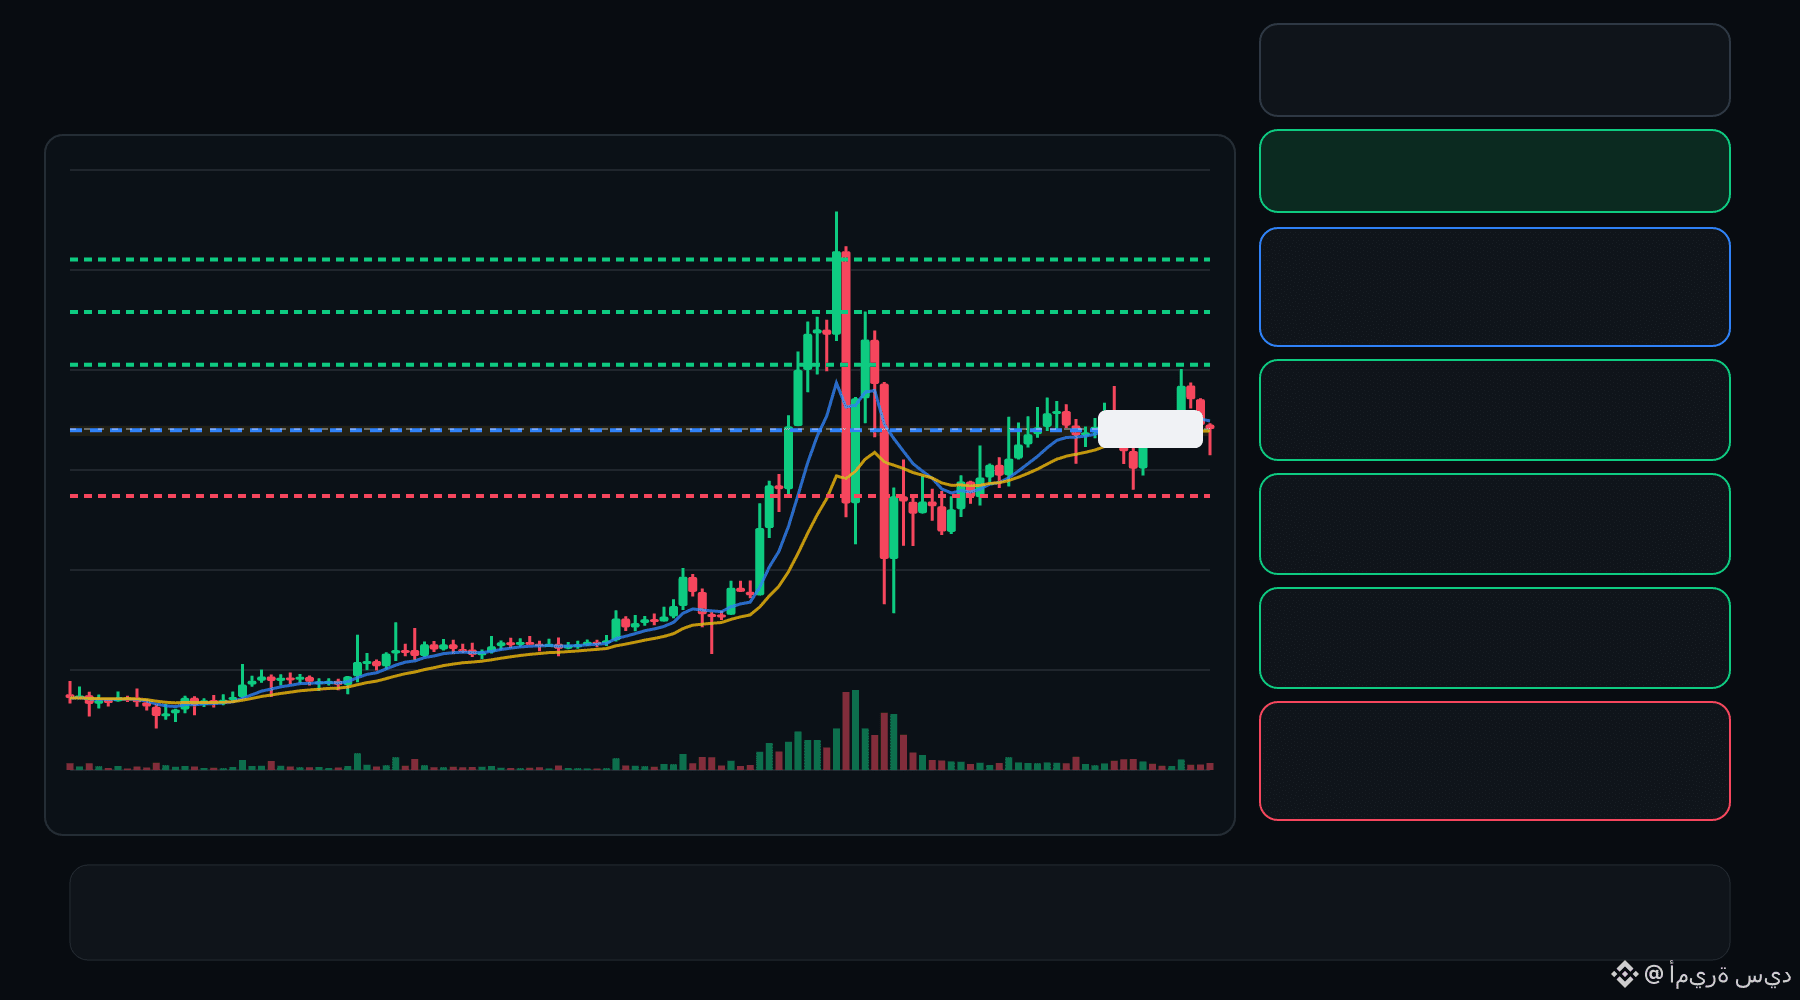
🟢 IDOL bulls are defending the pullback… is continuation setting up ⁉️
🟩 IDOL LONG
Entry: 0.02353 – 0.02386
TP1: 0.02601
TP2: 0.02786
TP3: 0.02972
Stop Loss: 0.02138
The 15M chart shows a bullish structure with momentum and volume confirmation. A controlled retest of the entry zone may give the setup a cleaner trigger.
Plan: Wait for confirmation/rejection inside the entry zone; don’t chase the move.
DYOR | Manage Risk | Avoid Over-Leverage
Connectez-vous pour découvrir plus de contenu
Rejoignez la communauté mondiale des adeptes de cryptomonnaies sur Binance Square
⚡️ Suviez les dernières informations importantes sur les cryptomonnaies.
💬 Jugé digne de confiance par la plus grande plateforme d’échange de cryptomonnaies au monde.
👍 Découvrez les connaissances que partagent les créateurs vérifiés.
Adresse e-mail/Nº de téléphone
Sujets d’actualité
BinanceReports80%Recoveryof$6.3BillioninLossesfromHackIncident
19,088 vues
178 mentions
Mise à jour n° 2 sur l’incident de sécurité (2026-10-30)
Binance Announcement
·1.2k mentions J’aime
·1.4M vues
HeYiSaysWithdrawalsExpectedtoResumeWithin42Hours
34,087 vues
676 mentions
CZSaysCompensationIsinPlaceUsersAreProtected
40,316 vues
558 mentions