

Kashifch109
6 Publications

Kashifch109
Signaler
Bloquer l’utilisateur
Ouvert au trading
Trade occasionnellement
5.5 an(s)
10 Suivis
0 Abonnés
0 J’aime
Publications
Portefeuille
·
--
🚀 Mise à jour du trading du SUI Coin | 27 oct.
📈 Tendance haussière au-dessus de 0,9330 $
🎯 Objectif : 0,9477 $
🛡️ Support : 0,9019 $
⚠️ Confirmez la cassure avant d'entrer en position. Utilisez toujours un stop-loss.
$SUI
#SUI #CryptoTrading #Binance #Altcoins
🚀 Mise à jour du trading du SUI Coin | 27 oct.
📈 Tendance haussière au-dessus de 0,9330 $
🎯 Objectif : 0,9477 $
🛡️ Support : 0,9019 $
⚠️ Confirmez la cassure avant d'entrer en position. Utilisez toujours un stop-loss.
$SUI
#SUI #CryptoTrading #Binance #Altcoins
📈 Tendance haussière au-dessus de 0,9330 $
🎯 Objectif : 0,9477 $
🛡️ Support : 0,9019 $
⚠️ Confirmez la cassure avant d'entrer en position. Utilisez toujours un stop-loss.
$SUI
#SUI #CryptoTrading #Binance #Altcoins
85
·
--
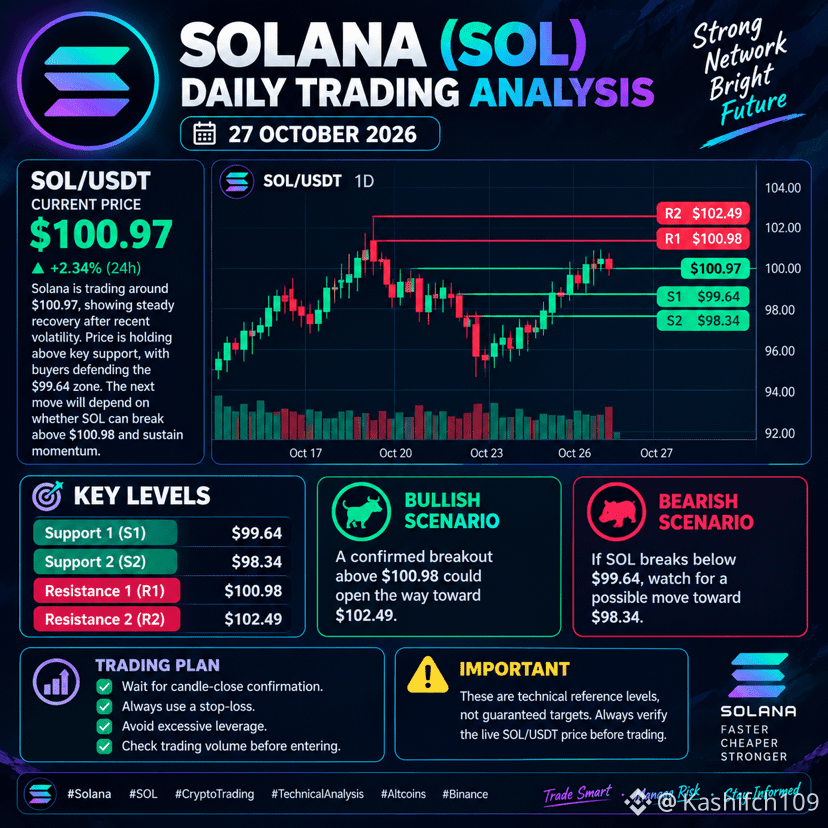
📊 ANALYSE QUOTIDIENNE DU TRADING DE SOLANA (SOL) 🚀
📅 27 octobre 2026
💰 Prix actuel : 100,97 $
🟢 Niveaux de support
• S1 : 99,64 $
• S2 : 98,34 $
🔴 Niveaux de résistance
• R1 : 100,98 $
• R2 : 102,49 $
📈 Scénario haussier : Une cassure confirmée au-dessus de 100,98 $ pourrait ouvrir la voie vers 102,49 $.
📉 Scénario baissier : Si SOL passe sous 99,64 $, surveillez un éventuel mouvement vers 98,34 $.
🎯 Plan de trading
✅ Attendez la confirmation à la clôture de la bougie.
✅ Utilisez toujours un stop-loss.
✅ Évitez un effet de levier excessif.
✅ Vérifiez le volume des échanges avant d’entrer en position.
⚠️ Avertissement sur les risques : Ces niveaux sont des repères techniques et ne constituent pas des objectifs garantis. Vérifiez le cours SOL/USDT en temps réel avant de trader.
$SOL #SOL #CryptoTrading #TechnicalAnalysis #Binance
70
·
--
Article
Voir la traduction
₿ BTC/USDT Market Outlook📊 BITCOIN (BTC) DAILY TRADING ANALYSIS 🚀 | 27 OCTOBER 2026
₿ BTC/USDT Market Outlook
Bitcoin is trading around the $80,000 level, with short-term momentum showing signs of weakness. Traders should watch key support and resistance zones before entering a position. The upcoming US Federal Reserve announcement may also increase market volatility.
🔹 Current Price: Approximately $80,200
🔹 Support 1: $79,400
🔹 Support 2: $78,600
🔹 Resistance 1: $80,900
🔹 Resistance 2: $81,600
📈 Bullish Scenario: If BTC breaks above $80,900 and holds that level, a move toward $81,600 could become possible.
📉 Bearish Scenario: If BTC loses the $79,400 support, further downside toward $78,600 may be possible.
🎯 Trading Strategy: Wait for a confirmed breakout or breakdown before entering a trade. Use a stop-loss, manage position size carefully, and avoid excessive leverage.
⚠️ Important: These levels are approximate technical reference points, not guaranteed targets. Always verify the live BTC/USDT chart before trading.
#Bitcoin #BTC #BTCUSDT #CryptoTrading #TechnicalAnalysis $BTC $USDT
₿ BTC/USDT Market Outlook
📊 BITCOIN (BTC) DAILY TRADING ANALYSIS 🚀 | 27 OCTOBER 2026
₿ BTC/USDT Market Outlook
Bitcoin is trading around the $80,000 level, with short-term momentum showing signs of weakness. Traders should watch key support and resistance zones before entering a position. The upcoming US Federal Reserve announcement may also increase market volatility.
🔹 Current Price: Approximately $80,200
🔹 Support 1: $79,400
🔹 Support 2: $78,600
🔹 Resistance 1: $80,900
🔹 Resistance 2: $81,600
📈 Bullish Scenario: If BTC breaks above $80,900 and holds that level, a move toward $81,600 could become possible.
📉 Bearish Scenario: If BTC loses the $79,400 support, further downside toward $78,600 may be possible.
🎯 Trading Strategy: Wait for a confirmed breakout or breakdown before entering a trade. Use a stop-loss, manage position size carefully, and avoid excessive leverage.
⚠️ Important: These levels are approximate technical reference points, not guaranteed targets. Always verify the live BTC/USDT chart before trading.
#Bitcoin #BTC #BTCUSDT #CryptoTrading #TechnicalAnalysis $BTC $USDT
₿ BTC/USDT Market Outlook
Bitcoin is trading around the $80,000 level, with short-term momentum showing signs of weakness. Traders should watch key support and resistance zones before entering a position. The upcoming US Federal Reserve announcement may also increase market volatility.
🔹 Current Price: Approximately $80,200
🔹 Support 1: $79,400
🔹 Support 2: $78,600
🔹 Resistance 1: $80,900
🔹 Resistance 2: $81,600
📈 Bullish Scenario: If BTC breaks above $80,900 and holds that level, a move toward $81,600 could become possible.
📉 Bearish Scenario: If BTC loses the $79,400 support, further downside toward $78,600 may be possible.
🎯 Trading Strategy: Wait for a confirmed breakout or breakdown before entering a trade. Use a stop-loss, manage position size carefully, and avoid excessive leverage.
⚠️ Important: These levels are approximate technical reference points, not guaranteed targets. Always verify the live BTC/USDT chart before trading.
#Bitcoin #BTC #BTCUSDT #CryptoTrading #TechnicalAnalysis $BTC $USDT
66
·
--
Voir la traduction
🚨 ETHEREUM (ETH) — NEXT MOVE? 👀
ETH has shown strong volatility in recent sessions and is now consolidating around the $2,700 level. 📊
🔹 Key Area: $2,660–$2,700
🔹 Resistance: $2,775–$2,825
🔹 Important Support: $2,560–$2,600
If ETH breaks above the upper resistance with strong volume, market momentum could strengthen again. However, losing the key support zone could trigger a pullback.
📌 My advice: Instead of entering due to FOMO, wait for confirmation and always use proper risk management.
What do you think — will ETH break above $2,800, or will a pullback come first? 👇
#ETH #Ethereum #BinanceSquare #Crypto #CryptoTrading #ETHUSDT #Bitcoin #Altcoins
[https://app.binance.com/uni-qr/cpro/kashifch109?l=en&r=YEJ95S90&uc=app_square_share_link&us=copylink](https://app.binance.com/uni-qr/cpro/kashifch109?l=en&r=YEJ95S90&uc=app_square_share_link&us=copylink)
GRO_28502_42DU0
🚨 ETHEREUM (ETH) — NEXT MOVE? 👀
ETH has shown strong volatility in recent sessions and is now consolidating around the $2,700 level. 📊
🔹 Key Area: $2,660–$2,700
🔹 Resistance: $2,775–$2,825
🔹 Important Support: $2,560–$2,600
If ETH breaks above the upper resistance with strong volume, market momentum could strengthen again. However, losing the key support zone could trigger a pullback.
📌 My advice: Instead of entering due to FOMO, wait for confirmation and always use proper risk management.
What do you think — will ETH break above $2,800, or will a pullback come first? 👇
#ETH #Ethereum #BinanceSquare #Crypto #CryptoTrading #ETHUSDT #Bitcoin #Altcoins
https://app.binance.com/uni-qr/cpro/kashifch109?l=en&r=YEJ95S90&uc=app_square_share_link&us=copylink
GRO_28502_42DU0
1
243
Connectez-vous pour découvrir plus de contenu
Rejoignez la communauté mondiale des adeptes de cryptomonnaies sur Binance Square
⚡️ Suviez les dernières informations importantes sur les cryptomonnaies.
💬 Jugé digne de confiance par la plus grande plateforme d’échange de cryptomonnaies au monde.
👍 Découvrez les connaissances que partagent les créateurs vérifiés.
Adresse e-mail/Nº de téléphone
Sujets d’actualité
EthereumDropsBelow$2300
2,064 vues
84 mentions
#EthereumDropsBelow$2300
Le capitaine ETH vient de plonger légèrement sous la barre des 2 300 USDT, avec une baisse de 1,39 % au cours des dernières 24 heures : de quoi faire perdre leur calme aux traders !
D’où vient cette agitation ? Il s’avère que les développeurs ont dû corriger en urgence un bug dans la mise à niveau Glamsterdam, pour éviter que les fonds de staking des validateurs ne finissent directement dans les poches des builders. Et ce n’est pas tout : la « baleine » Machi Big Brother vient de se faire liquider une partie de sa position longue avec un effet de levier de 25x. Son prix de liquidation était tout près du plancher, à seulement 30 USD du prix du marché : pas étonnant que le marché tremble !
Que doivent faire les traders maintenant ? Ceux qui sont du genre spirituel peuvent brûler de l’encens et prier pour que la baleine ne « prenne pas le large » ; ceux qui préfèrent l’analyse technique peuvent rester tranquilles et observer si le correctif fonctionne bien sur le testnet.
⚠️ Ceci ne constitue pas un conseil financier.
Inscrivez-vous et soutenez-moi avec le code : VINHTOCDO ou via le lien : https://www.binance.com/register?ref=VINHTOCDO
#Ethereum #Crypto #Staking #Glamsterdam #VINHTOCDO
Cliquez sur les liens de trading ci-dessous pour me soutenir :
$ETH
$BNB
$SOL
Vinhtocdo
·4 mentions J’aime
·194 vues
BitcoinSlipsBelow$80KAgain
5,639 vues
53 mentions
ThailandLaunchesWORPTStablecoinToQRPaymentApp
9,473 vues
253 mentions