

DropAir
41 Publications

DropAir
Signaler
Bloquer l’utilisateur
100 Suivis
60 Abonnés
30 J’aime
Publications
Tous
Citations
·
--
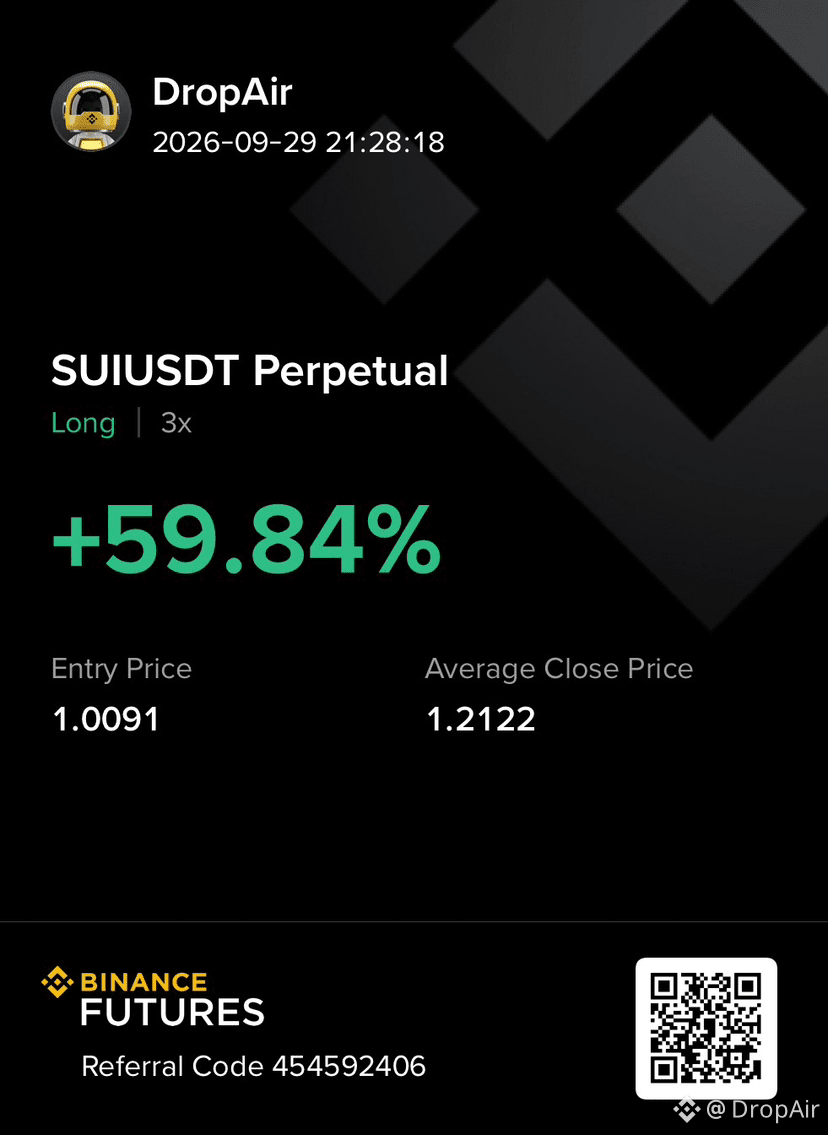
🚨 SUI/USDT — CONFIGURATION D’ACHAT/VENTE À SURVEILLER — OBSERVEZ CES NIVEAUX
$SUI évolue actuellement autour de 1,11 $–1,12 $ après un fort rally de septembre depuis la zone d’environ 0,69 $.
Nous sommes maintenant dans une zone de décision importante. 👀
📊 NIVEAUX CLÉS
🔴 Résistance :
• 1,16 $–1,18 $
• 1,20 $–1,22 $
• 1,29 $–1,30 $
🟢 Support :
• 1,06 $–1,08 $
• 1,00 $–1,02 $
• 0,93 $–0,96 $
🟢 SCÉNARIO LONG
Si SUI chute vers 1,06 $–1,08 $ et produit un fort rejet en 1H/4H :
🎯 TP1 : 1,16 $
🎯 TP2 : 1,22 $
🎯 TP3 : 1,29 $–1,30 $
Invalidation : cassure durable sous la zone de 1,00 $.
🔴 SCÉNARIO SHORT
Si SUI rebondit vers 1,16 $–1,20 $ mais se fait rejeter :
🎯 TP1 : 1,08 $
🎯 TP2 : 1,01 $
🎯 TP3 : 0,95 $
Invalidation : reprise forte en 4H au-dessus de la zone de résistance.
⚠️ Important : SUI a un événement planifié de déblocage de tokens autour du 30 septembre, donc la volatilité et les conditions de liquidité peuvent changer rapidement.
Je ne poursuivrais pas SUI à 1,11 $. Laissez le prix venir sur les niveaux et attendez la confirmation.
📌 Plan de trading > trading émotionnel.
Quel niveau surveillez-vous pour SUI ? 👇
#SUI #SUIUSDT #BinanceSquare #CryptoTrading #Altcoins #TradingSetup #CryptoAnalysis #SUIAnalysis
$SUI
🚨 SUI/USDT — CONFIGURATION D’ACHAT/VENTE À SURVEILLER — OBSERVEZ CES NIVEAUX
$SUI évolue actuellement autour de 1,11 $–1,12 $ après un fort rally de septembre depuis la zone d’environ 0,69 $.
Nous sommes maintenant dans une zone de décision importante. 👀
📊 NIVEAUX CLÉS
🔴 Résistance :
• 1,16 $–1,18 $
• 1,20 $–1,22 $
• 1,29 $–1,30 $
🟢 Support :
• 1,06 $–1,08 $
• 1,00 $–1,02 $
• 0,93 $–0,96 $
🟢 SCÉNARIO LONG
Si SUI chute vers 1,06 $–1,08 $ et produit un fort rejet en 1H/4H :
🎯 TP1 : 1,16 $
🎯 TP2 : 1,22 $
🎯 TP3 : 1,29 $–1,30 $
Invalidation : cassure durable sous la zone de 1,00 $.
🔴 SCÉNARIO SHORT
Si SUI rebondit vers 1,16 $–1,20 $ mais se fait rejeter :
🎯 TP1 : 1,08 $
🎯 TP2 : 1,01 $
🎯 TP3 : 0,95 $
Invalidation : reprise forte en 4H au-dessus de la zone de résistance.
⚠️ Important : SUI a un événement planifié de déblocage de tokens autour du 30 septembre, donc la volatilité et les conditions de liquidité peuvent changer rapidement.
Je ne poursuivrais pas SUI à 1,11 $. Laissez le prix venir sur les niveaux et attendez la confirmation.
📌 Plan de trading > trading émotionnel.
Quel niveau surveillez-vous pour SUI ? 👇
#SUI #SUIUSDT #BinanceSquare #CryptoTrading #Altcoins #TradingSetup #CryptoAnalysis #SUIAnalysis
$SUI
$SUI évolue actuellement autour de 1,11 $–1,12 $ après un fort rally de septembre depuis la zone d’environ 0,69 $.
Nous sommes maintenant dans une zone de décision importante. 👀
📊 NIVEAUX CLÉS
🔴 Résistance :
• 1,16 $–1,18 $
• 1,20 $–1,22 $
• 1,29 $–1,30 $
🟢 Support :
• 1,06 $–1,08 $
• 1,00 $–1,02 $
• 0,93 $–0,96 $
🟢 SCÉNARIO LONG
Si SUI chute vers 1,06 $–1,08 $ et produit un fort rejet en 1H/4H :
🎯 TP1 : 1,16 $
🎯 TP2 : 1,22 $
🎯 TP3 : 1,29 $–1,30 $
Invalidation : cassure durable sous la zone de 1,00 $.
🔴 SCÉNARIO SHORT
Si SUI rebondit vers 1,16 $–1,20 $ mais se fait rejeter :
🎯 TP1 : 1,08 $
🎯 TP2 : 1,01 $
🎯 TP3 : 0,95 $
Invalidation : reprise forte en 4H au-dessus de la zone de résistance.
⚠️ Important : SUI a un événement planifié de déblocage de tokens autour du 30 septembre, donc la volatilité et les conditions de liquidité peuvent changer rapidement.
Je ne poursuivrais pas SUI à 1,11 $. Laissez le prix venir sur les niveaux et attendez la confirmation.
📌 Plan de trading > trading émotionnel.
Quel niveau surveillez-vous pour SUI ? 👇
#SUI #SUIUSDT #BinanceSquare #CryptoTrading #Altcoins #TradingSetup #CryptoAnalysis #SUIAnalysis
$SUI
170
·
--
Baissier
$STORJ continue à être négocié sous une grave contrainte structurelle macro
{future}(STORJUSDT)
$STORJ continue à être négocié sous une grave contrainte structurelle macro
Bearish
50%
Bullish
50%
18 Votes • Vote fermé
1
1
2.5k
·
--
Haussier
$TAO Paramètres d’exécution stratégique
Approche à long terme : Plutôt que de poursuivre les valeurs actuelles du marché, les traders peuvent placer des ordres d’achat limités échelonnés profondément à l’intérieur de la poche de liquidité dorée, entre 186,00 $ et 189,50 $, afin de capter des flush soudains par mèche.
Déployer un stop-loss de protection serré sous l’ensemble du groupe à 184,00 $, en visant des prises de profits partielles à 198,00 $, 205,00 $ et 215,00 $.Approche de cassure : Les stratégies d’élan peuvent attendre une clôture quotidienne confirmée, à fort volume, au-dessus de 205,00 $, afin de saisir l’expansion vers les niveaux d’offre à moyen terme.
{future}(TAOUSDT)
$TAO Paramètres d’exécution stratégique
Approche à long terme : Plutôt que de poursuivre les valeurs actuelles du marché, les traders peuvent placer des ordres d’achat limités échelonnés profondément à l’intérieur de la poche de liquidité dorée, entre 186,00 $ et 189,50 $, afin de capter des flush soudains par mèche.
Déployer un stop-loss de protection serré sous l’ensemble du groupe à 184,00 $, en visant des prises de profits partielles à 198,00 $, 205,00 $ et 215,00 $.Approche de cassure : Les stratégies d’élan peuvent attendre une clôture quotidienne confirmée, à fort volume, au-dessus de 205,00 $, afin de saisir l’expansion vers les niveaux d’offre à moyen terme.
Approche à long terme : Plutôt que de poursuivre les valeurs actuelles du marché, les traders peuvent placer des ordres d’achat limités échelonnés profondément à l’intérieur de la poche de liquidité dorée, entre 186,00 $ et 189,50 $, afin de capter des flush soudains par mèche.
Déployer un stop-loss de protection serré sous l’ensemble du groupe à 184,00 $, en visant des prises de profits partielles à 198,00 $, 205,00 $ et 215,00 $.Approche de cassure : Les stratégies d’élan peuvent attendre une clôture quotidienne confirmée, à fort volume, au-dessus de 205,00 $, afin de saisir l’expansion vers les niveaux d’offre à moyen terme.
Bullish
100%
Bearish
0%
1 Votes • Vote fermé
1
84
·
--
#baby $BABY
$BABY / Analyse du trading à court terme sur USDT 📊 Babylon (BABY) montre des signes de stabilisation structurelle localisée, avec un rebond de 3% sur les dernières 24 heures pour évoluer près de 0,0127 $. Le token cherche une rampe de lancement solide après une contraction macro prolongée.
Détail techniqueNiveaux de support :
La ligne défensive ultime se situe fermement entre 0,0107 $ et 0,0120 $. Une cassure nette en dessous de 0,0100 invalide la structure d’accumulation actuelle, avec un risque de baisse vers une découverte de prix plus profonde.
Niveaux de résistance :
Pour reprendre le contrôle du marché à court terme, il faut une cassure sur fort volume au-dessus de la barrière dynamique à 0,0143 $. Une fois franchi, cela ouvre la voie à des extensions rapides vers des objectifs structurels à moyen terme à 0,0200 $ et 0,0228 $.
Indicateurs de momentum :
Le volume du trading au comptant a récemment augmenté de 46% à 7,5 millions $, signalant un renouveau précoce des acheteurs. Les métriques des produits dérivés indiquent un scénario de squeeze en construction, avec des ratios élevés futures/spot.
Idées de configuration de trade
Approche Longue :
Les traders peuvent surveiller des entrées au comptant ou à faible levier dans la zone tampon 0,0120 – 0,0125 $. Placez un stop-loss de protection strict en dessous de 0,0105, avec pour cible les résistances à court terme autour de 0,0143 $ et 0,0200 $.
Approche Courte :
Les rejets avec un volume en diminution ou des schémas d’échec baissiers clairs près de la zone de résistance à 0,0143 $ offrent des paramètres d’invalidation serrés pour short et revenir vers le plancher local de demande à 0,0110 $.
$BABY
#BABY #Babylon #CryptoTrading #TechnicalAnalysis #BinanceSquare 🚀
#baby $BABY
$BABY / Analyse du trading à court terme sur USDT 📊 Babylon (BABY) montre des signes de stabilisation structurelle localisée, avec un rebond de 3% sur les dernières 24 heures pour évoluer près de 0,0127 $. Le token cherche une rampe de lancement solide après une contraction macro prolongée.
Détail techniqueNiveaux de support :
La ligne défensive ultime se situe fermement entre 0,0107 $ et 0,0120 $. Une cassure nette en dessous de 0,0100 invalide la structure d’accumulation actuelle, avec un risque de baisse vers une découverte de prix plus profonde.
Niveaux de résistance :
Pour reprendre le contrôle du marché à court terme, il faut une cassure sur fort volume au-dessus de la barrière dynamique à 0,0143 $. Une fois franchi, cela ouvre la voie à des extensions rapides vers des objectifs structurels à moyen terme à 0,0200 $ et 0,0228 $.
Indicateurs de momentum :
Le volume du trading au comptant a récemment augmenté de 46% à 7,5 millions $, signalant un renouveau précoce des acheteurs. Les métriques des produits dérivés indiquent un scénario de squeeze en construction, avec des ratios élevés futures/spot.
Idées de configuration de trade
Approche Longue :
Les traders peuvent surveiller des entrées au comptant ou à faible levier dans la zone tampon 0,0120 – 0,0125 $. Placez un stop-loss de protection strict en dessous de 0,0105, avec pour cible les résistances à court terme autour de 0,0143 $ et 0,0200 $.
Approche Courte :
Les rejets avec un volume en diminution ou des schémas d’échec baissiers clairs près de la zone de résistance à 0,0143 $ offrent des paramètres d’invalidation serrés pour short et revenir vers le plancher local de demande à 0,0110 $.
$BABY
#BABY #Babylon #CryptoTrading #TechnicalAnalysis #BinanceSquare 🚀
$BABY / Analyse du trading à court terme sur USDT 📊 Babylon (BABY) montre des signes de stabilisation structurelle localisée, avec un rebond de 3% sur les dernières 24 heures pour évoluer près de 0,0127 $. Le token cherche une rampe de lancement solide après une contraction macro prolongée.
Détail techniqueNiveaux de support :
La ligne défensive ultime se situe fermement entre 0,0107 $ et 0,0120 $. Une cassure nette en dessous de 0,0100 invalide la structure d’accumulation actuelle, avec un risque de baisse vers une découverte de prix plus profonde.
Niveaux de résistance :
Pour reprendre le contrôle du marché à court terme, il faut une cassure sur fort volume au-dessus de la barrière dynamique à 0,0143 $. Une fois franchi, cela ouvre la voie à des extensions rapides vers des objectifs structurels à moyen terme à 0,0200 $ et 0,0228 $.
Indicateurs de momentum :
Le volume du trading au comptant a récemment augmenté de 46% à 7,5 millions $, signalant un renouveau précoce des acheteurs. Les métriques des produits dérivés indiquent un scénario de squeeze en construction, avec des ratios élevés futures/spot.
Idées de configuration de trade
Approche Longue :
Les traders peuvent surveiller des entrées au comptant ou à faible levier dans la zone tampon 0,0120 – 0,0125 $. Placez un stop-loss de protection strict en dessous de 0,0105, avec pour cible les résistances à court terme autour de 0,0143 $ et 0,0200 $.
Approche Courte :
Les rejets avec un volume en diminution ou des schémas d’échec baissiers clairs près de la zone de résistance à 0,0143 $ offrent des paramètres d’invalidation serrés pour short et revenir vers le plancher local de demande à 0,0110 $.
$BABY
#BABY #Babylon #CryptoTrading #TechnicalAnalysis #BinanceSquare 🚀
59
·
--
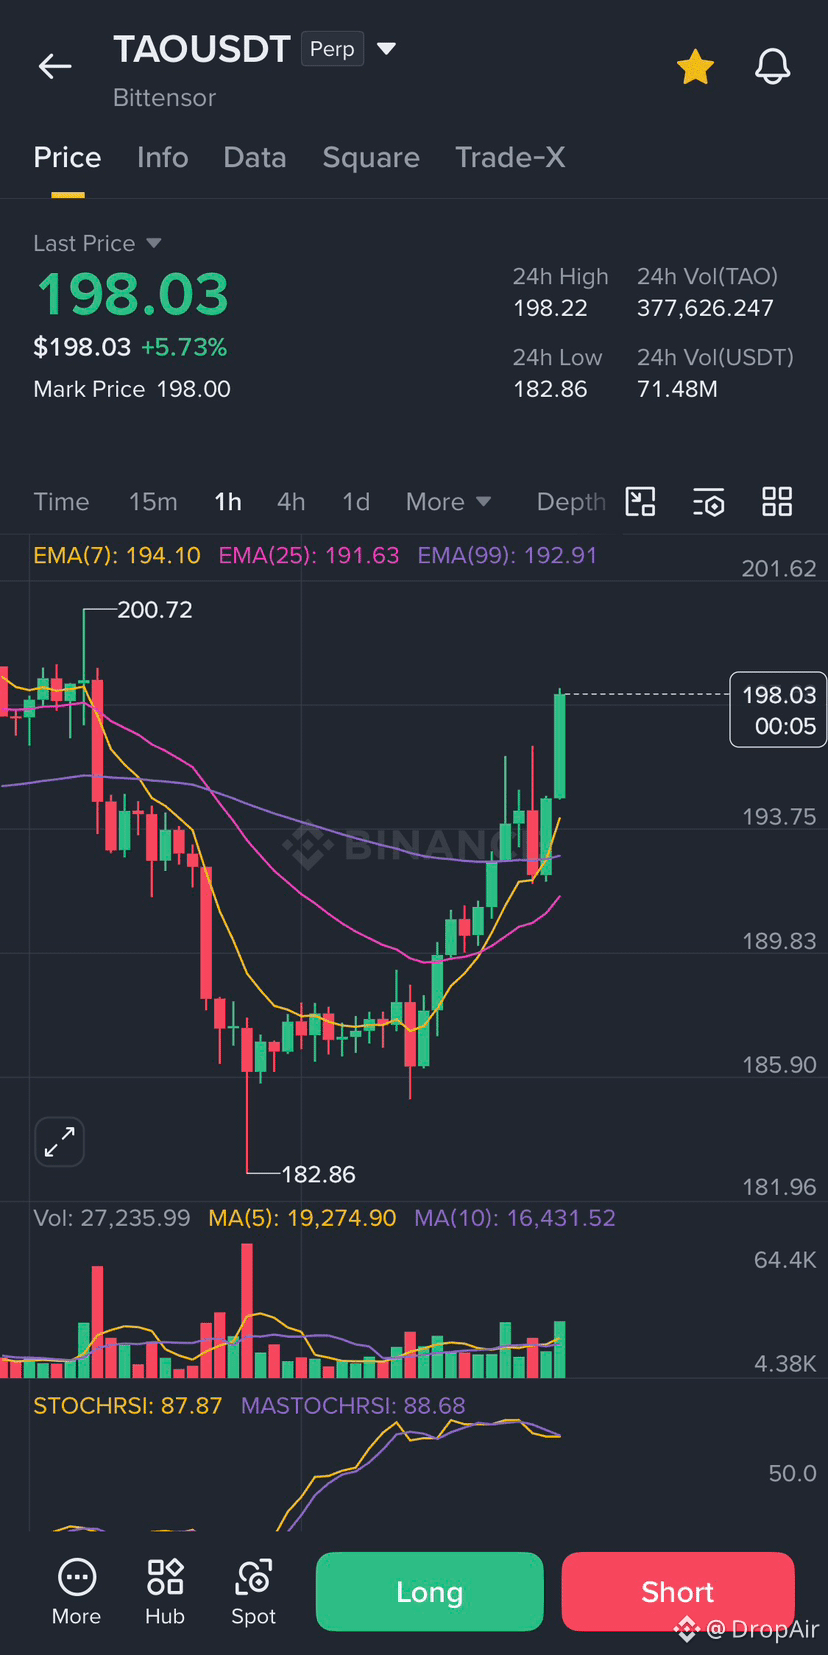
TP touche 1 : 198🔥$TAO
TP touche 1 : 198🔥$TAO
DropAir
·
--
Paramètres d’exécution stratégiques
$TAO Approche Long : Au lieu de poursuivre les valeurs actuelles du marché, les traders peuvent placer des ordres d’achat limités échelonnés profondément à l’intérieur de la poche de liquidité dorée, entre 186,00 $ et 189,50 $, afin de capter les flush soudains provoqués par les mèches.
Mettez en place un stop protecteur serré (stop-loss) en dessous de l’ensemble du cluster à 184,00 $, en visant des prises de bénéfices partielles à 198,00 $, 205,00 $ et 215,00 $.
Approche Breakout : Les stratégies de momentum peuvent attendre qu’une clôture quotidienne confirmée, à fort volume, se fasse au-dessus de 205,00 $ afin de profiter de l’expansion vers les niveaux d’offre à moyen terme.
$TAO Approche Long : Au lieu de poursuivre les valeurs actuelles du marché, les traders peuvent placer des ordres d’achat limités échelonnés profondément à l’intérieur de la poche de liquidité dorée, entre 186,00 $ et 189,50 $, afin de capter les flush soudains provoqués par les mèches.
Mettez en place un stop protecteur serré (stop-loss) en dessous de l’ensemble du cluster à 184,00 $, en visant des prises de bénéfices partielles à 198,00 $, 205,00 $ et 215,00 $.
Approche Breakout : Les stratégies de momentum peuvent attendre qu’une clôture quotidienne confirmée, à fort volume, se fasse au-dessus de 205,00 $ afin de profiter de l’expansion vers les niveaux d’offre à moyen terme.
45
·
--
Paramètres d’exécution stratégiques
$TAO Approche Long : Au lieu de poursuivre les valeurs actuelles du marché, les traders peuvent placer des ordres d’achat limités échelonnés profondément à l’intérieur de la poche de liquidité dorée, entre 186,00 $ et 189,50 $, afin de capter les flush soudains provoqués par les mèches.
Mettez en place un stop protecteur serré (stop-loss) en dessous de l’ensemble du cluster à 184,00 $, en visant des prises de bénéfices partielles à 198,00 $, 205,00 $ et 215,00 $.
Approche Breakout : Les stratégies de momentum peuvent attendre qu’une clôture quotidienne confirmée, à fort volume, se fasse au-dessus de 205,00 $ afin de profiter de l’expansion vers les niveaux d’offre à moyen terme.
Paramètres d’exécution stratégiques
$TAO Approche Long : Au lieu de poursuivre les valeurs actuelles du marché, les traders peuvent placer des ordres d’achat limités échelonnés profondément à l’intérieur de la poche de liquidité dorée, entre 186,00 $ et 189,50 $, afin de capter les flush soudains provoqués par les mèches.
Mettez en place un stop protecteur serré (stop-loss) en dessous de l’ensemble du cluster à 184,00 $, en visant des prises de bénéfices partielles à 198,00 $, 205,00 $ et 215,00 $.
Approche Breakout : Les stratégies de momentum peuvent attendre qu’une clôture quotidienne confirmée, à fort volume, se fasse au-dessus de 205,00 $ afin de profiter de l’expansion vers les niveaux d’offre à moyen terme.
$TAO Approche Long : Au lieu de poursuivre les valeurs actuelles du marché, les traders peuvent placer des ordres d’achat limités échelonnés profondément à l’intérieur de la poche de liquidité dorée, entre 186,00 $ et 189,50 $, afin de capter les flush soudains provoqués par les mèches.
Mettez en place un stop protecteur serré (stop-loss) en dessous de l’ensemble du cluster à 184,00 $, en visant des prises de bénéfices partielles à 198,00 $, 205,00 $ et 215,00 $.
Approche Breakout : Les stratégies de momentum peuvent attendre qu’une clôture quotidienne confirmée, à fort volume, se fasse au-dessus de 205,00 $ afin de profiter de l’expansion vers les niveaux d’offre à moyen terme.
1
1
113
·
--
Baissier
Bittensor $TAO montre une faiblesse technique, s’échangeant à environ 191,90 $ après une baisse qui dure depuis plusieurs mois.
Positionnement technique Dynamique des tendances : la tendance à moyen terme reste nettement baissière, caractérisée par une séquence persistante de plus hauts plus bas.
Résistance clé : une résistance importante se situe à 214 $. L’actif se négocie actuellement en dessous de toutes les principales moyennes mobiles exponentielles (MME) à court terme, ce qui indique que les vendeurs dominent les rebonds récents.
Support critique : le support mensuel immédiat se situe entre 180 $ et 182,50 $. Il s’agit de la borne inférieure d’un motif en forme de biseau descendant.
{future}(TAOUSDT)
Bittensor $TAO montre une faiblesse technique, s’échangeant à environ 191,90 $ après une baisse qui dure depuis plusieurs mois.
Positionnement technique Dynamique des tendances : la tendance à moyen terme reste nettement baissière, caractérisée par une séquence persistante de plus hauts plus bas.
Résistance clé : une résistance importante se situe à 214 $. L’actif se négocie actuellement en dessous de toutes les principales moyennes mobiles exponentielles (MME) à court terme, ce qui indique que les vendeurs dominent les rebonds récents.
Support critique : le support mensuel immédiat se situe entre 180 $ et 182,50 $. Il s’agit de la borne inférieure d’un motif en forme de biseau descendant.
Positionnement technique Dynamique des tendances : la tendance à moyen terme reste nettement baissière, caractérisée par une séquence persistante de plus hauts plus bas.
Résistance clé : une résistance importante se situe à 214 $. L’actif se négocie actuellement en dessous de toutes les principales moyennes mobiles exponentielles (MME) à court terme, ce qui indique que les vendeurs dominent les rebonds récents.
Support critique : le support mensuel immédiat se situe entre 180 $ et 182,50 $. Il s’agit de la borne inférieure d’un motif en forme de biseau descendant.
Bullish
0%
Bearish
0%
0 Votes • Vote fermé
1
1.1k
·
--
💡 Exécution stratégique des trades Stratégie d’entrée en position longue :
$TAO
Évitez de forcer des ordres au marché aux prix actuels. Échelonnez des achats à cours limité à l’intérieur de la “golden pocket” à 188,50 $ – 190,00 $ pour capter la potentielle mèche de chasse aux stops.
Stop-Loss (SL) : Définissez une sortie d’invalidation stricte sous tout le cluster à 185,50 $.
Take-Profit (TP) : Visez des extensions de reprise structurelle à 198,00 $, 203,00 $ et 208,00 $. Gérez toujours votre levier de manière stricte et protégez votre capital ! 📉
{future}(TAOUSDT)
💡 Exécution stratégique des trades Stratégie d’entrée en position longue :
$TAO
Évitez de forcer des ordres au marché aux prix actuels. Échelonnez des achats à cours limité à l’intérieur de la “golden pocket” à 188,50 $ – 190,00 $ pour capter la potentielle mèche de chasse aux stops.
Stop-Loss (SL) : Définissez une sortie d’invalidation stricte sous tout le cluster à 185,50 $.
Take-Profit (TP) : Visez des extensions de reprise structurelle à 198,00 $, 203,00 $ et 208,00 $. Gérez toujours votre levier de manière stricte et protégez votre capital ! 📉
$TAO
Évitez de forcer des ordres au marché aux prix actuels. Échelonnez des achats à cours limité à l’intérieur de la “golden pocket” à 188,50 $ – 190,00 $ pour capter la potentielle mèche de chasse aux stops.
Stop-Loss (SL) : Définissez une sortie d’invalidation stricte sous tout le cluster à 185,50 $.
Take-Profit (TP) : Visez des extensions de reprise structurelle à 198,00 $, 203,00 $ et 208,00 $. Gérez toujours votre levier de manière stricte et protégez votre capital ! 📉
1
82
·
--
#baby $BABY
$BABY / Analyse du trading à court terme en USDT 📊Babylon (BABY) montre des signes de stabilisation structurelle localisée, avec un rebond de 3% sur les dernières 24 heures pour évoluer près de 0,0127 $. Le token cherche une véritable plateforme de lancement après une contraction macro prolongée.
Décomposition techniqueNiveaux de support :
La ligne défensive ultime se situe fermement entre 0,0107 $ et 0,0120 $. Une cassure nette sous 0,0100 invalide la structure d’accumulation actuelle, avec un risque de baisse vers une découverte de prix plus profonde.
Niveaux de résistance : La reconquête du contrôle du marché à court terme nécessite une cassure à fort volume au-dessus de la barrière dynamique des 0,0143 $. Une fois ce niveau franchi, cela ouvre la voie à des extensions rapides vers des objectifs structurels à moyen terme à 0,0200 $ et 0,0228 .Indicateurs de momentum : Le volume des transactions au comptant a récemment augmenté de 46% pour atteindre 7,5 millions $, signalant un retour précoce des acheteurs. Les métriques des dérivés mettent en évidence un scénario de squeeze en construction, avec des ratios activité futures/spot élevés.Idées de configuration de tradeIdée d’achat (long) : Les traders peuvent surveiller des entrées au comptant ou à faible effet de levier à l’intérieur de la zone tampon 0,0120 $ – 0,0125 $. Placez un stop-loss protecteur strict sous 0,0105, avec comme cibles des résistances à court terme autour de 0,0143 $ et 0,0200 $.
Idée de vente (short) : Les rejets avec un volume en baisse ou des schémas d’échec baissier clairs près de la zone de résistance des 0,0143 $ offrent des paramètres d’invalidation serrés pour short à nouveau vers le plancher de la demande locale à 0,0110 $.
$BABY
#BABY #Babylon #CryptoTrading #AnalyseTechnique #BinanceSquare 🚀
{future}(BABYUSDT)
#baby $BABY
$BABY / Analyse du trading à court terme en USDT 📊Babylon (BABY) montre des signes de stabilisation structurelle localisée, avec un rebond de 3% sur les dernières 24 heures pour évoluer près de 0,0127 $. Le token cherche une véritable plateforme de lancement après une contraction macro prolongée.
Décomposition techniqueNiveaux de support :
La ligne défensive ultime se situe fermement entre 0,0107 $ et 0,0120 $. Une cassure nette sous 0,0100 invalide la structure d’accumulation actuelle, avec un risque de baisse vers une découverte de prix plus profonde.
Niveaux de résistance : La reconquête du contrôle du marché à court terme nécessite une cassure à fort volume au-dessus de la barrière dynamique des 0,0143 $. Une fois ce niveau franchi, cela ouvre la voie à des extensions rapides vers des objectifs structurels à moyen terme à 0,0200 $ et 0,0228 .Indicateurs de momentum : Le volume des transactions au comptant a récemment augmenté de 46% pour atteindre 7,5 millions $, signalant un retour précoce des acheteurs. Les métriques des dérivés mettent en évidence un scénario de squeeze en construction, avec des ratios activité futures/spot élevés.Idées de configuration de tradeIdée d’achat (long) : Les traders peuvent surveiller des entrées au comptant ou à faible effet de levier à l’intérieur de la zone tampon 0,0120 $ – 0,0125 $. Placez un stop-loss protecteur strict sous 0,0105, avec comme cibles des résistances à court terme autour de 0,0143 $ et 0,0200 $.
Idée de vente (short) : Les rejets avec un volume en baisse ou des schémas d’échec baissier clairs près de la zone de résistance des 0,0143 $ offrent des paramètres d’invalidation serrés pour short à nouveau vers le plancher de la demande locale à 0,0110 $.
$BABY
#BABY #Babylon #CryptoTrading #AnalyseTechnique #BinanceSquare 🚀
$BABY / Analyse du trading à court terme en USDT 📊Babylon (BABY) montre des signes de stabilisation structurelle localisée, avec un rebond de 3% sur les dernières 24 heures pour évoluer près de 0,0127 $. Le token cherche une véritable plateforme de lancement après une contraction macro prolongée.
Décomposition techniqueNiveaux de support :
La ligne défensive ultime se situe fermement entre 0,0107 $ et 0,0120 $. Une cassure nette sous 0,0100 invalide la structure d’accumulation actuelle, avec un risque de baisse vers une découverte de prix plus profonde.
Niveaux de résistance : La reconquête du contrôle du marché à court terme nécessite une cassure à fort volume au-dessus de la barrière dynamique des 0,0143 $. Une fois ce niveau franchi, cela ouvre la voie à des extensions rapides vers des objectifs structurels à moyen terme à 0,0200 $ et 0,0228 .Indicateurs de momentum : Le volume des transactions au comptant a récemment augmenté de 46% pour atteindre 7,5 millions $, signalant un retour précoce des acheteurs. Les métriques des dérivés mettent en évidence un scénario de squeeze en construction, avec des ratios activité futures/spot élevés.Idées de configuration de tradeIdée d’achat (long) : Les traders peuvent surveiller des entrées au comptant ou à faible effet de levier à l’intérieur de la zone tampon 0,0120 $ – 0,0125 $. Placez un stop-loss protecteur strict sous 0,0105, avec comme cibles des résistances à court terme autour de 0,0143 $ et 0,0200 $.
Idée de vente (short) : Les rejets avec un volume en baisse ou des schémas d’échec baissier clairs près de la zone de résistance des 0,0143 $ offrent des paramètres d’invalidation serrés pour short à nouveau vers le plancher de la demande locale à 0,0110 $.
$BABY
#BABY #Babylon #CryptoTrading #AnalyseTechnique #BinanceSquare 🚀
1
76
·
--
Haussier
$SOL / Analyse du trading USDT 📊 Solana
(SOL) se négocie actuellement à 74,75 $, trouvant un solide appui sur une importante ligne de tendance haussière ascendante après une courte phase de refroidissement suivant son plus haut local à 83,81 $. La structure de marché penche modérément haussière, alors qu’elle prend de l’élan en vue d’une éventuelle poursuite par cassure.
Analyse technique
Niveaux de support : le repli immédiat s’établit confortablement entre 73,50 $ et 74,25 $. Défendre cette zone permet de préserver la structure haussière à plus grande échelle. Une rupture en profondeur sous 65,90 $ invaliderait la tendance haussière à plus court terme.
Niveaux de résistance : le principal obstacle pour les acheteurs consiste à franchir la résistance locale à 78,50 $. Une cassure quotidienne réussie au-dessus du pivot majeur à 82,25 $ met en évidence des objectifs haussiers immédiats vers 83,30 $ et 90,00 $.
$SOL
{future}(SOLUSDT)
$SOL / Analyse du trading USDT 📊 Solana
(SOL) se négocie actuellement à 74,75 $, trouvant un solide appui sur une importante ligne de tendance haussière ascendante après une courte phase de refroidissement suivant son plus haut local à 83,81 $. La structure de marché penche modérément haussière, alors qu’elle prend de l’élan en vue d’une éventuelle poursuite par cassure.
Analyse technique
Niveaux de support : le repli immédiat s’établit confortablement entre 73,50 $ et 74,25 $. Défendre cette zone permet de préserver la structure haussière à plus grande échelle. Une rupture en profondeur sous 65,90 $ invaliderait la tendance haussière à plus court terme.
Niveaux de résistance : le principal obstacle pour les acheteurs consiste à franchir la résistance locale à 78,50 $. Une cassure quotidienne réussie au-dessus du pivot majeur à 82,25 $ met en évidence des objectifs haussiers immédiats vers 83,30 $ et 90,00 $.
$SOL
(SOL) se négocie actuellement à 74,75 $, trouvant un solide appui sur une importante ligne de tendance haussière ascendante après une courte phase de refroidissement suivant son plus haut local à 83,81 $. La structure de marché penche modérément haussière, alors qu’elle prend de l’élan en vue d’une éventuelle poursuite par cassure.
Analyse technique
Niveaux de support : le repli immédiat s’établit confortablement entre 73,50 $ et 74,25 $. Défendre cette zone permet de préserver la structure haussière à plus grande échelle. Une rupture en profondeur sous 65,90 $ invaliderait la tendance haussière à plus court terme.
Niveaux de résistance : le principal obstacle pour les acheteurs consiste à franchir la résistance locale à 78,50 $. Une cassure quotidienne réussie au-dessus du pivot majeur à 82,25 $ met en évidence des objectifs haussiers immédiats vers 83,30 $ et 90,00 $.
$SOL
Bullish
85%
Bearish
15%
13 Votes • Vote fermé
3
254
·
--
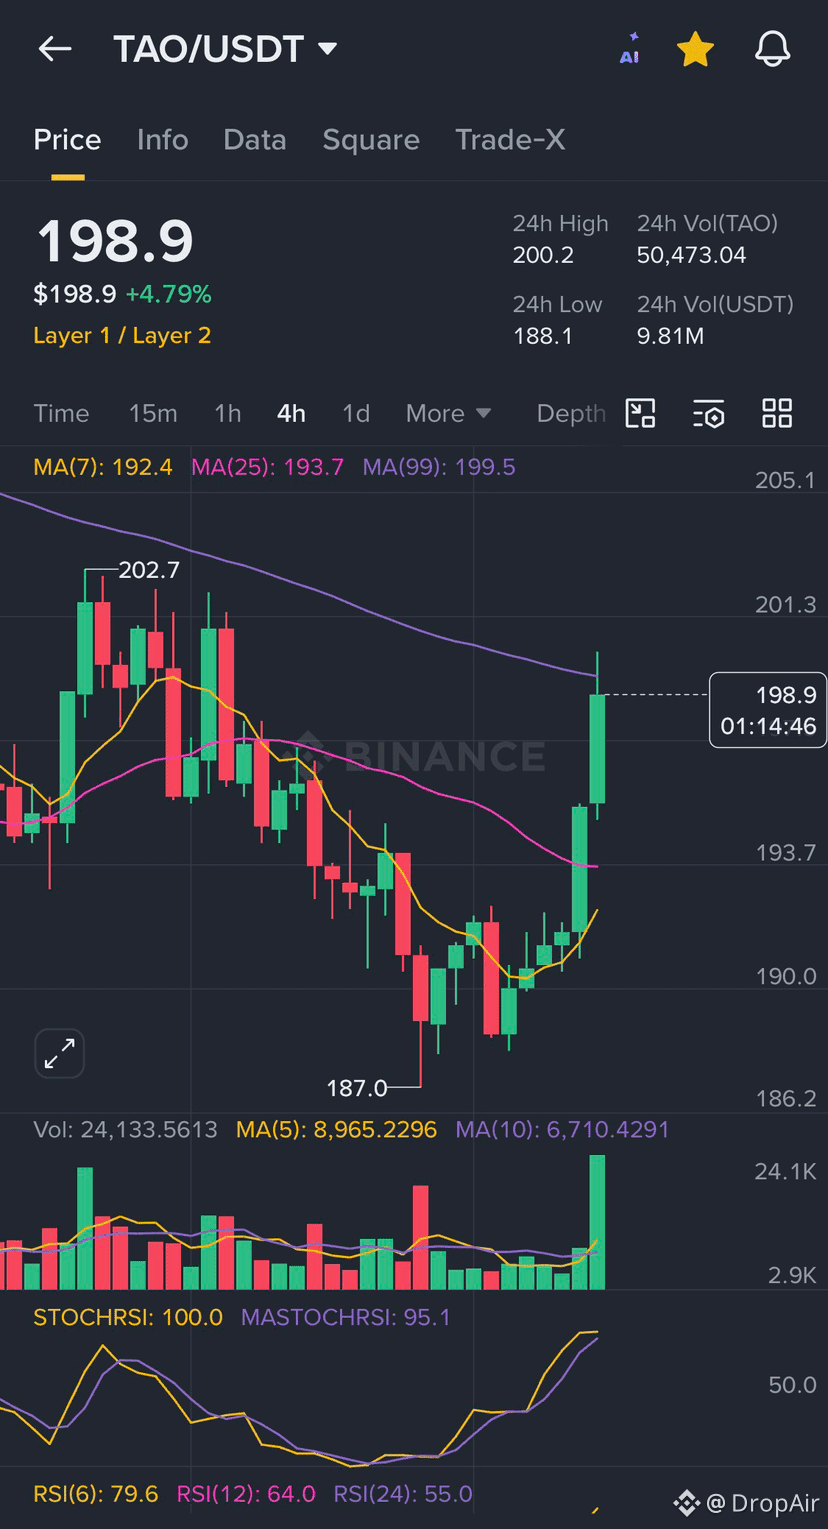
$TAO
Idées de configuration de trading
Approche longue : Les scalpeurs peuvent chercher une entrée autour de la zone $188 - $191. Placez un stop-loss serré juste sous $185, en visant des sorties rapides au-dessus à $198 et $205.
Approche courte : Les rejets ou les tests de faible volume près de la résistance $205 offrent des configurations de vente optimales, avec pour objectif un retest du plancher local à $185.
$TAO
{future}(TAOUSDT)
$TAO
Idées de configuration de trading
Approche longue : Les scalpeurs peuvent chercher une entrée autour de la zone $188 - $191. Placez un stop-loss serré juste sous $185, en visant des sorties rapides au-dessus à $198 et $205.
Approche courte : Les rejets ou les tests de faible volume près de la résistance $205 offrent des configurations de vente optimales, avec pour objectif un retest du plancher local à $185.
$TAO
Idées de configuration de trading
Approche longue : Les scalpeurs peuvent chercher une entrée autour de la zone $188 - $191. Placez un stop-loss serré juste sous $185, en visant des sorties rapides au-dessus à $198 et $205.
Approche courte : Les rejets ou les tests de faible volume près de la résistance $205 offrent des configurations de vente optimales, avec pour objectif un retest du plancher local à $185.
$TAO
1
1
·
--
Haussier
$TAO
Idées de configuration de trading
Approche longue : Les scalpers peuvent rechercher une entrée autour de la zone 188 $ à 191 $. Placez un stop-loss serré juste en dessous de 185 $, en visant des sorties rapides au-dessus à 198 $ et 205 $.
Approche courte : Les rejets ou les tests de faible volume près de la résistance à 205 $ offrent des configurations courtes optimales, avec pour objectif une retouche du support local à 185 $.
$TAO
{future}(TAOUSDT)
$TAO
Idées de configuration de trading
Approche longue : Les scalpers peuvent rechercher une entrée autour de la zone 188 $ à 191 $. Placez un stop-loss serré juste en dessous de 185 $, en visant des sorties rapides au-dessus à 198 $ et 205 $.
Approche courte : Les rejets ou les tests de faible volume près de la résistance à 205 $ offrent des configurations courtes optimales, avec pour objectif une retouche du support local à 185 $.
$TAO
Idées de configuration de trading
Approche longue : Les scalpers peuvent rechercher une entrée autour de la zone 188 $ à 191 $. Placez un stop-loss serré juste en dessous de 185 $, en visant des sorties rapides au-dessus à 198 $ et 205 $.
Approche courte : Les rejets ou les tests de faible volume près de la résistance à 205 $ offrent des configurations courtes optimales, avec pour objectif une retouche du support local à 185 $.
$TAO
1
180
·
--
Analyse de transaction 📊$TAO
Bittensor (TAO) est actuellement en train de se comprimer dans une fourchette étroite et volatile autour de $191, en difficulté pour sortir d’une tendance baissière plus large sur plusieurs semaines. Le mouvement du prix évolue juste au-dessus d’une zone critique de support macro, signalant un point d’inflexion technique majeur.
Analyse technique
Niveaux de support : La ligne de défense immédiate reste solide à $185 - $190. Si les bougies quotidiennes passent sous $185, attendez-vous à une accélération brutale de la vente forcée, descendant vers les poches de liquidité structurelle autour de $160 - $175.
Analyse de transaction 📊
$TAO
Bittensor (TAO) est actuellement en train de se comprimer dans une fourchette étroite et volatile autour de $191, en difficulté pour sortir d’une tendance baissière plus large sur plusieurs semaines. Le mouvement du prix évolue juste au-dessus d’une zone critique de support macro, signalant un point d’inflexion technique majeur.
Analyse technique
Niveaux de support : La ligne de défense immédiate reste solide à $185 - $190. Si les bougies quotidiennes passent sous $185, attendez-vous à une accélération brutale de la vente forcée, descendant vers les poches de liquidité structurelle autour de $160 - $175.
Bittensor (TAO) est actuellement en train de se comprimer dans une fourchette étroite et volatile autour de $191, en difficulté pour sortir d’une tendance baissière plus large sur plusieurs semaines. Le mouvement du prix évolue juste au-dessus d’une zone critique de support macro, signalant un point d’inflexion technique majeur.
Analyse technique
Niveaux de support : La ligne de défense immédiate reste solide à $185 - $190. Si les bougies quotidiennes passent sous $185, attendez-vous à une accélération brutale de la vente forcée, descendant vers les poches de liquidité structurelle autour de $160 - $175.
1
61
·
--
Vérifié
MISE À JOUR DU MARCHÉ ZECTitre : 🛡️ $ZEC Mise à jour du marché : Le pionnier de la confidentialité teste un support majeur à l’approche d’une étape clé du réseau !
Zcash ($ZEC) connaît un repli localisé, reflétant le sentiment plus large de « risk-off » de l’environnement macroéconomique et une correction plus étendue du marché des altcoins. Les traders avancent prudemment tandis que le marché met en balance la volatilité externe et les changements de protocole à venir.
Plongeons dans la structure du graphique technique pour $ZEC.
Niveaux techniques clés à surveiller
Support critique : 475 - 480 $ – Il s’agit d’une zone de demande psychologique majeure. Une cassure confirmée sur 4 heures en dessous de cette zone pourrait ouvrir la voie à une baisse plus profonde vers des niveaux macro.
MISE À JOUR DU MARCHÉ ZEC
Titre : 🛡️ $ZEC Mise à jour du marché : Le pionnier de la confidentialité teste un support majeur à l’approche d’une étape clé du réseau !
Zcash ($ZEC ) connaît un repli localisé, reflétant le sentiment plus large de « risk-off » de l’environnement macroéconomique et une correction plus étendue du marché des altcoins. Les traders avancent prudemment tandis que le marché met en balance la volatilité externe et les changements de protocole à venir.
Plongeons dans la structure du graphique technique pour $ZEC .
Niveaux techniques clés à surveiller
Support critique : 475 - 480 $ – Il s’agit d’une zone de demande psychologique majeure. Une cassure confirmée sur 4 heures en dessous de cette zone pourrait ouvrir la voie à une baisse plus profonde vers des niveaux macro.
Zcash ($ZEC ) connaît un repli localisé, reflétant le sentiment plus large de « risk-off » de l’environnement macroéconomique et une correction plus étendue du marché des altcoins. Les traders avancent prudemment tandis que le marché met en balance la volatilité externe et les changements de protocole à venir.
Plongeons dans la structure du graphique technique pour $ZEC .
Niveaux techniques clés à surveiller
Support critique : 475 - 480 $ – Il s’agit d’une zone de demande psychologique majeure. Une cassure confirmée sur 4 heures en dessous de cette zone pourrait ouvrir la voie à une baisse plus profonde vers des niveaux macro.
1
167
·
--
Baissier
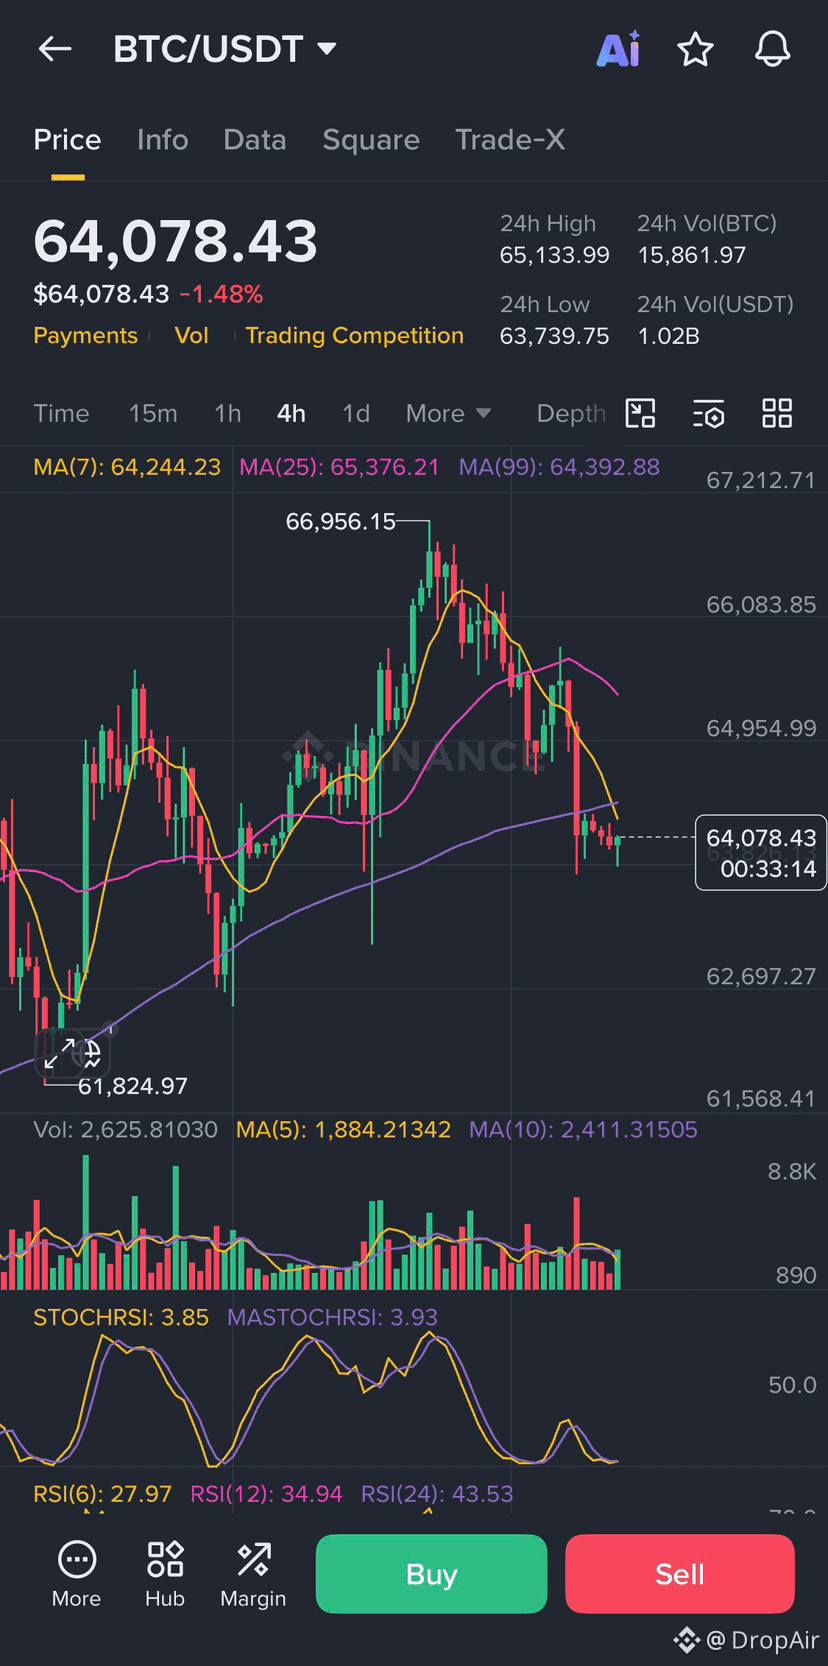
Titre : 📊 Flash sur le marché du BTC : la baisse technique teste un support de ligne de tendance crucial !Bitcoin ($BTC) fait face à de nouvelles difficultés liées au contexte macro. Les liquidations sur la tech mondiale et la hausse des rendements des trésoreries ont déclenché une prise de profits localisée.
Passons en revue la configuration du graphique pour voir où le prix pourrait aller ensuite.Niveaux techniques à surveillerSupport immédiat : 64 000 $ – Le BTC évolue actuellement juste au-dessus de ce seuil psychologique. Une clôture solide sur 4 heures sous cette ligne de tendance menace une correction plus profonde.Résistance : 68 000 $ – C’est la principale zone de résistance au-dessus du prix. Les acheteurs qui avaient participé au rebond de 15 % depuis les plus bas du début juillet scrutent de près cette zone pour prendre des profits.Indicateurs & signaux de marchéMoyennes mobiles : Sur le graphique 4 heures à court terme, la moyenne mobile sur 50 jours reste en pente haussière. En revanche, la moyenne mobile quotidienne sur 200 jours agit comme une résistance dynamique.Volume & momentum : Le volume de vente a légèrement augmenté au cours des dernières 24 heures. Surveillez de près le RSI sur des timeframes plus bas : s’il atteint une zone profondément survendue, attendez-vous à un rebond de soulagement à court terme.Grande image : Le sentiment de marché penche actuellement vers la prudence, car Bitcoin continue de corréler étroitement avec les valeurs de forte croissance comme l’indice Nasdaq-100.💡
Stratégie de trading : Les traders patients attendent une cassure nette au-dessus de 68 000 $ ou un rebond confirmé et un maintien dynamique au niveau de base des 64 000 $ avant de construire des positions longues plus agressives. La gestion du risque et l’utilisation de stops-loss serrés sont non négociables dans cet environnement à forte volatilité.Quelle est votre décision ? Vous achetez la baisse ou vous attendez une confirmation ? 👇
$BTC
Titre : 📊 Flash sur le marché du BTC : la baisse technique teste un support de ligne de tendance crucial !Bitcoin ($BTC ) fait face à de nouvelles difficultés liées au contexte macro. Les liquidations sur la tech mondiale et la hausse des rendements des trésoreries ont déclenché une prise de profits localisée.
Passons en revue la configuration du graphique pour voir où le prix pourrait aller ensuite.Niveaux techniques à surveillerSupport immédiat : 64 000 $ – Le BTC évolue actuellement juste au-dessus de ce seuil psychologique. Une clôture solide sur 4 heures sous cette ligne de tendance menace une correction plus profonde.Résistance : 68 000 $ – C’est la principale zone de résistance au-dessus du prix. Les acheteurs qui avaient participé au rebond de 15 % depuis les plus bas du début juillet scrutent de près cette zone pour prendre des profits.Indicateurs & signaux de marchéMoyennes mobiles : Sur le graphique 4 heures à court terme, la moyenne mobile sur 50 jours reste en pente haussière. En revanche, la moyenne mobile quotidienne sur 200 jours agit comme une résistance dynamique.Volume & momentum : Le volume de vente a légèrement augmenté au cours des dernières 24 heures. Surveillez de près le RSI sur des timeframes plus bas : s’il atteint une zone profondément survendue, attendez-vous à un rebond de soulagement à court terme.Grande image : Le sentiment de marché penche actuellement vers la prudence, car Bitcoin continue de corréler étroitement avec les valeurs de forte croissance comme l’indice Nasdaq-100.💡
Stratégie de trading : Les traders patients attendent une cassure nette au-dessus de 68 000 $ ou un rebond confirmé et un maintien dynamique au niveau de base des 64 000 $ avant de construire des positions longues plus agressives. La gestion du risque et l’utilisation de stops-loss serrés sont non négociables dans cet environnement à forte volatilité.Quelle est votre décision ? Vous achetez la baisse ou vous attendez une confirmation ? 👇
$BTC
Passons en revue la configuration du graphique pour voir où le prix pourrait aller ensuite.Niveaux techniques à surveillerSupport immédiat : 64 000 $ – Le BTC évolue actuellement juste au-dessus de ce seuil psychologique. Une clôture solide sur 4 heures sous cette ligne de tendance menace une correction plus profonde.Résistance : 68 000 $ – C’est la principale zone de résistance au-dessus du prix. Les acheteurs qui avaient participé au rebond de 15 % depuis les plus bas du début juillet scrutent de près cette zone pour prendre des profits.Indicateurs & signaux de marchéMoyennes mobiles : Sur le graphique 4 heures à court terme, la moyenne mobile sur 50 jours reste en pente haussière. En revanche, la moyenne mobile quotidienne sur 200 jours agit comme une résistance dynamique.Volume & momentum : Le volume de vente a légèrement augmenté au cours des dernières 24 heures. Surveillez de près le RSI sur des timeframes plus bas : s’il atteint une zone profondément survendue, attendez-vous à un rebond de soulagement à court terme.Grande image : Le sentiment de marché penche actuellement vers la prudence, car Bitcoin continue de corréler étroitement avec les valeurs de forte croissance comme l’indice Nasdaq-100.💡
Stratégie de trading : Les traders patients attendent une cassure nette au-dessus de 68 000 $ ou un rebond confirmé et un maintien dynamique au niveau de base des 64 000 $ avant de construire des positions longues plus agressives. La gestion du risque et l’utilisation de stops-loss serrés sont non négociables dans cet environnement à forte volatilité.Quelle est votre décision ? Vous achetez la baisse ou vous attendez une confirmation ? 👇
$BTC
1
74
·
--
#BinancePickAndWin
1. ⚽ Rejoignez la promo FIFA de Binance ! Utilisez mon parrainage et débloquez des récompenses jusqu’aux avantages FIFA !
2. 🚀 Inscrivez-vous sur Binance avec mon parrainage et profitez de récompenses exclusives pour la campagne FIFA !
3. ⚽ Binance x FIFA est là ! Enregistrez-vous avec mon parrainage et réclamez des récompenses passionnantes.
4. 🎉 Rejoignez Binance dès aujourd’hui en utilisant mon code de parrainage et obtenez des récompenses liées à la FIFA !
5. ⚽ Tradez sur Binance avec mon parrainage et tentez de gagner des bonus de la campagne FIFA !
#BinancePickAndWin
#BinancePickAndWin
1. ⚽ Rejoignez la promo FIFA de Binance ! Utilisez mon parrainage et débloquez des récompenses jusqu’aux avantages FIFA !
2. 🚀 Inscrivez-vous sur Binance avec mon parrainage et profitez de récompenses exclusives pour la campagne FIFA !
3. ⚽ Binance x FIFA est là ! Enregistrez-vous avec mon parrainage et réclamez des récompenses passionnantes.
4. 🎉 Rejoignez Binance dès aujourd’hui en utilisant mon code de parrainage et obtenez des récompenses liées à la FIFA !
5. ⚽ Tradez sur Binance avec mon parrainage et tentez de gagner des bonus de la campagne FIFA !
#BinancePickAndWin
1. ⚽ Rejoignez la promo FIFA de Binance ! Utilisez mon parrainage et débloquez des récompenses jusqu’aux avantages FIFA !
2. 🚀 Inscrivez-vous sur Binance avec mon parrainage et profitez de récompenses exclusives pour la campagne FIFA !
3. ⚽ Binance x FIFA est là ! Enregistrez-vous avec mon parrainage et réclamez des récompenses passionnantes.
4. 🎉 Rejoignez Binance dès aujourd’hui en utilisant mon code de parrainage et obtenez des récompenses liées à la FIFA !
5. ⚽ Tradez sur Binance avec mon parrainage et tentez de gagner des bonus de la campagne FIFA !
#BinancePickAndWin
1
1
·
--
Haussier
$Auparavant, nous avons vu deux rejets confirmés sur la même grille Fib descendante :
$98k - rejet du niveau Fib 0,618 (déc./jan.)
$83,5k - rejet du niveau Fib 0,382 (mai)
BTC a rebondi à $64,8k et se dirige désormais directement vers la zone de rejet située au-dessus
Quatre confluences se superposent dans la zone des $68-69k :
> POC à $68,083 - le nœud de volume le plus lourd de toute cette structure
> Niveau Fibonacci 0,786 à $68,083 - tombe exactement au même prix que le POC
> STH Realized Price à $69,007 - tous les détenteurs à court terme qui ont acheté au-dessus sont en perte et reviennent vendre pour revenir au seuil de rentabilité
> Moyenne mobile 200 jours à ~ $67,800 - a servi de résistance majeure depuis le début du marché baissier
Données techniques, volume et pression de vente on-chain convergent tous vers le même prix
Si cela se déroule comme les deux rejets précédents, l’extension 1,272 à $49,528 sera la prochaine cible sous les $60k
Abonnez-vous pour plus de mises à jour $BTC
{spot}(BTCUSDT)
$Auparavant, nous avons vu deux rejets confirmés sur la même grille Fib descendante :
$98k - rejet du niveau Fib 0,618 (déc./jan.)
$83,5k - rejet du niveau Fib 0,382 (mai)
BTC a rebondi à $64,8k et se dirige désormais directement vers la zone de rejet située au-dessus
Quatre confluences se superposent dans la zone des $68-69k :
> POC à $68,083 - le nœud de volume le plus lourd de toute cette structure
> Niveau Fibonacci 0,786 à $68,083 - tombe exactement au même prix que le POC
> STH Realized Price à $69,007 - tous les détenteurs à court terme qui ont acheté au-dessus sont en perte et reviennent vendre pour revenir au seuil de rentabilité
> Moyenne mobile 200 jours à ~ $67,800 - a servi de résistance majeure depuis le début du marché baissier
Données techniques, volume et pression de vente on-chain convergent tous vers le même prix
Si cela se déroule comme les deux rejets précédents, l’extension 1,272 à $49,528 sera la prochaine cible sous les $60k
Abonnez-vous pour plus de mises à jour $BTC
$98k - rejet du niveau Fib 0,618 (déc./jan.)
$83,5k - rejet du niveau Fib 0,382 (mai)
BTC a rebondi à $64,8k et se dirige désormais directement vers la zone de rejet située au-dessus
Quatre confluences se superposent dans la zone des $68-69k :
> POC à $68,083 - le nœud de volume le plus lourd de toute cette structure
> Niveau Fibonacci 0,786 à $68,083 - tombe exactement au même prix que le POC
> STH Realized Price à $69,007 - tous les détenteurs à court terme qui ont acheté au-dessus sont en perte et reviennent vendre pour revenir au seuil de rentabilité
> Moyenne mobile 200 jours à ~ $67,800 - a servi de résistance majeure depuis le début du marché baissier
Données techniques, volume et pression de vente on-chain convergent tous vers le même prix
Si cela se déroule comme les deux rejets précédents, l’extension 1,272 à $49,528 sera la prochaine cible sous les $60k
Abonnez-vous pour plus de mises à jour $BTC
1
95
·
--
#BinanceTurns9 Binance fête ses 9 ans - Conçu par vous
#BinanceTurns9 Binance fête ses 9 ans - Conçu par vous

1
2
·
--
1. ⚽ Rejoignez la promotion FIFA de Binance ! Utilisez mon code de parrainage et débloquez des récompenses jusqu’aux avantages FIFA !
2. 🚀 Inscrivez-vous sur Binance avec mon parrainage et profitez de récompenses exclusives de la campagne FIFA !
3. ⚽ Binance x FIFA est là ! Enregistrez-vous avec mon parrainage et réclamez des récompenses passionnantes.
4. 🎉 Rejoignez Binance dès aujourd’hui en utilisant mon code de parrainage et obtenez des récompenses liées à la FIFA !
5. ⚽ Échangez sur Binance avec mon parrainage et courez la chance de gagner des bonus de la campagne FIFA !
#BinancePickAndWin
1. ⚽ Rejoignez la promotion FIFA de Binance ! Utilisez mon code de parrainage et débloquez des récompenses jusqu’aux avantages FIFA !
2. 🚀 Inscrivez-vous sur Binance avec mon parrainage et profitez de récompenses exclusives de la campagne FIFA !
3. ⚽ Binance x FIFA est là ! Enregistrez-vous avec mon parrainage et réclamez des récompenses passionnantes.
4. 🎉 Rejoignez Binance dès aujourd’hui en utilisant mon code de parrainage et obtenez des récompenses liées à la FIFA !
5. ⚽ Échangez sur Binance avec mon parrainage et courez la chance de gagner des bonus de la campagne FIFA !
#BinancePickAndWin
2. 🚀 Inscrivez-vous sur Binance avec mon parrainage et profitez de récompenses exclusives de la campagne FIFA !
3. ⚽ Binance x FIFA est là ! Enregistrez-vous avec mon parrainage et réclamez des récompenses passionnantes.
4. 🎉 Rejoignez Binance dès aujourd’hui en utilisant mon code de parrainage et obtenez des récompenses liées à la FIFA !
5. ⚽ Échangez sur Binance avec mon parrainage et courez la chance de gagner des bonus de la campagne FIFA !
#BinancePickAndWin
1
5
·
--
Haussier
#BinanceTurns9 Binance fête ses 9 ans - Conçu par vous
#BinanceTurns9 Binance fête ses 9 ans - Conçu par vous

Connectez-vous pour découvrir plus de contenu
Rejoignez la communauté mondiale des adeptes de cryptomonnaies sur Binance Square
⚡️ Suviez les dernières informations importantes sur les cryptomonnaies.
💬 Jugé digne de confiance par la plus grande plateforme d’échange de cryptomonnaies au monde.
👍 Découvrez les connaissances que partagent les créateurs vérifiés.
Adresse e-mail/Nº de téléphone
Sujets d’actualité
ADAGains10%Above$0.27
899 vues
49 mentions
$ADA franchit les résistances et consolide au-dessus de 0,274 $ ! Analyse technique des contrats à terme perpétuels
La paire ADA/USDT sur les contrats à terme perpétuels enregistre une hausse de plus de 12 % en 24 heures, atteignant un sommet intrajournalier de 0,2768 $, avec un volume échangé de plus de 485 millions de USDT (1,84 milliard d’ADA).
Niveaux et indicateurs clés sur le graphique :
La bougie de 4 h a confirmé une nette cassure au-dessus de la précédente zone de consolidation (0,232 $ – 0,251 $) et s’est détachée de la MA(99), située à 0,246 $. Toutefois, le RSI(6) à 89,69 et le StochRSI à 99,26 indiquent que le mouvement entre en zone de surachat prolongé, où des prises de bénéfices ou des pauses latérales sont fréquentes.
À court terme, le prix se resserre autour de la MA(7) à 0,2744 $, tandis que la MA(25), à 0,2728 $, joue le rôle de premier support dynamique.
Tant que ce niveau tient, la structure haussière à court terme reste intacte. L’intérêt ouvert se maintient à 484 millions. Cela montre que la zone haute bénéficie d’un soutien et d’une confiance suffisants, empêchant le prix de chuter brusquement comme une rangée de dominos faute d’acheteurs.
Pour poursuivre sa hausse vers la zone des 0,29 $ – 0,30 $, l’actif doit maintenir les 0,270 $ – 0,272 $ comme nouveau support. Si l’épuisement de l’indicateur journalier entraîne un refroidissement, la zone de repli saine se situe vers la MA(25) en 4 h, près de 0,251 $.
Partage ton point d’entrée dans les commentaires !
#ADAGains10%Above$0.27
ALØNDRACRYPTØ1
·3 mentions J’aime
·1.4k vues
ETHUp70%InQ3ButLiquidityFalls
13,805 vues
257 mentions
EthStakingExitQueueHits2026High
5,157 vues
271 mentions