
Huutruong
10.5k Publications

Huutruong
Signaler
Bloquer l’utilisateur
💰 Theo dõi Crypto | Tìm kiếm cơ hội mỗi ngày ( KITE-277880 )
Ouvert au trading
Trade fréquemment
5.5 an(s)
3.6K+ Suivis
2.4K+ Abonnés
847 J’aime
Publications
Portefeuille
Tous
Citations
Vidéos
Direct
·
--
Baissier
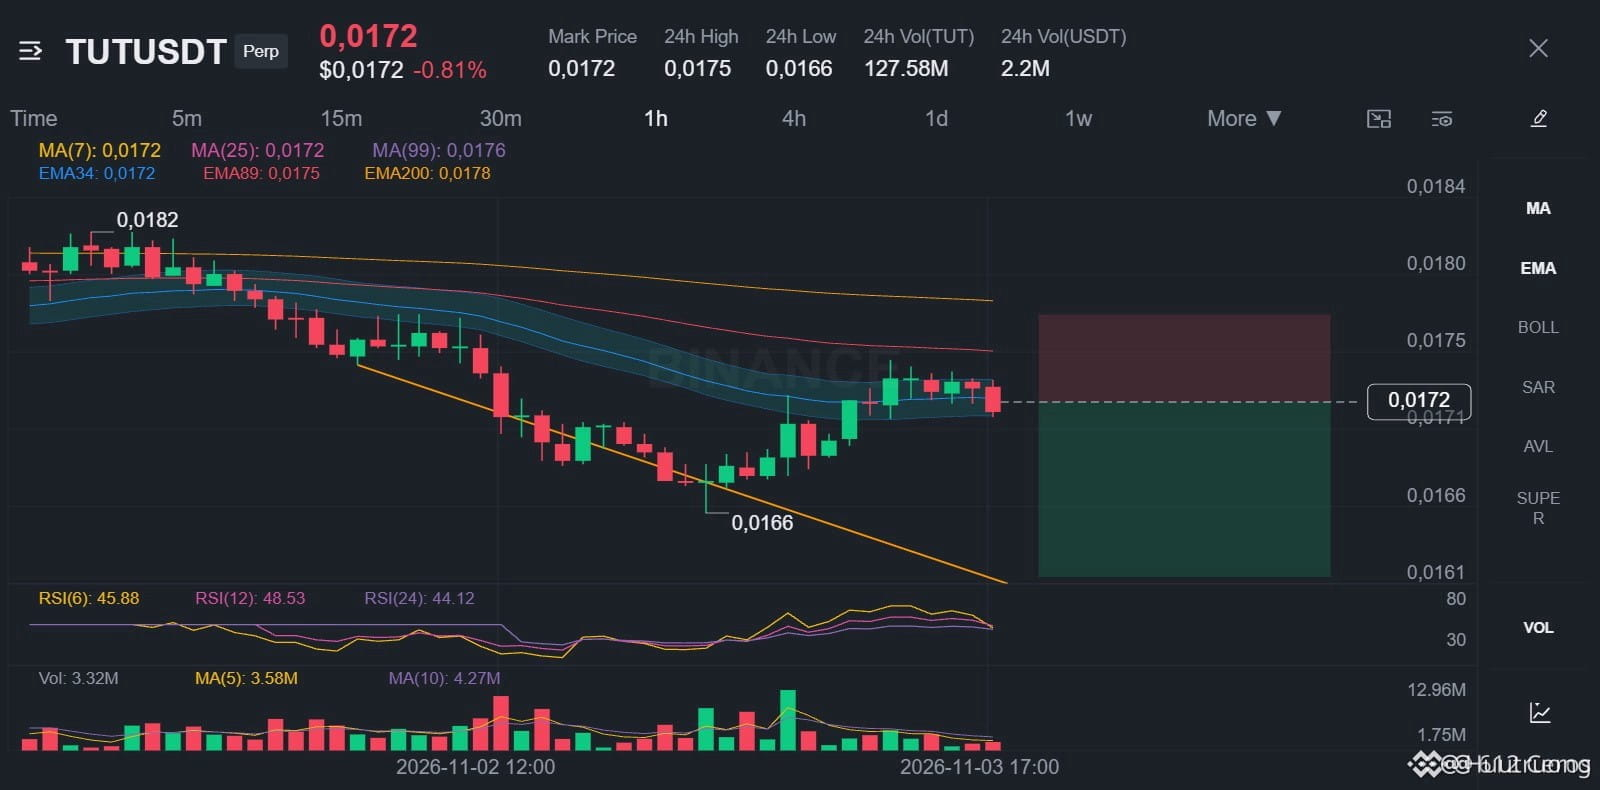
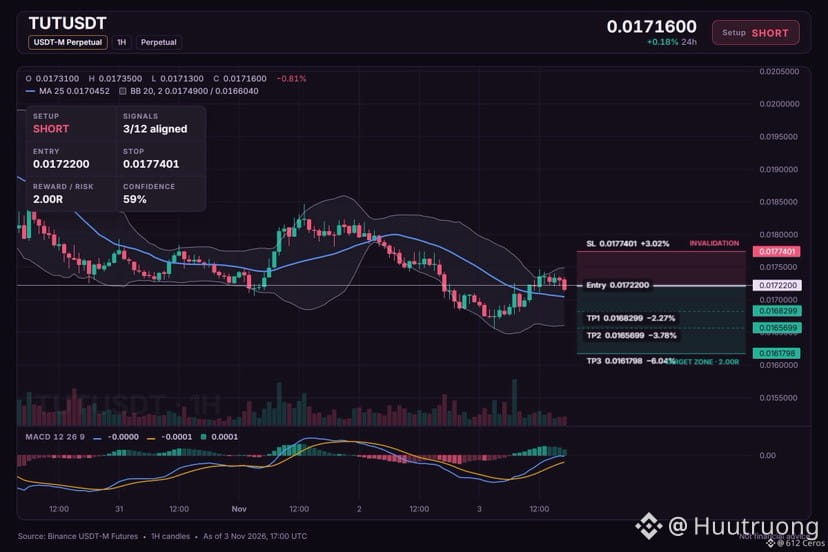
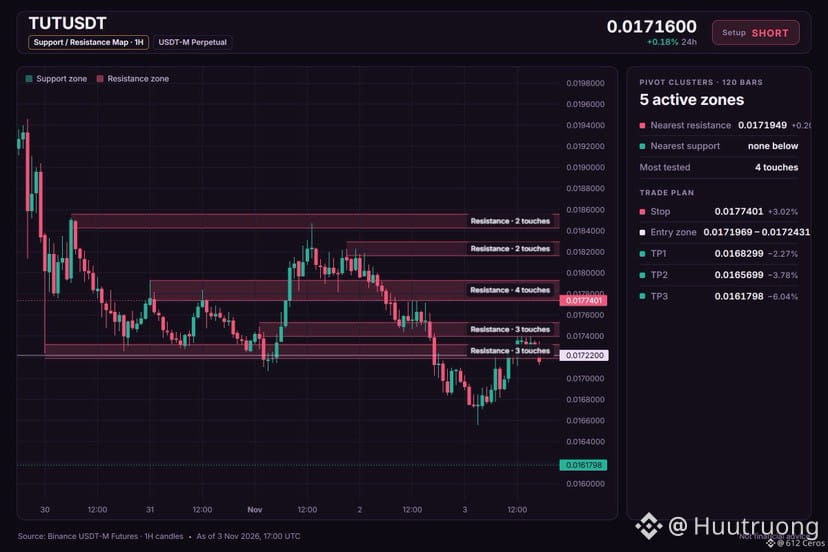
Configuration short sur TUT : les niveaux que je surveille
🔴 SHORT $TUT /USDT : le prix devrait BAISSER
Biais : SHORT · Plutôt baissier
Entrée : 0.0171969 – 0.0172431
TP1 : 0.0168299 (-2.3%)
TP2 : 0.0165699 (-3.8%)
TP3 : 0.0161798 (-6.0%)
SL : 0.0177401 (+3.0%)
Plan : entrer uniquement dans la zone, clôturer 50 % à TP1, 25 % à TP2, 25 % à TP3, et déplacer le stop au prix d’entrée après TP1.
Remarque : conviction modérée seulement, gardez une petite position.
Pourquoi SHORT ? 3/12 signaux sont d’accord, 1 est à contre-courant.
• Tendance 4h baissière (sous EMA50 et EMA200)
• Tendance 1h baissière (sous EMA50 et EMA200)
• Les vendeurs mènent le mouvement (ADX 15m à 22.1)
Risque : le BTC monte, cette cryptomonnaie le suit (corr. 0.60)
Le raisonnement :
La tendance journalière est latérale, et 3/12 signaux alignés favorisent la vente à découvert. Le plan consiste à intervenir dans la zone 0.0171969 – 0.0172431, à alléger la position à 0.0168299 et 0.0165699, et à patienter pour atteindre 0.0161798. Un mouvement au-dessus de 0.0177401 invaliderait l’idée, et le stop ferait son travail.
TUT atteindra-t-il 0.0168299 en premier, ou le stop sera-t-il touché ?
{spot}(TUTUSDT)
Configuration short sur TUT : les niveaux que je surveille
🔴 SHORT $TUT /USDT : le prix devrait BAISSER
Biais : SHORT · Plutôt baissier
Entrée : 0.0171969 – 0.0172431
TP1 : 0.0168299 (-2.3%)
TP2 : 0.0165699 (-3.8%)
TP3 : 0.0161798 (-6.0%)
SL : 0.0177401 (+3.0%)
Plan : entrer uniquement dans la zone, clôturer 50 % à TP1, 25 % à TP2, 25 % à TP3, et déplacer le stop au prix d’entrée après TP1.
Remarque : conviction modérée seulement, gardez une petite position.
Pourquoi SHORT ? 3/12 signaux sont d’accord, 1 est à contre-courant.
• Tendance 4h baissière (sous EMA50 et EMA200)
• Tendance 1h baissière (sous EMA50 et EMA200)
• Les vendeurs mènent le mouvement (ADX 15m à 22.1)
Risque : le BTC monte, cette cryptomonnaie le suit (corr. 0.60)
Le raisonnement :
La tendance journalière est latérale, et 3/12 signaux alignés favorisent la vente à découvert. Le plan consiste à intervenir dans la zone 0.0171969 – 0.0172431, à alléger la position à 0.0168299 et 0.0165699, et à patienter pour atteindre 0.0161798. Un mouvement au-dessus de 0.0177401 invaliderait l’idée, et le stop ferait son travail.
TUT atteindra-t-il 0.0168299 en premier, ou le stop sera-t-il touché ?
🔴 SHORT $TUT /USDT : le prix devrait BAISSER
Biais : SHORT · Plutôt baissier
Entrée : 0.0171969 – 0.0172431
TP1 : 0.0168299 (-2.3%)
TP2 : 0.0165699 (-3.8%)
TP3 : 0.0161798 (-6.0%)
SL : 0.0177401 (+3.0%)
Plan : entrer uniquement dans la zone, clôturer 50 % à TP1, 25 % à TP2, 25 % à TP3, et déplacer le stop au prix d’entrée après TP1.
Remarque : conviction modérée seulement, gardez une petite position.
Pourquoi SHORT ? 3/12 signaux sont d’accord, 1 est à contre-courant.
• Tendance 4h baissière (sous EMA50 et EMA200)
• Tendance 1h baissière (sous EMA50 et EMA200)
• Les vendeurs mènent le mouvement (ADX 15m à 22.1)
Risque : le BTC monte, cette cryptomonnaie le suit (corr. 0.60)
Le raisonnement :
La tendance journalière est latérale, et 3/12 signaux alignés favorisent la vente à découvert. Le plan consiste à intervenir dans la zone 0.0171969 – 0.0172431, à alléger la position à 0.0168299 et 0.0165699, et à patienter pour atteindre 0.0161798. Un mouvement au-dessus de 0.0177401 invaliderait l’idée, et le stop ferait son travail.
TUT atteindra-t-il 0.0168299 en premier, ou le stop sera-t-il touché ?
15
·
--
Haussier
Voir la traduction
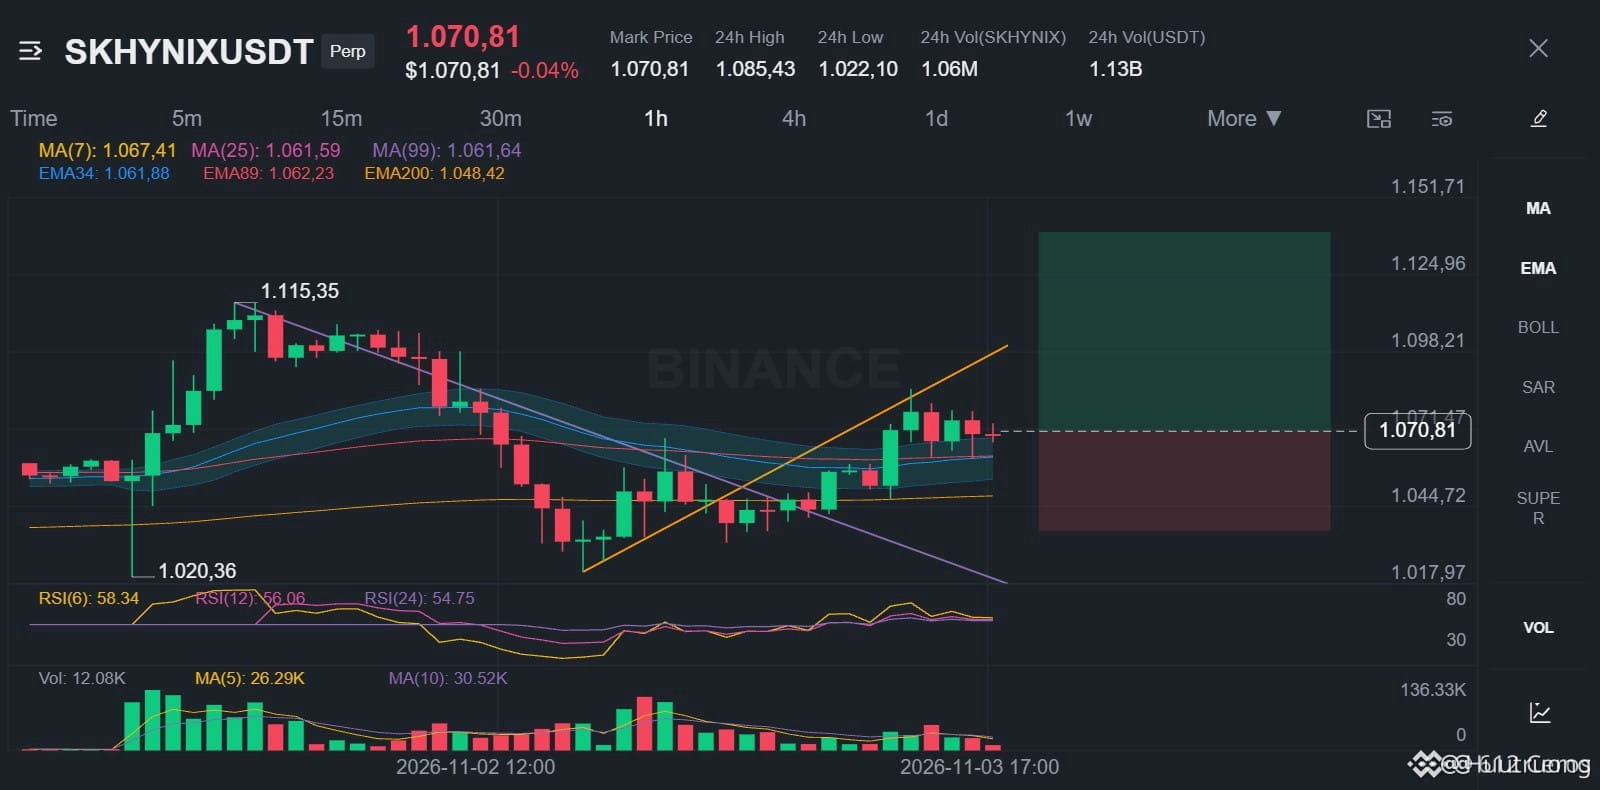
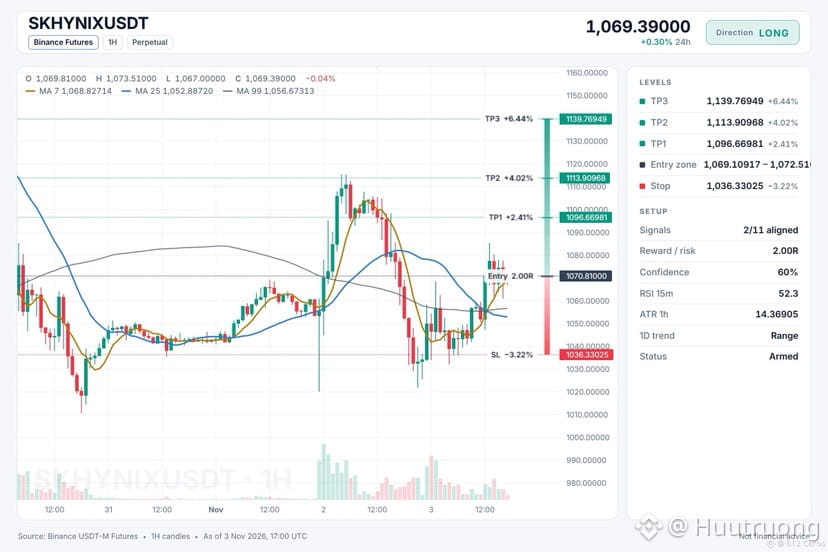
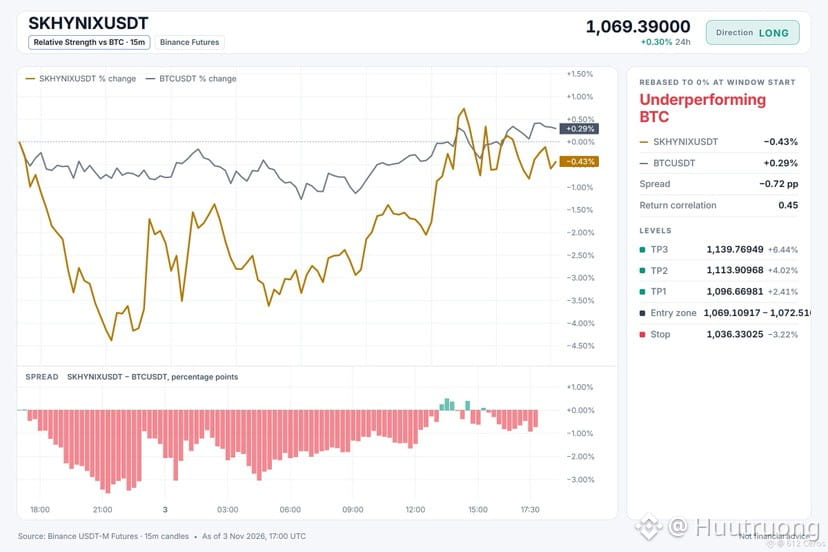
Range-bound SKHYNIX looks to push higher
🟢 LONG $SKHYNIX /USDT: expecting price to go UP
Bias: LONG · Leaning
Entry: 1069.10917 – 1072.51083
TP1: 1096.66981 (+2.4%)
TP2: 1113.90968 (+4.0%)
TP3: 1139.76949 (+6.4%)
SL: 1036.33025 (-3.2%)
Plan: enter only inside the zone, close 50% at TP1, 25% at TP2, 25% at TP3, and move the stop to entry after TP1.
Note: moderate conviction only, keep size light.
Why LONG? 2/11 signals agree, 0 against.
• 1h trend up (above EMA50 & EMA200)
• Buyers are driving the move (15m ADX 23.1)
Q: Why long when the daily trend is range?
A: The 1h price shows a bullish stack with buyers driving the move.
Q: When is this long wrong?
A: A break below 1036.33025 invalidates the setup and signals the stack is gone.
What is your invalidation level for SKHYNIX?
{future}(SKHYNIXUSDT)
Range-bound SKHYNIX looks to push higher
🟢 LONG $SKHYNIX /USDT: expecting price to go UP
Bias: LONG · Leaning
Entry: 1069.10917 – 1072.51083
TP1: 1096.66981 (+2.4%)
TP2: 1113.90968 (+4.0%)
TP3: 1139.76949 (+6.4%)
SL: 1036.33025 (-3.2%)
Plan: enter only inside the zone, close 50% at TP1, 25% at TP2, 25% at TP3, and move the stop to entry after TP1.
Note: moderate conviction only, keep size light.
Why LONG? 2/11 signals agree, 0 against.
• 1h trend up (above EMA50 & EMA200)
• Buyers are driving the move (15m ADX 23.1)
Q: Why long when the daily trend is range?
A: The 1h price shows a bullish stack with buyers driving the move.
Q: When is this long wrong?
A: A break below 1036.33025 invalidates the setup and signals the stack is gone.
What is your invalidation level for SKHYNIX?
🟢 LONG $SKHYNIX /USDT: expecting price to go UP
Bias: LONG · Leaning
Entry: 1069.10917 – 1072.51083
TP1: 1096.66981 (+2.4%)
TP2: 1113.90968 (+4.0%)
TP3: 1139.76949 (+6.4%)
SL: 1036.33025 (-3.2%)
Plan: enter only inside the zone, close 50% at TP1, 25% at TP2, 25% at TP3, and move the stop to entry after TP1.
Note: moderate conviction only, keep size light.
Why LONG? 2/11 signals agree, 0 against.
• 1h trend up (above EMA50 & EMA200)
• Buyers are driving the move (15m ADX 23.1)
Q: Why long when the daily trend is range?
A: The 1h price shows a bullish stack with buyers driving the move.
Q: When is this long wrong?
A: A break below 1036.33025 invalidates the setup and signals the stack is gone.
What is your invalidation level for SKHYNIX?
22
·
--
Haussier
Voir la traduction
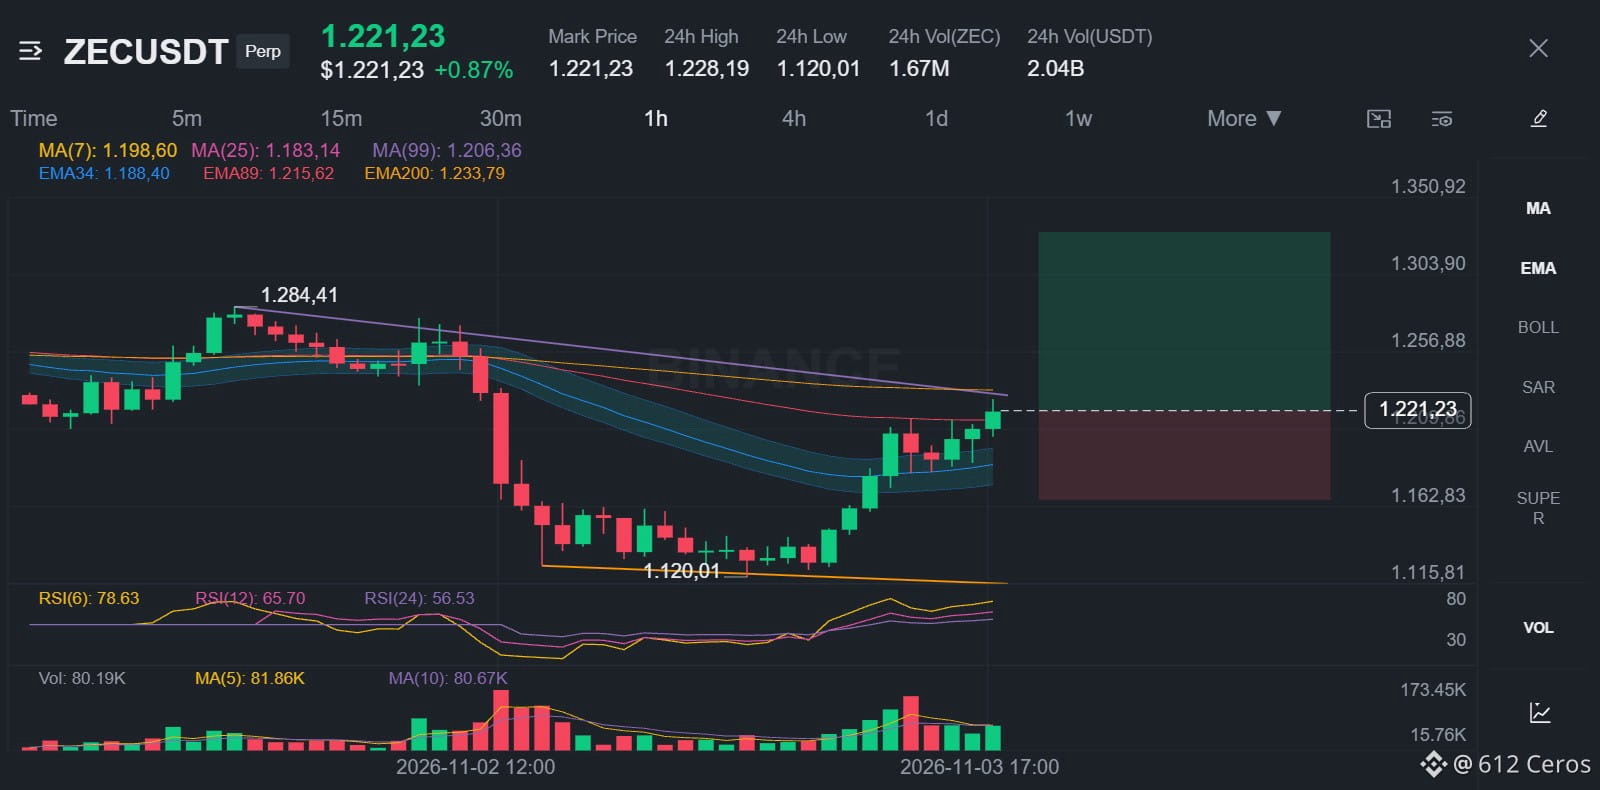
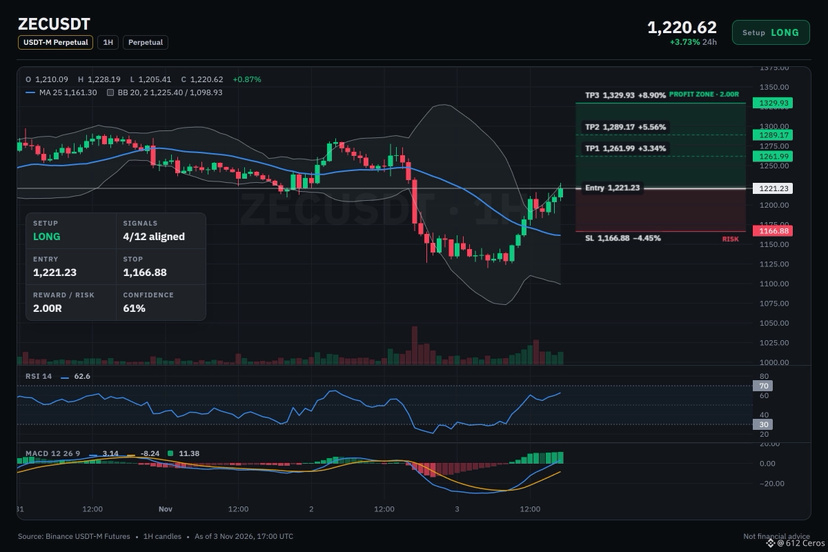
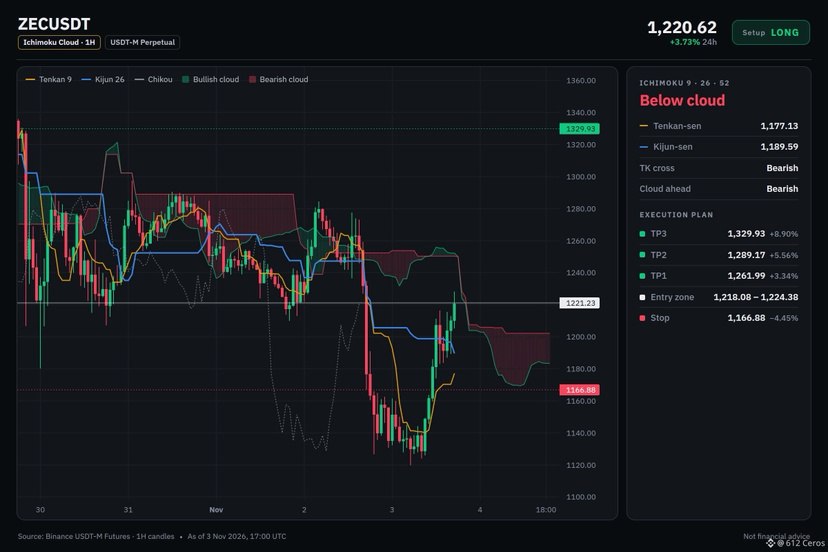
ZEC leans long on a daily bullish stack
🟢 LONG $ZEC /USDT: expecting price to go UP
Bias: LONG · Leaning
Entry: 1218.08 – 1224.38
TP1: 1261.99 (+3.3%)
TP2: 1289.17 (+5.6%)
TP3: 1329.93 (+8.9%)
SL: 1166.88 (-4.5%)
Plan: enter only inside the zone, close 50% at TP1, 25% at TP2, 25% at TP3, and move the stop to entry after TP1.
Note: moderate conviction only, keep size light.
Why LONG? What I checked: 4/12 agree, 1 against.
• Daily trend up (above EMA50 & EMA200)
• Buyers are driving the move (15m ADX 28.1)
• Buyers have the momentum (1h RSI 62.6)
Watch: 4h trend down (below EMA50 & EMA200)
Watch: The idea is wrong if price reaches the stop at 1166.88
Bottom line: The daily trend is up, which outweighs the 4h swing trend being down, so conviction is moderate.
Where would you place your stop for this ZEC long?
{spot}(ZECUSDT)
ZEC leans long on a daily bullish stack
🟢 LONG $ZEC /USDT: expecting price to go UP
Bias: LONG · Leaning
Entry: 1218.08 – 1224.38
TP1: 1261.99 (+3.3%)
TP2: 1289.17 (+5.6%)
TP3: 1329.93 (+8.9%)
SL: 1166.88 (-4.5%)
Plan: enter only inside the zone, close 50% at TP1, 25% at TP2, 25% at TP3, and move the stop to entry after TP1.
Note: moderate conviction only, keep size light.
Why LONG? What I checked: 4/12 agree, 1 against.
• Daily trend up (above EMA50 & EMA200)
• Buyers are driving the move (15m ADX 28.1)
• Buyers have the momentum (1h RSI 62.6)
Watch: 4h trend down (below EMA50 & EMA200)
Watch: The idea is wrong if price reaches the stop at 1166.88
Bottom line: The daily trend is up, which outweighs the 4h swing trend being down, so conviction is moderate.
Where would you place your stop for this ZEC long?
🟢 LONG $ZEC /USDT: expecting price to go UP
Bias: LONG · Leaning
Entry: 1218.08 – 1224.38
TP1: 1261.99 (+3.3%)
TP2: 1289.17 (+5.6%)
TP3: 1329.93 (+8.9%)
SL: 1166.88 (-4.5%)
Plan: enter only inside the zone, close 50% at TP1, 25% at TP2, 25% at TP3, and move the stop to entry after TP1.
Note: moderate conviction only, keep size light.
Why LONG? What I checked: 4/12 agree, 1 against.
• Daily trend up (above EMA50 & EMA200)
• Buyers are driving the move (15m ADX 28.1)
• Buyers have the momentum (1h RSI 62.6)
Watch: 4h trend down (below EMA50 & EMA200)
Watch: The idea is wrong if price reaches the stop at 1166.88
Bottom line: The daily trend is up, which outweighs the 4h swing trend being down, so conviction is moderate.
Where would you place your stop for this ZEC long?
25
·
--
Haussier
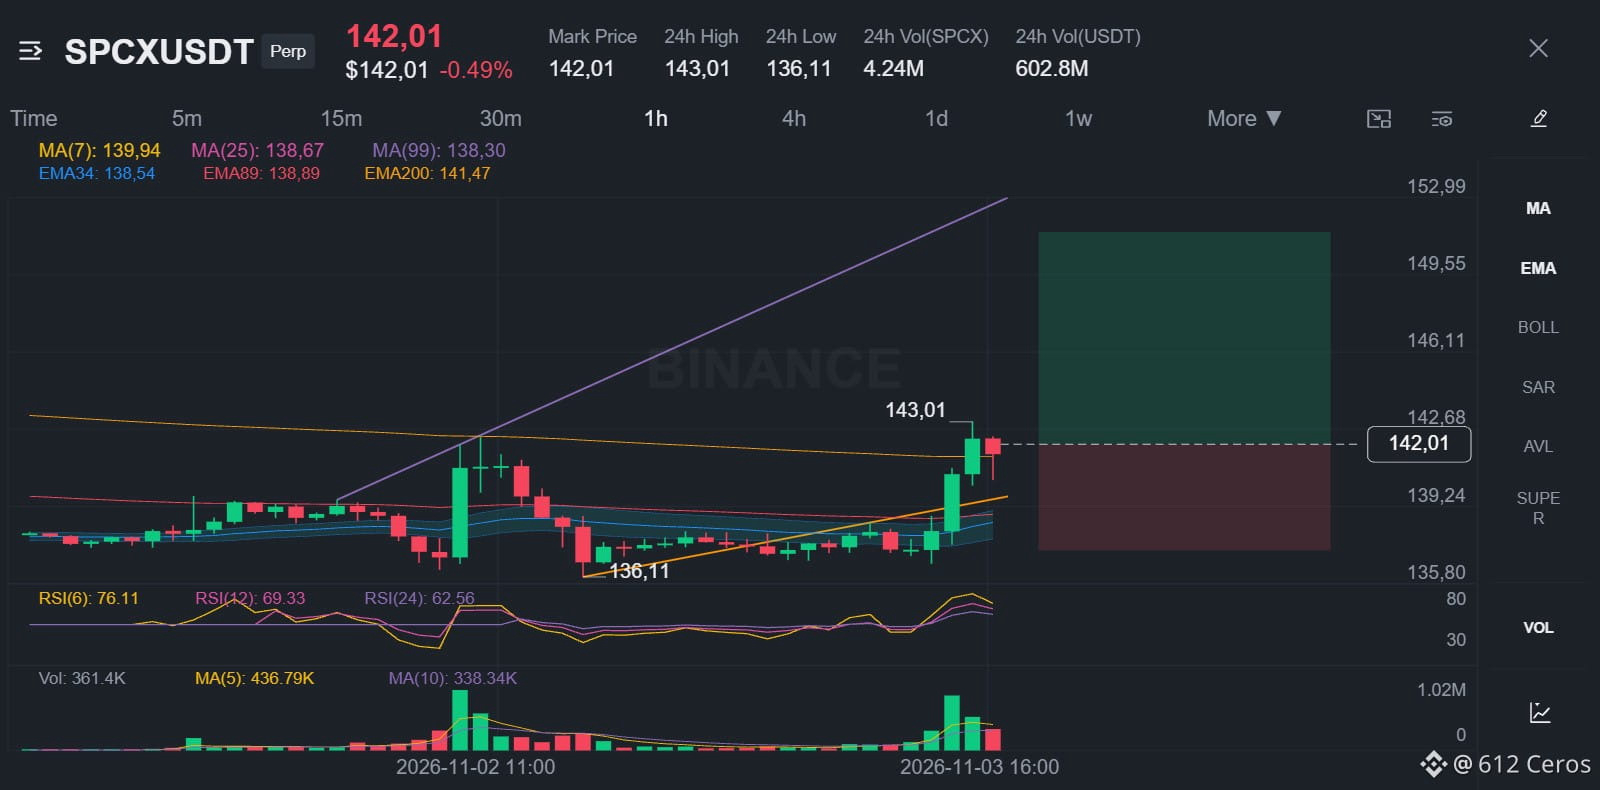
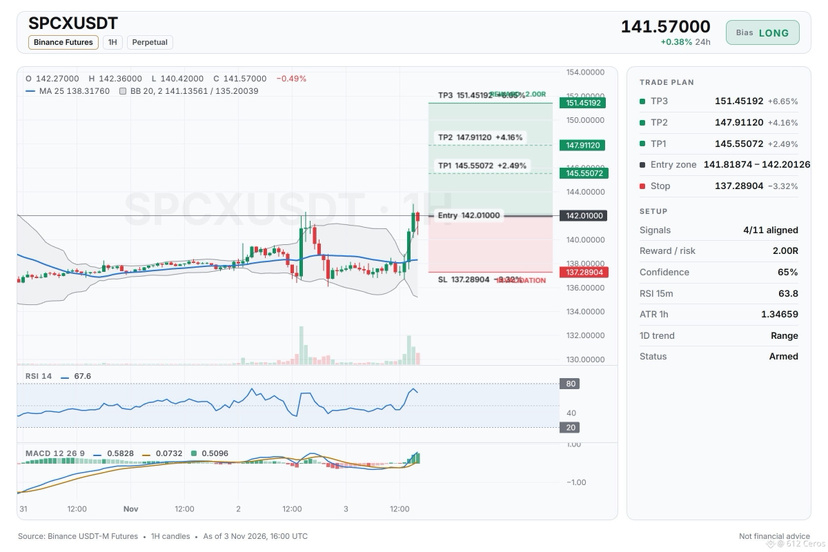
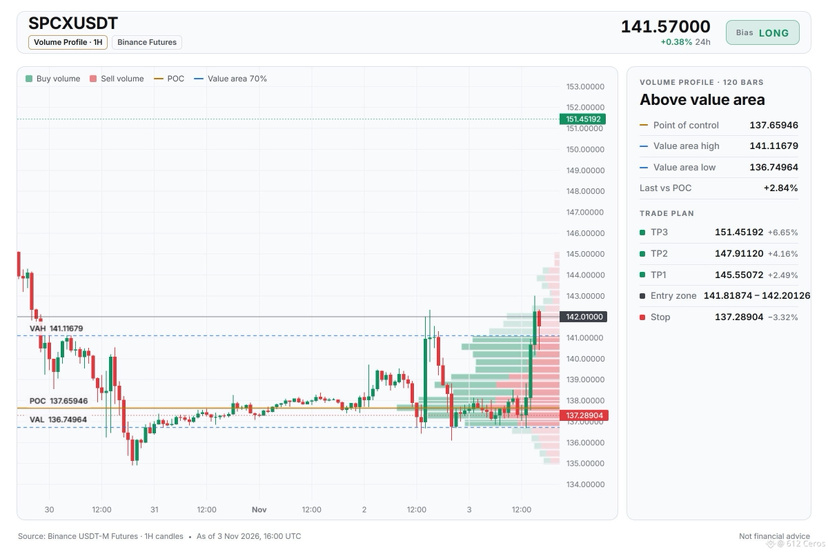
SPCX penche pour une position longue, mais la conviction est faible ici.
🟢 LONG $SPCX /USDT : le prix devrait monter
Biais : LONG · plutôt haussier
Entrée : 141.81874 – 142.20126
TP1 : 145.55072 (+2.5 %)
TP2 : 147.91120 (+4.2 %)
TP3 : 151.45192 (+6.6 %)
SL : 137.28904 (-3.3 %)
Plan : entrer uniquement dans la zone, clôturer 50 % à TP1, 25 % à TP2, 25 % à TP3, et déplacer le stop au prix d’entrée après TP1.
Remarque : conviction modérée uniquement, gardez une position de petite taille.
Pourquoi LONG ? 4/11 signaux sont d’accord, 0 contre.
• Les acheteurs font avancer le mouvement (ADX 15 min : 32.1)
• Les acheteurs ont le momentum (RSI 4 h : 59.9)
• Les acheteurs ont le momentum (RSI 1 h : 67.6)
Plan A :
Si la configuration fonctionne, le prix en 1 h devrait progresser vers le premier objectif, soutenu par un RSI 1 h indiquant un momentum haussier supérieur à 55.
Plan B (invalidation) :
Si la fourchette quotidienne tient et que le prix rejette le point d’entrée, je sortirais au stop.
À quel niveau placeriez-vous votre ordre sur cette transaction ?
{future}(SPCXUSDT)
SPCX penche pour une position longue, mais la conviction est faible ici.
🟢 LONG $SPCX /USDT : le prix devrait monter
Biais : LONG · plutôt haussier
Entrée : 141.81874 – 142.20126
TP1 : 145.55072 (+2.5 %)
TP2 : 147.91120 (+4.2 %)
TP3 : 151.45192 (+6.6 %)
SL : 137.28904 (-3.3 %)
Plan : entrer uniquement dans la zone, clôturer 50 % à TP1, 25 % à TP2, 25 % à TP3, et déplacer le stop au prix d’entrée après TP1.
Remarque : conviction modérée uniquement, gardez une position de petite taille.
Pourquoi LONG ? 4/11 signaux sont d’accord, 0 contre.
• Les acheteurs font avancer le mouvement (ADX 15 min : 32.1)
• Les acheteurs ont le momentum (RSI 4 h : 59.9)
• Les acheteurs ont le momentum (RSI 1 h : 67.6)
Plan A :
Si la configuration fonctionne, le prix en 1 h devrait progresser vers le premier objectif, soutenu par un RSI 1 h indiquant un momentum haussier supérieur à 55.
Plan B (invalidation) :
Si la fourchette quotidienne tient et que le prix rejette le point d’entrée, je sortirais au stop.
À quel niveau placeriez-vous votre ordre sur cette transaction ?
🟢 LONG $SPCX /USDT : le prix devrait monter
Biais : LONG · plutôt haussier
Entrée : 141.81874 – 142.20126
TP1 : 145.55072 (+2.5 %)
TP2 : 147.91120 (+4.2 %)
TP3 : 151.45192 (+6.6 %)
SL : 137.28904 (-3.3 %)
Plan : entrer uniquement dans la zone, clôturer 50 % à TP1, 25 % à TP2, 25 % à TP3, et déplacer le stop au prix d’entrée après TP1.
Remarque : conviction modérée uniquement, gardez une position de petite taille.
Pourquoi LONG ? 4/11 signaux sont d’accord, 0 contre.
• Les acheteurs font avancer le mouvement (ADX 15 min : 32.1)
• Les acheteurs ont le momentum (RSI 4 h : 59.9)
• Les acheteurs ont le momentum (RSI 1 h : 67.6)
Plan A :
Si la configuration fonctionne, le prix en 1 h devrait progresser vers le premier objectif, soutenu par un RSI 1 h indiquant un momentum haussier supérieur à 55.
Plan B (invalidation) :
Si la fourchette quotidienne tient et que le prix rejette le point d’entrée, je sortirais au stop.
À quel niveau placeriez-vous votre ordre sur cette transaction ?
15
·
--
Baissier
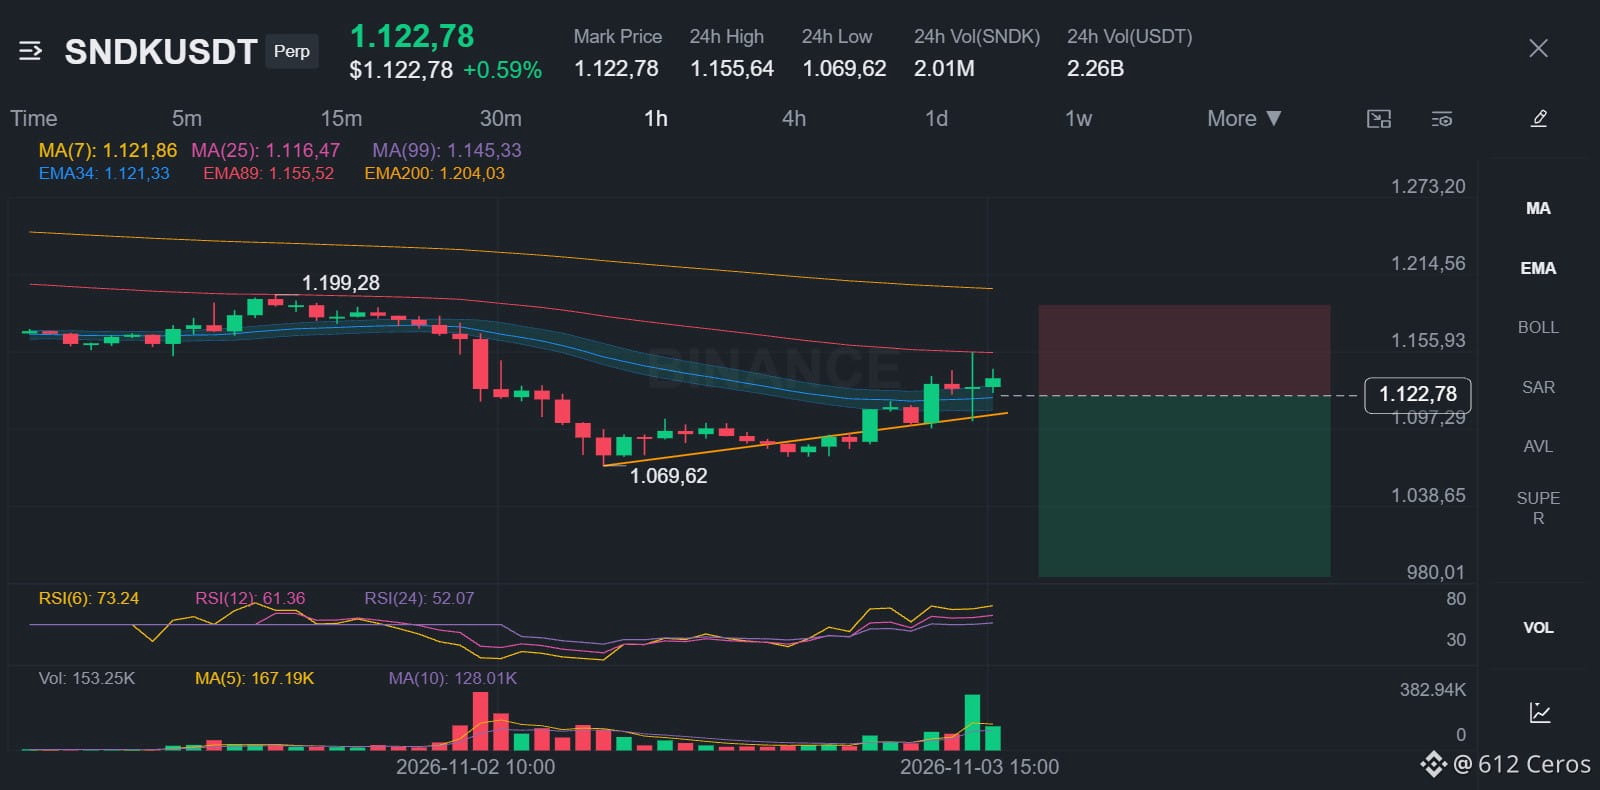
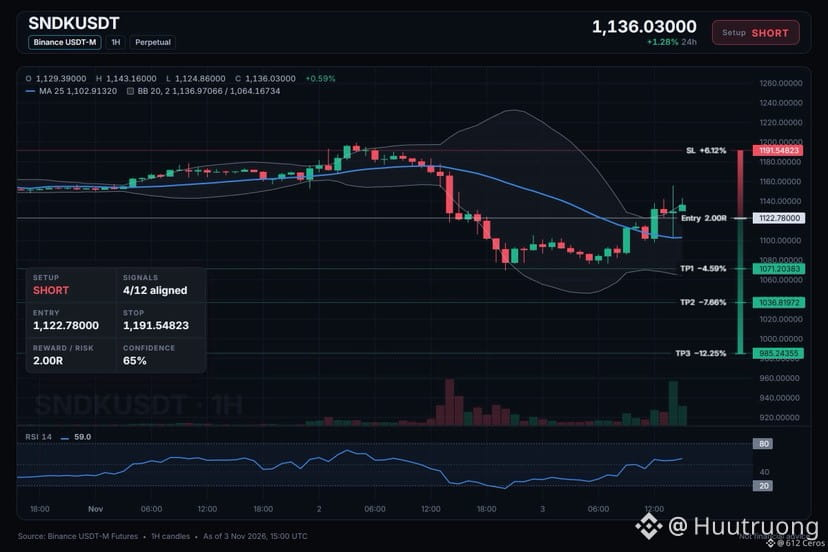
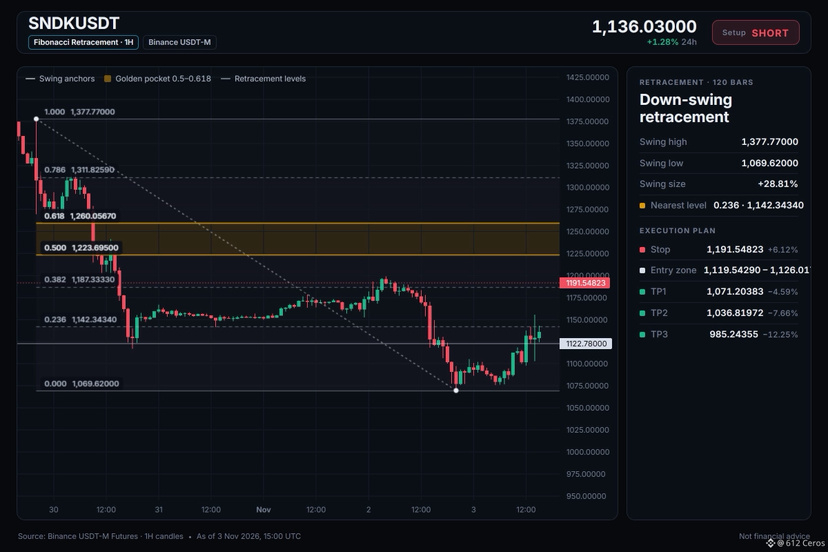
SNDK est fortement baissier sur plusieurs horizons temporels.
🔴 SHORT $SNDK /USDT : le prix devrait BAISSER
Biais : SHORT · Tendance
Entrée : 1119.54290 – 1126.01710
TP1 : 1071.20383 (-4.6%)
TP2 : 1036.81972 (-7.7%)
TP3 : 985.24355 (-12.2%)
SL : 1191.54823 (+6.1%)
Plan : entrez uniquement dans la zone, clôturez 50 % à TP1, 25 % à TP2, 25 % à TP3, et déplacez le stop au prix d’entrée après TP1.
Remarque : conviction modérée uniquement, gardez une position de petite taille.
Pourquoi SHORT ? 4/12 signaux sont d’accord, 1 est contre.
• Tendance journalière baissière (sous EMA50 et EMA200)
• Tendance sur 4 h baissière (sous EMA50 et EMA200)
• Tendance sur 1 h baissière (sous EMA50 et EMA200)
Risque : les acheteurs ont la dynamique (RSI 1 h à 59.0)
Mon analyse de SNDK aujourd’hui
Je surveille SNDK pour une entrée vendeuse sur contrats à terme. La tendance journalière est baissière, le prix étant sous les deux moyennes mobiles, et la tendance sur 4 h est également baissière. Je veux voir les vendeurs garder le contrôle alors que le RSI 1 h indique que les acheteurs ont la dynamique, à 59.0.
Où prenez-vous vos bénéfices sur cette position vendeuse ?
{future}(SNDKUSDT)
SNDK est fortement baissier sur plusieurs horizons temporels.
🔴 SHORT $SNDK /USDT : le prix devrait BAISSER
Biais : SHORT · Tendance
Entrée : 1119.54290 – 1126.01710
TP1 : 1071.20383 (-4.6%)
TP2 : 1036.81972 (-7.7%)
TP3 : 985.24355 (-12.2%)
SL : 1191.54823 (+6.1%)
Plan : entrez uniquement dans la zone, clôturez 50 % à TP1, 25 % à TP2, 25 % à TP3, et déplacez le stop au prix d’entrée après TP1.
Remarque : conviction modérée uniquement, gardez une position de petite taille.
Pourquoi SHORT ? 4/12 signaux sont d’accord, 1 est contre.
• Tendance journalière baissière (sous EMA50 et EMA200)
• Tendance sur 4 h baissière (sous EMA50 et EMA200)
• Tendance sur 1 h baissière (sous EMA50 et EMA200)
Risque : les acheteurs ont la dynamique (RSI 1 h à 59.0)
Mon analyse de SNDK aujourd’hui
Je surveille SNDK pour une entrée vendeuse sur contrats à terme. La tendance journalière est baissière, le prix étant sous les deux moyennes mobiles, et la tendance sur 4 h est également baissière. Je veux voir les vendeurs garder le contrôle alors que le RSI 1 h indique que les acheteurs ont la dynamique, à 59.0.
Où prenez-vous vos bénéfices sur cette position vendeuse ?
🔴 SHORT $SNDK /USDT : le prix devrait BAISSER
Biais : SHORT · Tendance
Entrée : 1119.54290 – 1126.01710
TP1 : 1071.20383 (-4.6%)
TP2 : 1036.81972 (-7.7%)
TP3 : 985.24355 (-12.2%)
SL : 1191.54823 (+6.1%)
Plan : entrez uniquement dans la zone, clôturez 50 % à TP1, 25 % à TP2, 25 % à TP3, et déplacez le stop au prix d’entrée après TP1.
Remarque : conviction modérée uniquement, gardez une position de petite taille.
Pourquoi SHORT ? 4/12 signaux sont d’accord, 1 est contre.
• Tendance journalière baissière (sous EMA50 et EMA200)
• Tendance sur 4 h baissière (sous EMA50 et EMA200)
• Tendance sur 1 h baissière (sous EMA50 et EMA200)
Risque : les acheteurs ont la dynamique (RSI 1 h à 59.0)
Mon analyse de SNDK aujourd’hui
Je surveille SNDK pour une entrée vendeuse sur contrats à terme. La tendance journalière est baissière, le prix étant sous les deux moyennes mobiles, et la tendance sur 4 h est également baissière. Je veux voir les vendeurs garder le contrôle alors que le RSI 1 h indique que les acheteurs ont la dynamique, à 59.0.
Où prenez-vous vos bénéfices sur cette position vendeuse ?
11
·
--
Haussier
Voir la traduction
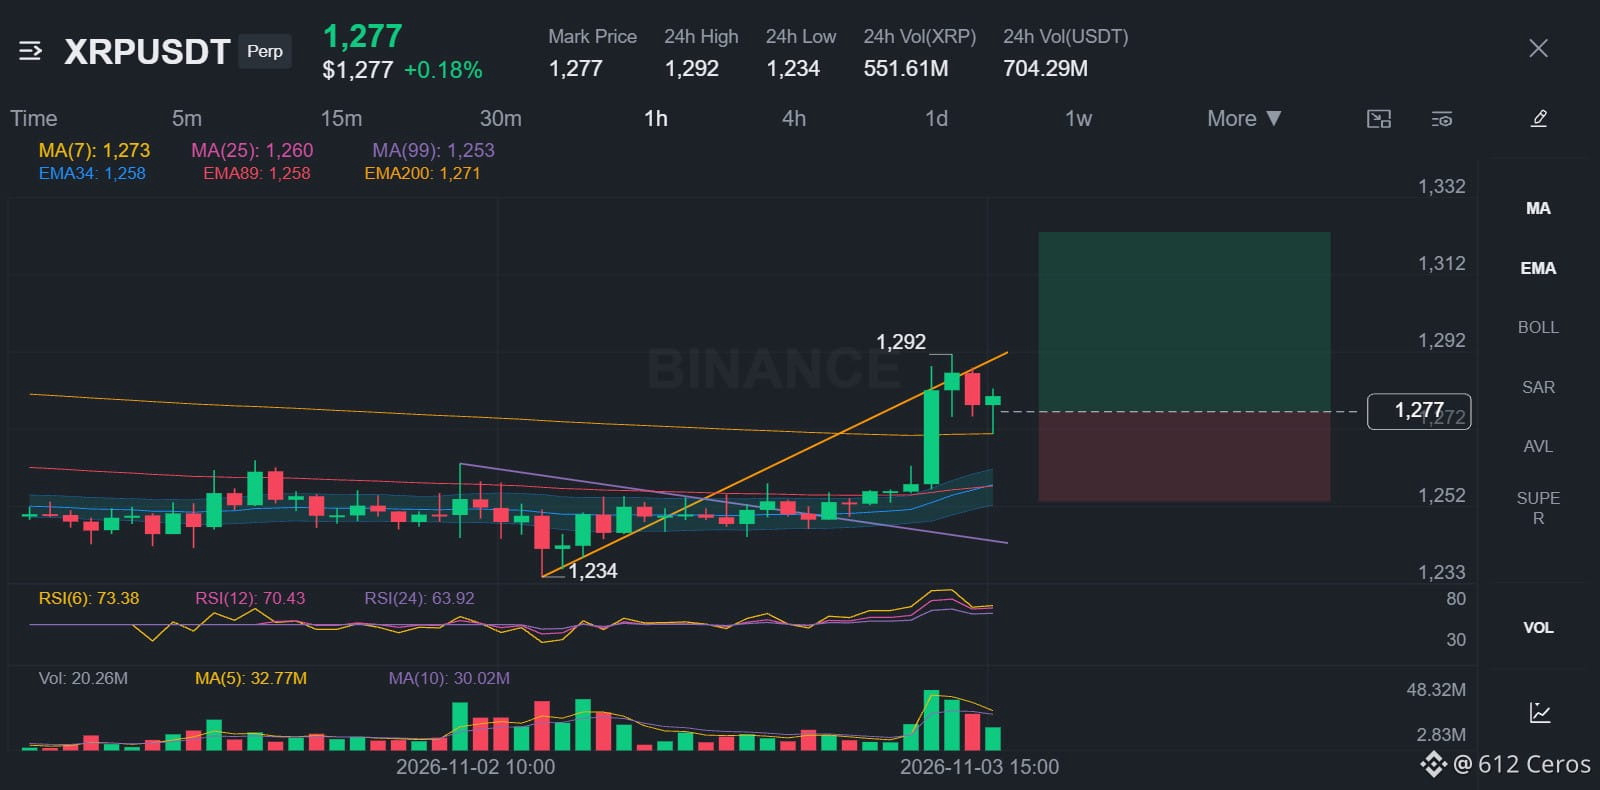
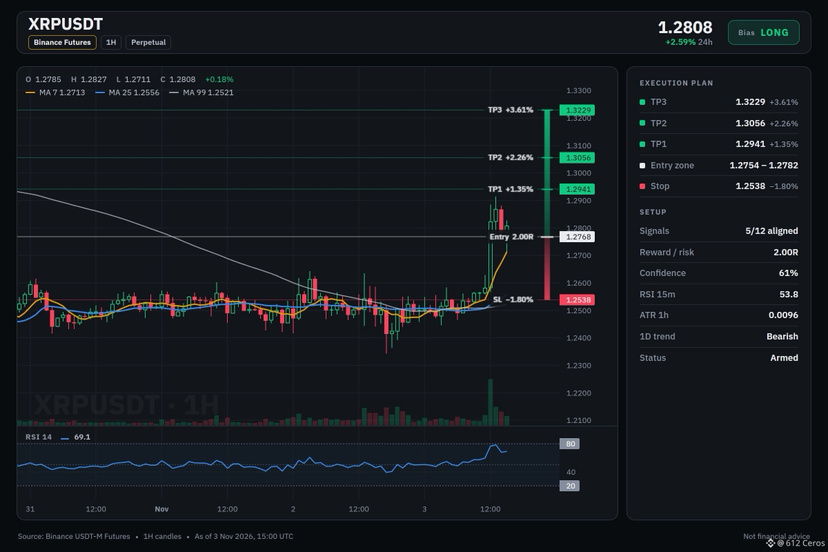
XRP is not a sell-off; it is a counter-trend pullback.
🟢 LONG $XRP /USDT: expecting price to go UP
Bias: LONG · Leaning
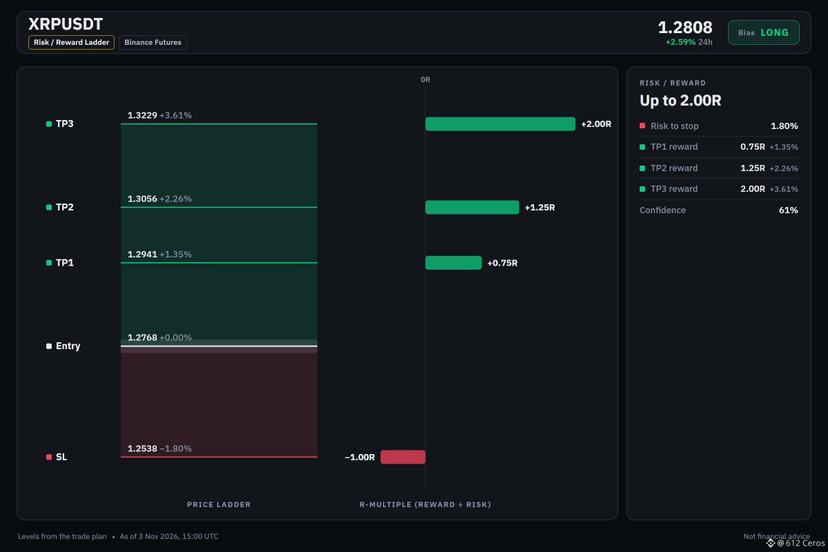
Entry: 1.2754 – 1.2782
TP1: 1.2941 (+1.4%)
TP2: 1.3056 (+2.3%)
TP3: 1.3229 (+3.6%)
SL: 1.2538 (-1.8%)
Plan: enter only inside the zone, close 50% at TP1, 25% at TP2, 25% at TP3, and move the stop to entry after TP1.
Caution: counter-trend setup against the bigger trend, only 5 signals confirm it. Size down, respect the stop.
Why LONG? 5/12 signals agree, 1 against.
• Buyers are driving the move (15m ADX 33.1)
• BTC is rising, this coin follows (corr 0.62)
• Buyers have the momentum (4h RSI 62.7)
Risk: Daily trend down (below EMA50 & EMA200)
Why I like it:
The daily trend is bearish, so this is a counter-trend long. The 1h price is at 1.2768 and the 15m RSI sits at 53.75, meaning buyers have slight momentum without being overextended. The setup leans long, but conviction is moderate and some factors disagree.
Where would you place your invalidation?
{spot}(XRPUSDT)
XRP is not a sell-off; it is a counter-trend pullback.
🟢 LONG $XRP /USDT: expecting price to go UP
Bias: LONG · Leaning
Entry: 1.2754 – 1.2782
TP1: 1.2941 (+1.4%)
TP2: 1.3056 (+2.3%)
TP3: 1.3229 (+3.6%)
SL: 1.2538 (-1.8%)
Plan: enter only inside the zone, close 50% at TP1, 25% at TP2, 25% at TP3, and move the stop to entry after TP1.
Caution: counter-trend setup against the bigger trend, only 5 signals confirm it. Size down, respect the stop.
Why LONG? 5/12 signals agree, 1 against.
• Buyers are driving the move (15m ADX 33.1)
• BTC is rising, this coin follows (corr 0.62)
• Buyers have the momentum (4h RSI 62.7)
Risk: Daily trend down (below EMA50 & EMA200)
Why I like it:
The daily trend is bearish, so this is a counter-trend long. The 1h price is at 1.2768 and the 15m RSI sits at 53.75, meaning buyers have slight momentum without being overextended. The setup leans long, but conviction is moderate and some factors disagree.
Where would you place your invalidation?
🟢 LONG $XRP /USDT: expecting price to go UP
Bias: LONG · Leaning
Entry: 1.2754 – 1.2782
TP1: 1.2941 (+1.4%)
TP2: 1.3056 (+2.3%)
TP3: 1.3229 (+3.6%)
SL: 1.2538 (-1.8%)
Plan: enter only inside the zone, close 50% at TP1, 25% at TP2, 25% at TP3, and move the stop to entry after TP1.
Caution: counter-trend setup against the bigger trend, only 5 signals confirm it. Size down, respect the stop.
Why LONG? 5/12 signals agree, 1 against.
• Buyers are driving the move (15m ADX 33.1)
• BTC is rising, this coin follows (corr 0.62)
• Buyers have the momentum (4h RSI 62.7)
Risk: Daily trend down (below EMA50 & EMA200)
Why I like it:
The daily trend is bearish, so this is a counter-trend long. The 1h price is at 1.2768 and the 15m RSI sits at 53.75, meaning buyers have slight momentum without being overextended. The setup leans long, but conviction is moderate and some factors disagree.
Where would you place your invalidation?
18
·
--
Haussier
Voir la traduction
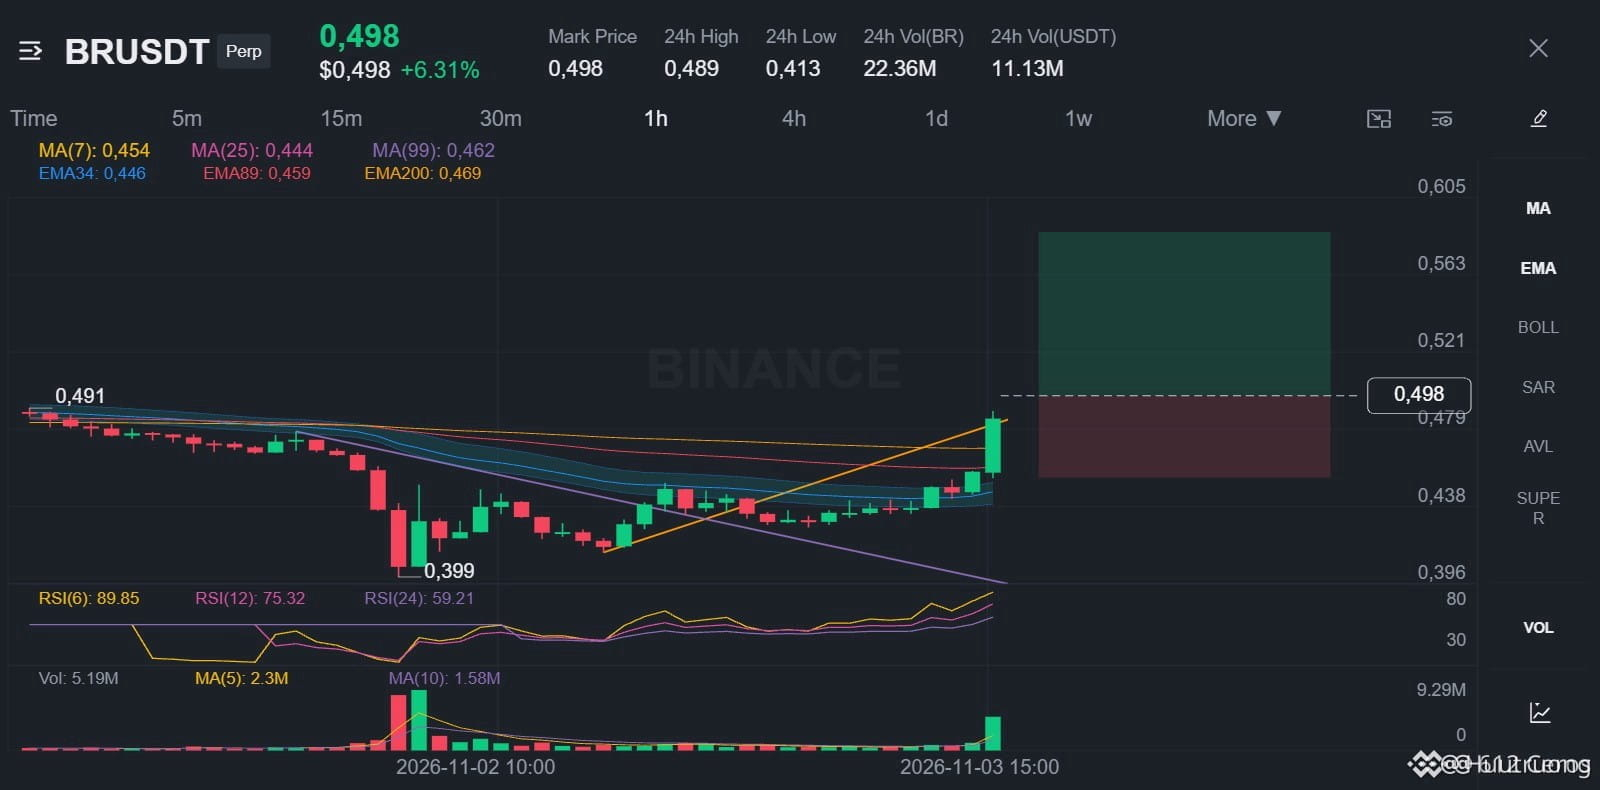
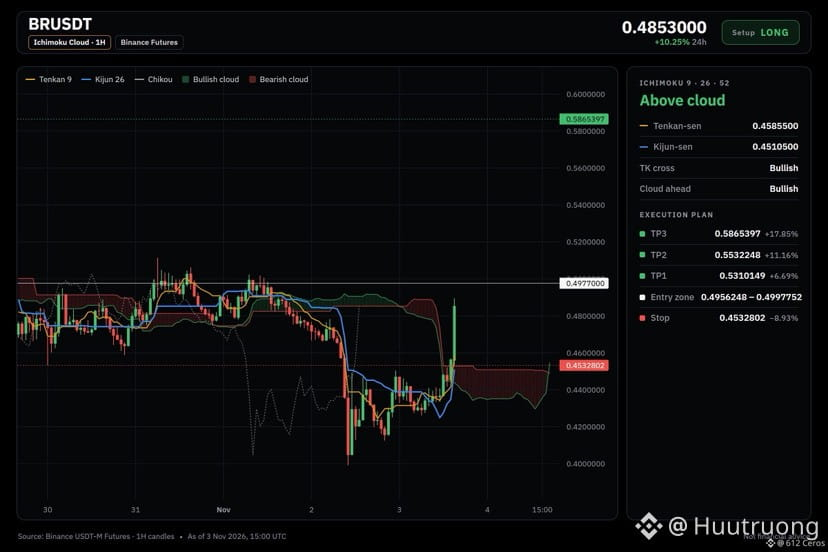
Is BR ready for a trend push from here?
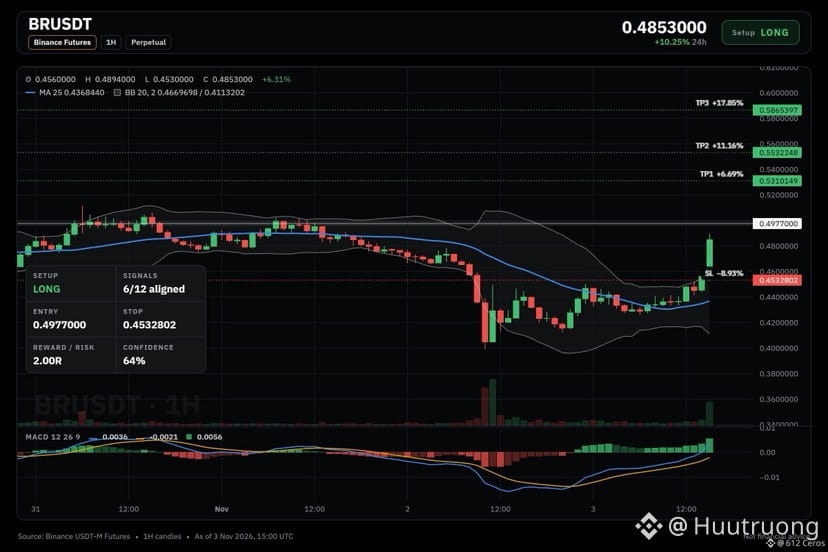
🟢 LONG $BR /USDT: expecting price to go UP
Bias: LONG · Leaning
Entry: 0.4956248 – 0.4997752
TP1: 0.5310149 (+6.7%)
TP2: 0.5532248 (+11.2%)
TP3: 0.5865397 (+17.9%)
SL: 0.4532802 (-8.9%)
Plan: enter only inside the zone, close 50% at TP1, 25% at TP2, 25% at TP3, and move the stop to entry after TP1.
Note: moderate conviction only, keep size light.
Why LONG? BR checklist: 6/12 agree, 1 against.
• Buyers are driving the move (15m ADX 53.2)
• Buyers have the momentum (4h RSI 55.6)
• Buyers have the momentum (1h RSI 72.0)
Watch: Far above its average, pullback likely (+3.9 ATR from 1h EMA50)
Watch: The idea is wrong if price reaches the stop at 0.4532802
Bottom line: ADX 53.2 shows buyers are driving the move on the 15m, but the 1h price sits 3.9 ATR above its EMA50, meaning a pullback is likely.
Where do you take profits on a lean long like this?
{future}(BRUSDT)
Is BR ready for a trend push from here?
🟢 LONG $BR /USDT: expecting price to go UP
Bias: LONG · Leaning
Entry: 0.4956248 – 0.4997752
TP1: 0.5310149 (+6.7%)
TP2: 0.5532248 (+11.2%)
TP3: 0.5865397 (+17.9%)
SL: 0.4532802 (-8.9%)
Plan: enter only inside the zone, close 50% at TP1, 25% at TP2, 25% at TP3, and move the stop to entry after TP1.
Note: moderate conviction only, keep size light.
Why LONG? BR checklist: 6/12 agree, 1 against.
• Buyers are driving the move (15m ADX 53.2)
• Buyers have the momentum (4h RSI 55.6)
• Buyers have the momentum (1h RSI 72.0)
Watch: Far above its average, pullback likely (+3.9 ATR from 1h EMA50)
Watch: The idea is wrong if price reaches the stop at 0.4532802
Bottom line: ADX 53.2 shows buyers are driving the move on the 15m, but the 1h price sits 3.9 ATR above its EMA50, meaning a pullback is likely.
Where do you take profits on a lean long like this?
🟢 LONG $BR /USDT: expecting price to go UP
Bias: LONG · Leaning
Entry: 0.4956248 – 0.4997752
TP1: 0.5310149 (+6.7%)
TP2: 0.5532248 (+11.2%)
TP3: 0.5865397 (+17.9%)
SL: 0.4532802 (-8.9%)
Plan: enter only inside the zone, close 50% at TP1, 25% at TP2, 25% at TP3, and move the stop to entry after TP1.
Note: moderate conviction only, keep size light.
Why LONG? BR checklist: 6/12 agree, 1 against.
• Buyers are driving the move (15m ADX 53.2)
• Buyers have the momentum (4h RSI 55.6)
• Buyers have the momentum (1h RSI 72.0)
Watch: Far above its average, pullback likely (+3.9 ATR from 1h EMA50)
Watch: The idea is wrong if price reaches the stop at 0.4532802
Bottom line: ADX 53.2 shows buyers are driving the move on the 15m, but the 1h price sits 3.9 ATR above its EMA50, meaning a pullback is likely.
Where do you take profits on a lean long like this?
10
·
--
Baissier
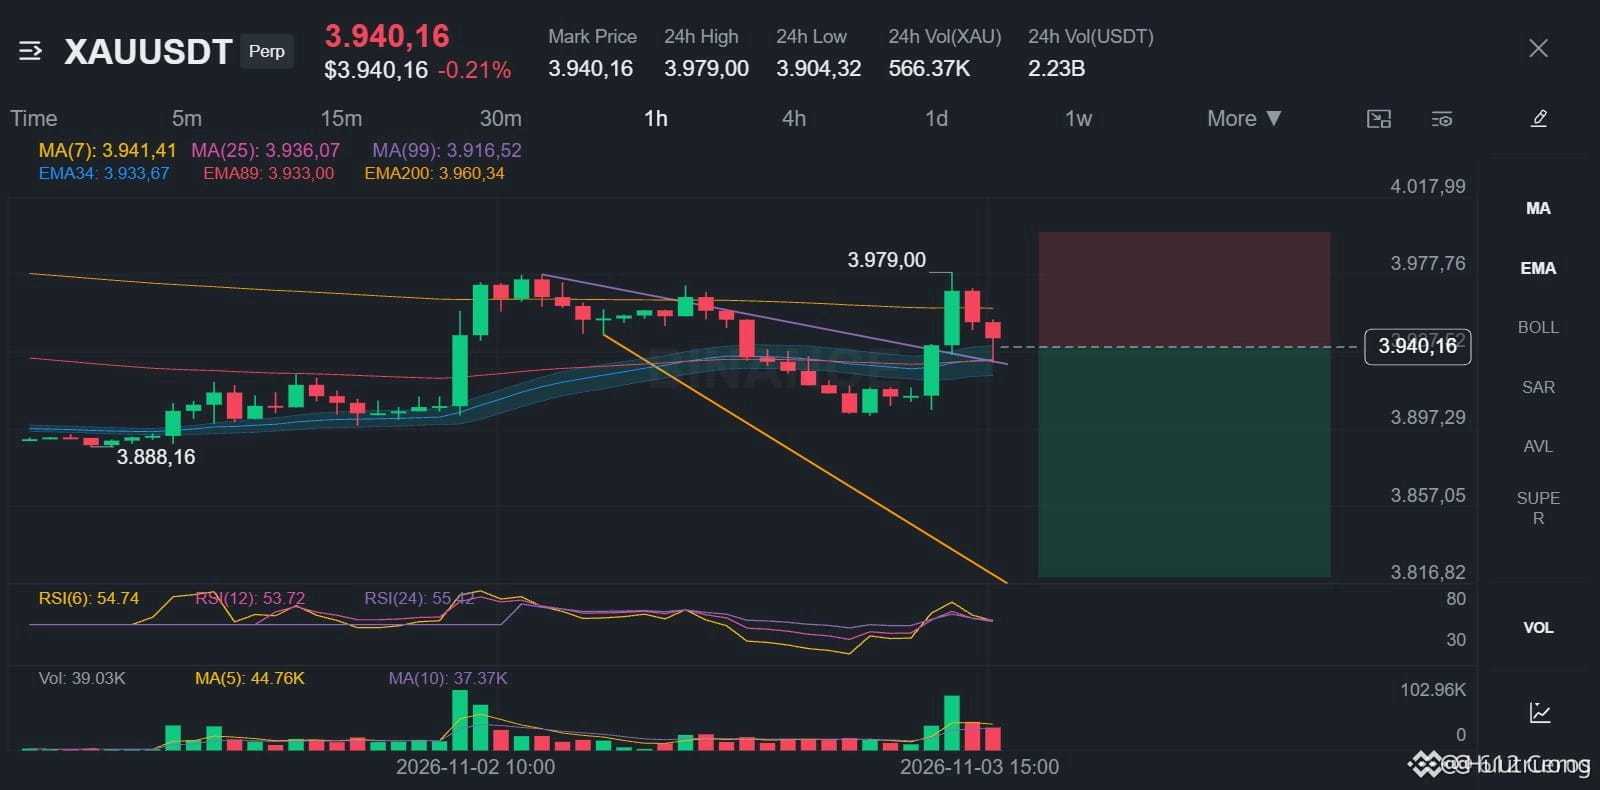
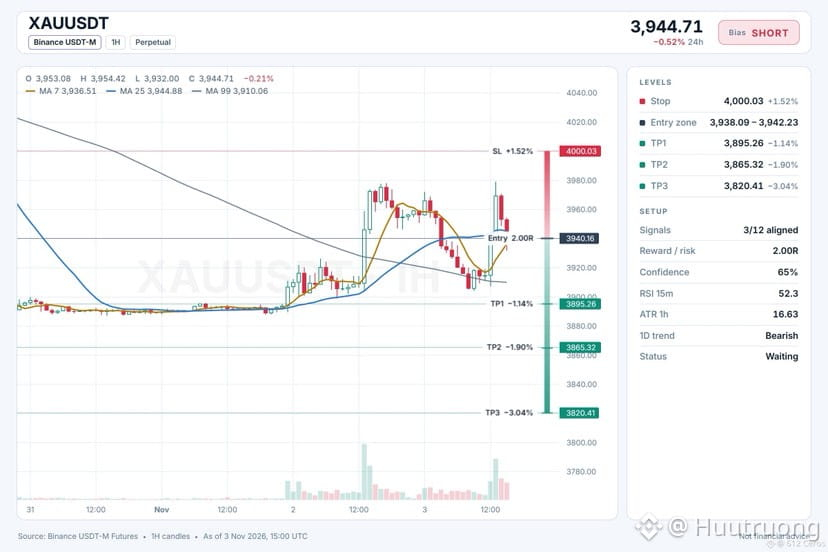
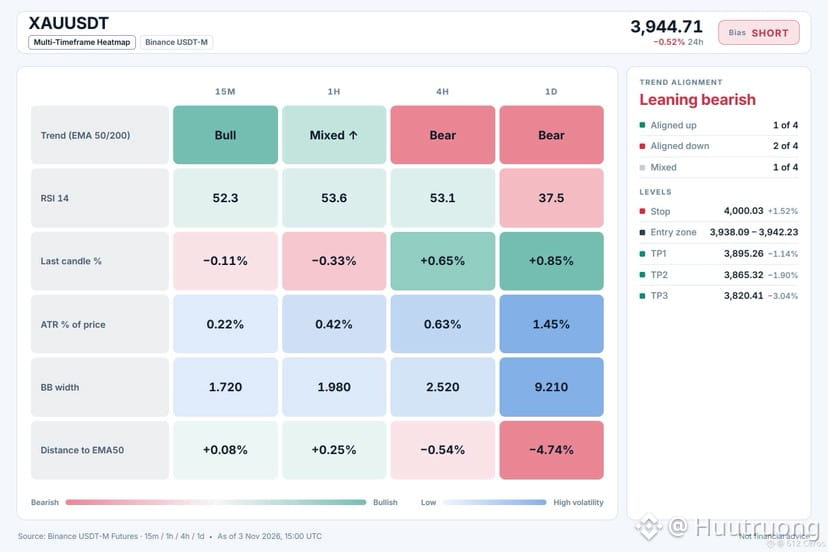
XAU semble prêt à poursuivre sa baisse à partir d’ici.
🔴 SHORT $XAU /USDT : le prix devrait BAISSER
Biais : SHORT · légère préférence
Entrée : 3938.09 – 3942.23
TP1 : 3895.26 (-1.1%)
TP2 : 3865.32 (-1.9%)
TP3 : 3820.41 (-3.0%)
SL : 4000.03 (+1.5%)
Plan : entrez uniquement dans la zone, clôturez 50 % à TP1, 25 % à TP2, 25 % à TP3 et déplacez le stop au prix d’entrée après TP1.
Remarque : conviction modérée seulement, gardez une position de petite taille.
Pourquoi SHORT ? 3/12 signaux sont concordants, 0 sont opposés.
• Tendance journalière à la baisse (sous EMA50 et EMA200)
• Tendance sur 4 h à la baisse (sous EMA50 et EMA200)
• Les vendeurs entraînent le mouvement (ADX 15 min : 22.1)
Plan A :
Si le prix baisse depuis le niveau 1 h proche de 3940 et que la tendance sur 4 h reste orientée à la baisse, il pourrait chuter vers 3895. La tendance journalière est baissière, le prix étant sous les EMA50 et EMA200.
Plan B (invalidation) :
Si le prix remonte au-dessus du stop à 4000, la configuration est invalidée et je sortirais de position.
Quel niveau surveillez-vous pour vendre XAU à découvert ?
{future}(XAUUSDT)
XAU semble prêt à poursuivre sa baisse à partir d’ici.
🔴 SHORT $XAU /USDT : le prix devrait BAISSER
Biais : SHORT · légère préférence
Entrée : 3938.09 – 3942.23
TP1 : 3895.26 (-1.1%)
TP2 : 3865.32 (-1.9%)
TP3 : 3820.41 (-3.0%)
SL : 4000.03 (+1.5%)
Plan : entrez uniquement dans la zone, clôturez 50 % à TP1, 25 % à TP2, 25 % à TP3 et déplacez le stop au prix d’entrée après TP1.
Remarque : conviction modérée seulement, gardez une position de petite taille.
Pourquoi SHORT ? 3/12 signaux sont concordants, 0 sont opposés.
• Tendance journalière à la baisse (sous EMA50 et EMA200)
• Tendance sur 4 h à la baisse (sous EMA50 et EMA200)
• Les vendeurs entraînent le mouvement (ADX 15 min : 22.1)
Plan A :
Si le prix baisse depuis le niveau 1 h proche de 3940 et que la tendance sur 4 h reste orientée à la baisse, il pourrait chuter vers 3895. La tendance journalière est baissière, le prix étant sous les EMA50 et EMA200.
Plan B (invalidation) :
Si le prix remonte au-dessus du stop à 4000, la configuration est invalidée et je sortirais de position.
Quel niveau surveillez-vous pour vendre XAU à découvert ?
🔴 SHORT $XAU /USDT : le prix devrait BAISSER
Biais : SHORT · légère préférence
Entrée : 3938.09 – 3942.23
TP1 : 3895.26 (-1.1%)
TP2 : 3865.32 (-1.9%)
TP3 : 3820.41 (-3.0%)
SL : 4000.03 (+1.5%)
Plan : entrez uniquement dans la zone, clôturez 50 % à TP1, 25 % à TP2, 25 % à TP3 et déplacez le stop au prix d’entrée après TP1.
Remarque : conviction modérée seulement, gardez une position de petite taille.
Pourquoi SHORT ? 3/12 signaux sont concordants, 0 sont opposés.
• Tendance journalière à la baisse (sous EMA50 et EMA200)
• Tendance sur 4 h à la baisse (sous EMA50 et EMA200)
• Les vendeurs entraînent le mouvement (ADX 15 min : 22.1)
Plan A :
Si le prix baisse depuis le niveau 1 h proche de 3940 et que la tendance sur 4 h reste orientée à la baisse, il pourrait chuter vers 3895. La tendance journalière est baissière, le prix étant sous les EMA50 et EMA200.
Plan B (invalidation) :
Si le prix remonte au-dessus du stop à 4000, la configuration est invalidée et je sortirais de position.
Quel niveau surveillez-vous pour vendre XAU à découvert ?
28
·
--
Haussier
Voir la traduction
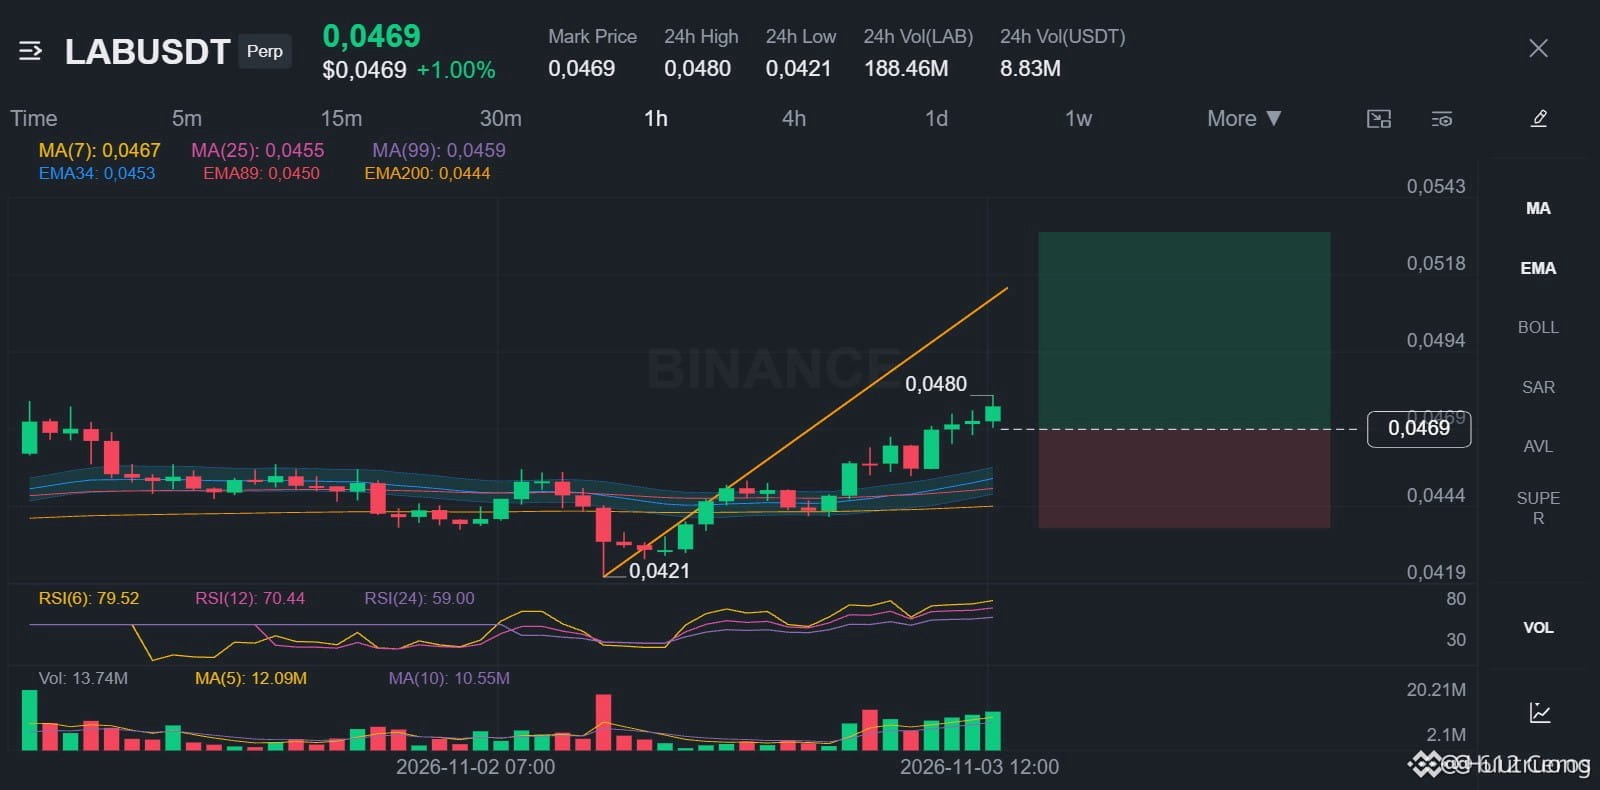
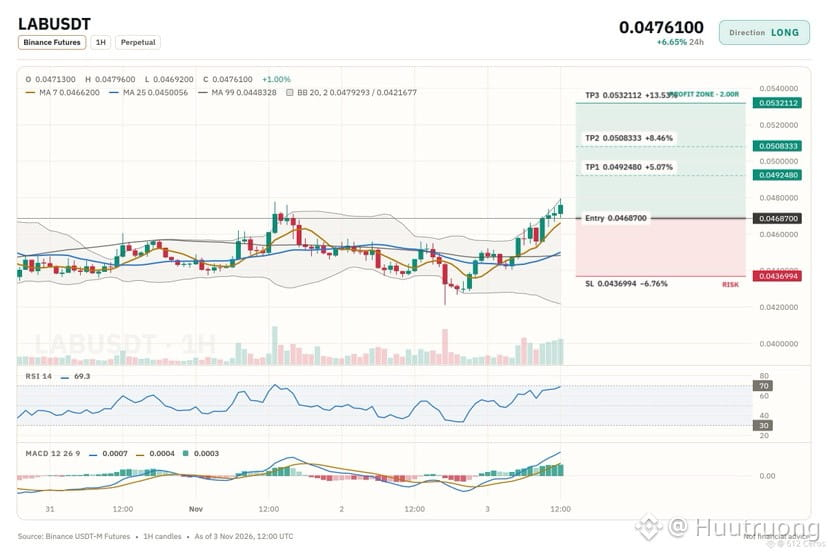
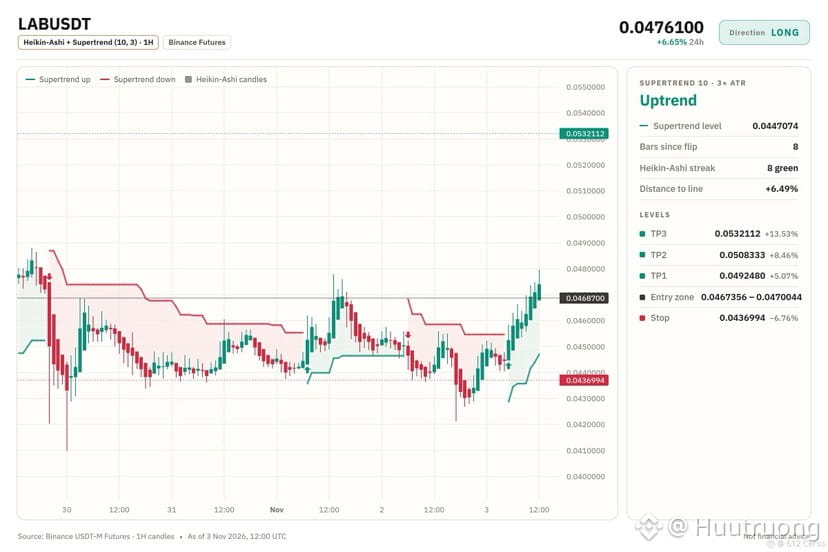
LAB counter-trend long: small edge, risk is real
🟢 LONG $LAB /USDT: expecting price to go UP
Bias: LONG · Leaning
Entry: 0.0467356 – 0.0470044
TP1: 0.0492480 (+5.1%)
TP2: 0.0508333 (+8.5%)
TP3: 0.0532112 (+13.5%)
SL: 0.0436994 (-6.8%)
Plan: enter only inside the zone, close 50% at TP1, 25% at TP2, 25% at TP3, and move the stop to entry after TP1.
Caution: counter-trend idea backed by 5 signals only. Smaller size, hard stop.
Why LONG? 5/12 signals agree, 1 against.
• 1h trend up (above EMA50 & EMA200)
• Buyers are driving the move (15m ADX 45.8)
• Buyers have the momentum (4h RSI 58.7)
Risk: Daily trend down (below EMA50 & EMA200)
Trade note: LAB
I'm watching LAB for a counter-trend long. The daily trend is bearish, so this is a reversal bet against the higher timeframe, which makes it riskier than a trend trade. I want to see the 1h price hold above the EMA50 and EMA200 stack, and I will respect the stop at 0.0468700 if it breaks. The setup leans long with moderate conviction because only 5 of 12 signals agree, so I am sizing down.
Where is your invalidation level on this long?
{future}(LABUSDT)
LAB counter-trend long: small edge, risk is real
🟢 LONG $LAB /USDT: expecting price to go UP
Bias: LONG · Leaning
Entry: 0.0467356 – 0.0470044
TP1: 0.0492480 (+5.1%)
TP2: 0.0508333 (+8.5%)
TP3: 0.0532112 (+13.5%)
SL: 0.0436994 (-6.8%)
Plan: enter only inside the zone, close 50% at TP1, 25% at TP2, 25% at TP3, and move the stop to entry after TP1.
Caution: counter-trend idea backed by 5 signals only. Smaller size, hard stop.
Why LONG? 5/12 signals agree, 1 against.
• 1h trend up (above EMA50 & EMA200)
• Buyers are driving the move (15m ADX 45.8)
• Buyers have the momentum (4h RSI 58.7)
Risk: Daily trend down (below EMA50 & EMA200)
Trade note: LAB
I'm watching LAB for a counter-trend long. The daily trend is bearish, so this is a reversal bet against the higher timeframe, which makes it riskier than a trend trade. I want to see the 1h price hold above the EMA50 and EMA200 stack, and I will respect the stop at 0.0468700 if it breaks. The setup leans long with moderate conviction because only 5 of 12 signals agree, so I am sizing down.
Where is your invalidation level on this long?
🟢 LONG $LAB /USDT: expecting price to go UP
Bias: LONG · Leaning
Entry: 0.0467356 – 0.0470044
TP1: 0.0492480 (+5.1%)
TP2: 0.0508333 (+8.5%)
TP3: 0.0532112 (+13.5%)
SL: 0.0436994 (-6.8%)
Plan: enter only inside the zone, close 50% at TP1, 25% at TP2, 25% at TP3, and move the stop to entry after TP1.
Caution: counter-trend idea backed by 5 signals only. Smaller size, hard stop.
Why LONG? 5/12 signals agree, 1 against.
• 1h trend up (above EMA50 & EMA200)
• Buyers are driving the move (15m ADX 45.8)
• Buyers have the momentum (4h RSI 58.7)
Risk: Daily trend down (below EMA50 & EMA200)
Trade note: LAB
I'm watching LAB for a counter-trend long. The daily trend is bearish, so this is a reversal bet against the higher timeframe, which makes it riskier than a trend trade. I want to see the 1h price hold above the EMA50 and EMA200 stack, and I will respect the stop at 0.0468700 if it breaks. The setup leans long with moderate conviction because only 5 of 12 signals agree, so I am sizing down.
Where is your invalidation level on this long?
1
14
·
--
Baissier
Voir la traduction
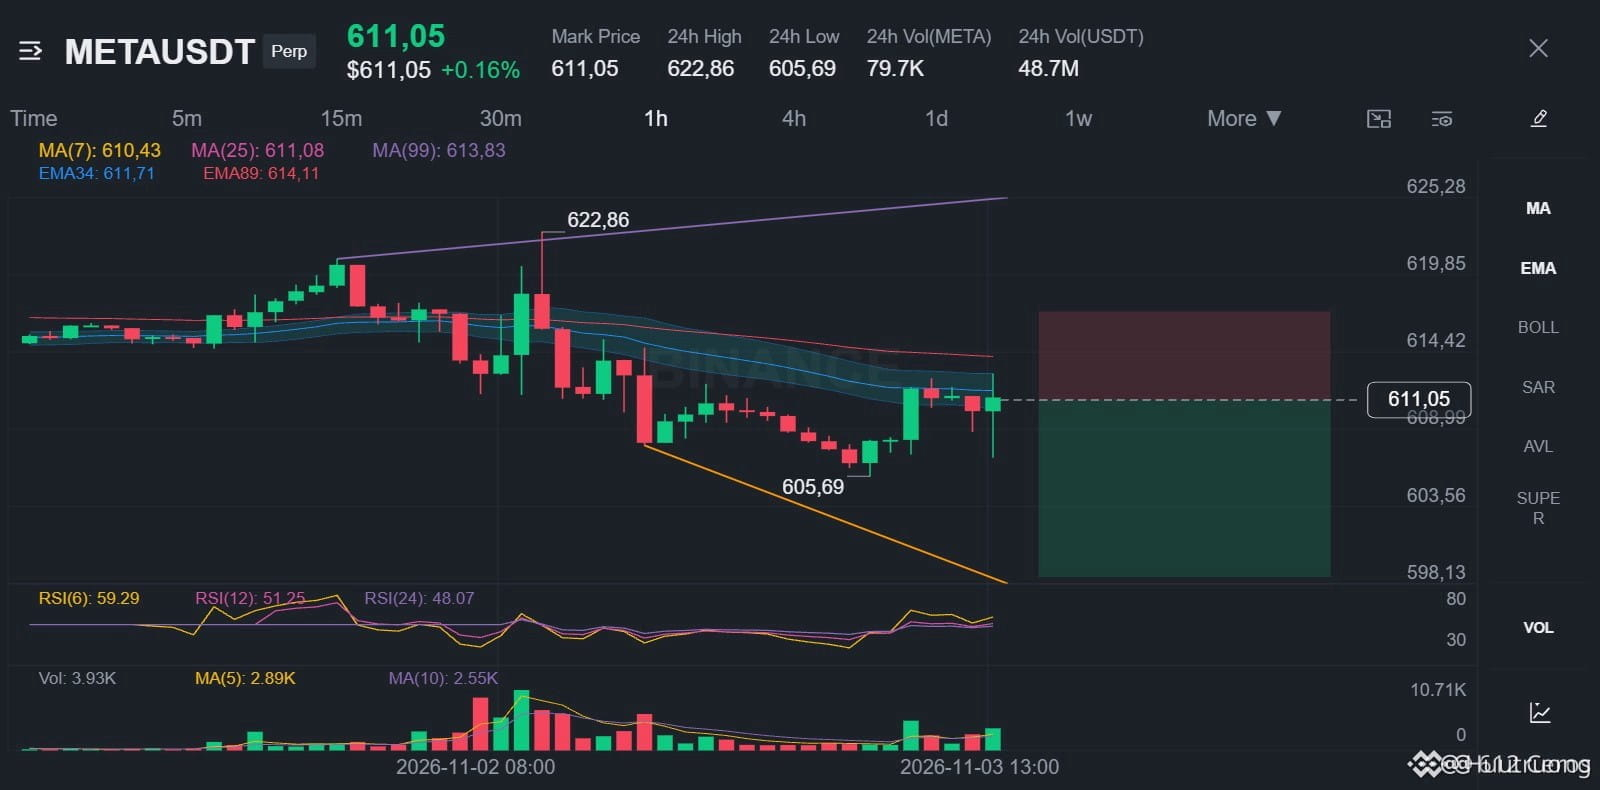
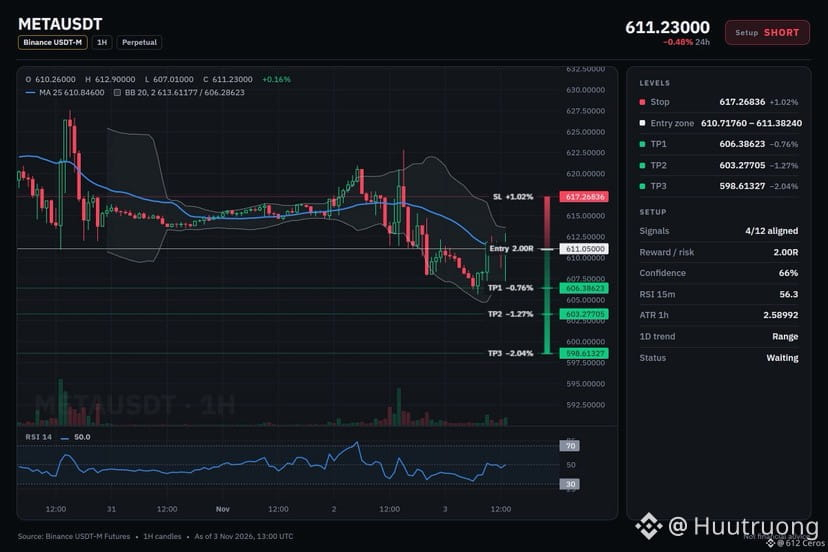
META looks weaker on every timeframe but range.
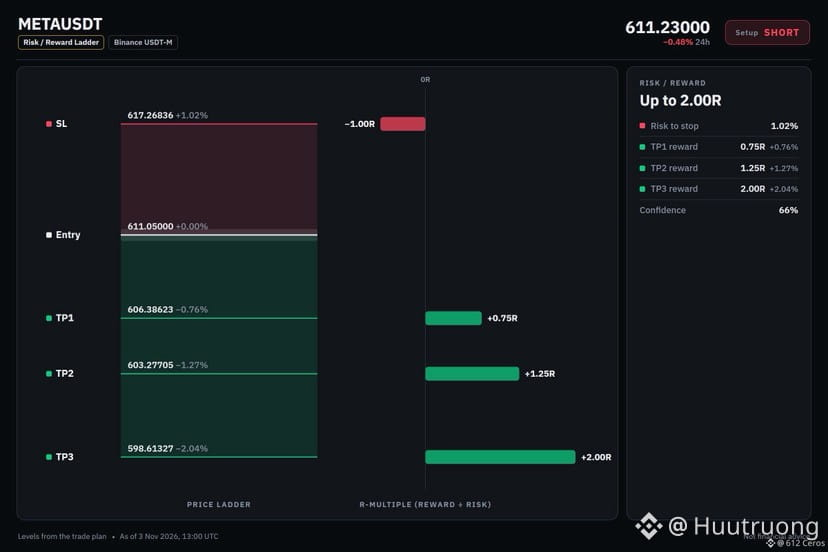
🔴 SHORT $META /USDT: expecting price to go DOWN
Bias: SHORT · Leaning
Entry: 610.71760 – 611.38240
TP1: 606.38623 (-0.8%)
TP2: 603.27705 (-1.3%)
TP3: 598.61327 (-2.0%)
SL: 617.26836 (+1.0%)
Plan: enter only inside the zone, close 50% at TP1, 25% at TP2, 25% at TP3, and move the stop to entry after TP1.
Note: moderate conviction only, keep size light.
Why SHORT? 4/12 signals agree, 0 against.
• 4h trend down (below EMA50 & EMA200)
• 1h trend down (below EMA50 & EMA200)
• Sellers are driving the move (15m ADX 25.2)
Q: Why short when the daily trend is range?
A: The 4h stack is bearish, which overrides the daily range.
Q: When is this trade wrong?
A: A break above 617.26836 invalidates the setup.
What is your META level for shorts?
{future}(METAUSDT)
META looks weaker on every timeframe but range.
🔴 SHORT $META /USDT: expecting price to go DOWN
Bias: SHORT · Leaning
Entry: 610.71760 – 611.38240
TP1: 606.38623 (-0.8%)
TP2: 603.27705 (-1.3%)
TP3: 598.61327 (-2.0%)
SL: 617.26836 (+1.0%)
Plan: enter only inside the zone, close 50% at TP1, 25% at TP2, 25% at TP3, and move the stop to entry after TP1.
Note: moderate conviction only, keep size light.
Why SHORT? 4/12 signals agree, 0 against.
• 4h trend down (below EMA50 & EMA200)
• 1h trend down (below EMA50 & EMA200)
• Sellers are driving the move (15m ADX 25.2)
Q: Why short when the daily trend is range?
A: The 4h stack is bearish, which overrides the daily range.
Q: When is this trade wrong?
A: A break above 617.26836 invalidates the setup.
What is your META level for shorts?
🔴 SHORT $META /USDT: expecting price to go DOWN
Bias: SHORT · Leaning
Entry: 610.71760 – 611.38240
TP1: 606.38623 (-0.8%)
TP2: 603.27705 (-1.3%)
TP3: 598.61327 (-2.0%)
SL: 617.26836 (+1.0%)
Plan: enter only inside the zone, close 50% at TP1, 25% at TP2, 25% at TP3, and move the stop to entry after TP1.
Note: moderate conviction only, keep size light.
Why SHORT? 4/12 signals agree, 0 against.
• 4h trend down (below EMA50 & EMA200)
• 1h trend down (below EMA50 & EMA200)
• Sellers are driving the move (15m ADX 25.2)
Q: Why short when the daily trend is range?
A: The 4h stack is bearish, which overrides the daily range.
Q: When is this trade wrong?
A: A break above 617.26836 invalidates the setup.
What is your META level for shorts?
12
·
--
Haussier
Voir la traduction
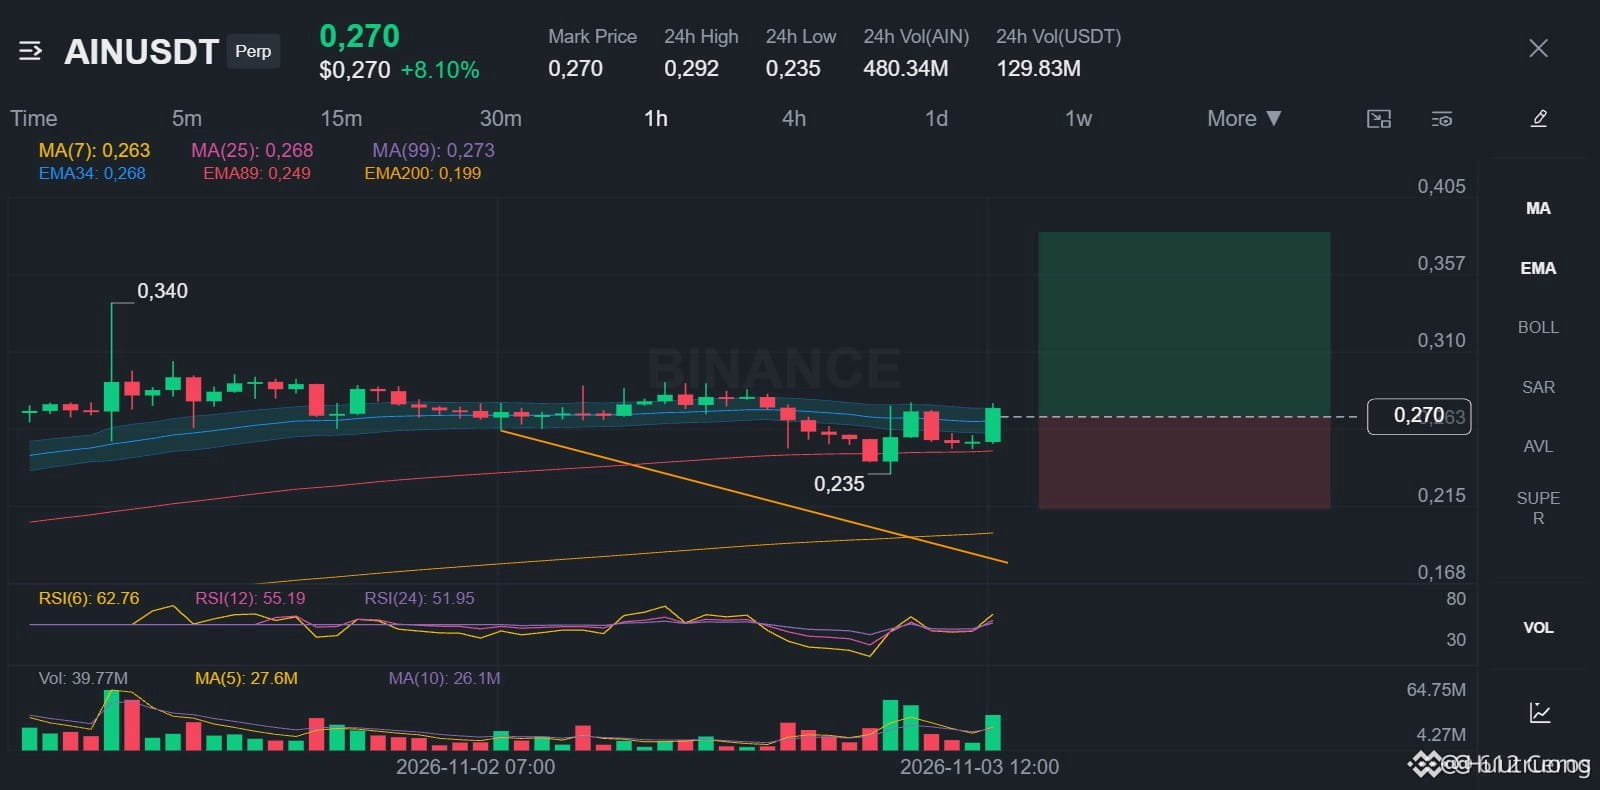
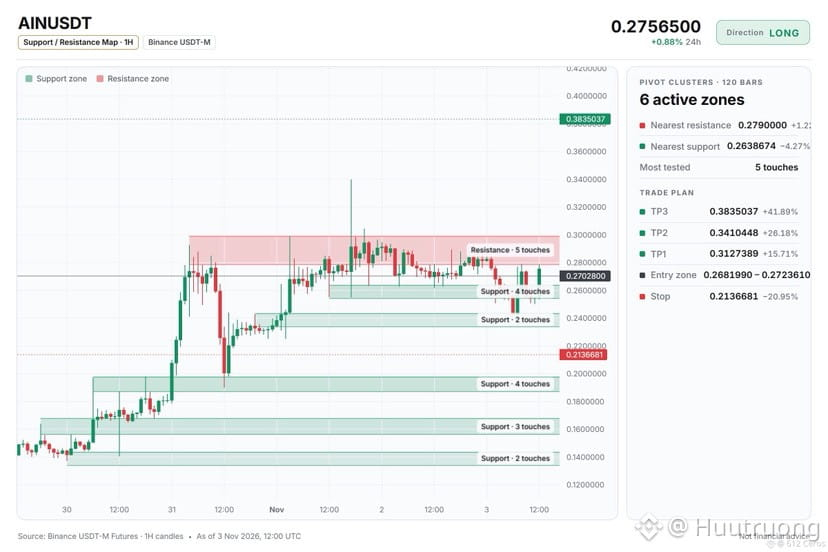
Ain is stacked up on every timeframe right now.
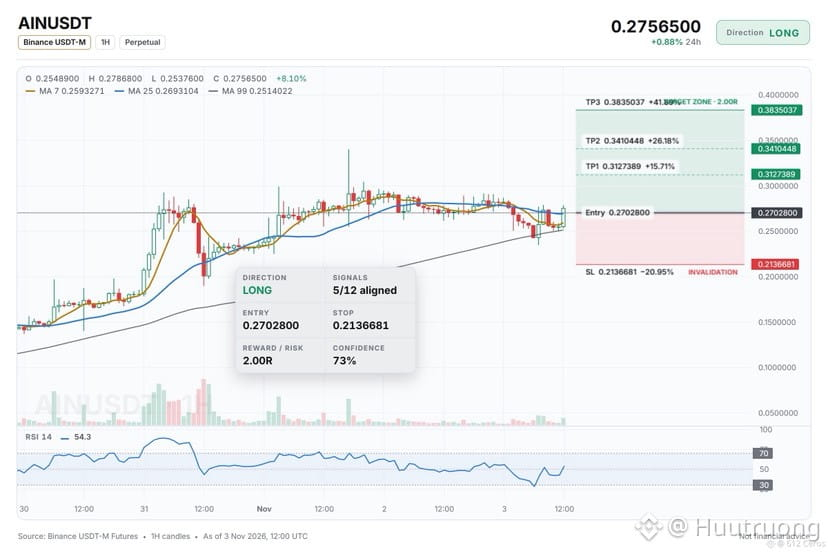
🟢 LONG $AIN /USDT: expecting price to go UP
Bias: LONG · Leaning
Entry: 0.2681990 – 0.2723610
TP1: 0.3127389 (+15.7%)
TP2: 0.3410448 (+26.2%)
TP3: 0.3835037 (+41.9%)
SL: 0.2136681 (-20.9%)
Plan: enter only inside the zone, close 50% at TP1, 25% at TP2, 25% at TP3, and move the stop to entry after TP1.
Note: moderate conviction only, keep size light.
Why LONG? What I checked: 5/12 agree, 0 against.
• Daily trend up (above EMA50 & EMA200)
• 4h trend up (above EMA50 & EMA200)
• 1h trend up (above EMA50 & EMA200)
Watch: The idea is wrong if price reaches the stop at 0.2136681
Bottom line: The daily and 4h bullish stacks support a long, but the 1h RSI is neutral and conviction is only moderate.
Where would you place your stop on this setup?
{future}(AINUSDT)
Ain is stacked up on every timeframe right now.
🟢 LONG $AIN /USDT: expecting price to go UP
Bias: LONG · Leaning
Entry: 0.2681990 – 0.2723610
TP1: 0.3127389 (+15.7%)
TP2: 0.3410448 (+26.2%)
TP3: 0.3835037 (+41.9%)
SL: 0.2136681 (-20.9%)
Plan: enter only inside the zone, close 50% at TP1, 25% at TP2, 25% at TP3, and move the stop to entry after TP1.
Note: moderate conviction only, keep size light.
Why LONG? What I checked: 5/12 agree, 0 against.
• Daily trend up (above EMA50 & EMA200)
• 4h trend up (above EMA50 & EMA200)
• 1h trend up (above EMA50 & EMA200)
Watch: The idea is wrong if price reaches the stop at 0.2136681
Bottom line: The daily and 4h bullish stacks support a long, but the 1h RSI is neutral and conviction is only moderate.
Where would you place your stop on this setup?
🟢 LONG $AIN /USDT: expecting price to go UP
Bias: LONG · Leaning
Entry: 0.2681990 – 0.2723610
TP1: 0.3127389 (+15.7%)
TP2: 0.3410448 (+26.2%)
TP3: 0.3835037 (+41.9%)
SL: 0.2136681 (-20.9%)
Plan: enter only inside the zone, close 50% at TP1, 25% at TP2, 25% at TP3, and move the stop to entry after TP1.
Note: moderate conviction only, keep size light.
Why LONG? What I checked: 5/12 agree, 0 against.
• Daily trend up (above EMA50 & EMA200)
• 4h trend up (above EMA50 & EMA200)
• 1h trend up (above EMA50 & EMA200)
Watch: The idea is wrong if price reaches the stop at 0.2136681
Bottom line: The daily and 4h bullish stacks support a long, but the 1h RSI is neutral and conviction is only moderate.
Where would you place your stop on this setup?
18
·
--
Baissier
Voir la traduction
SOL short setup: the levels I'm watching
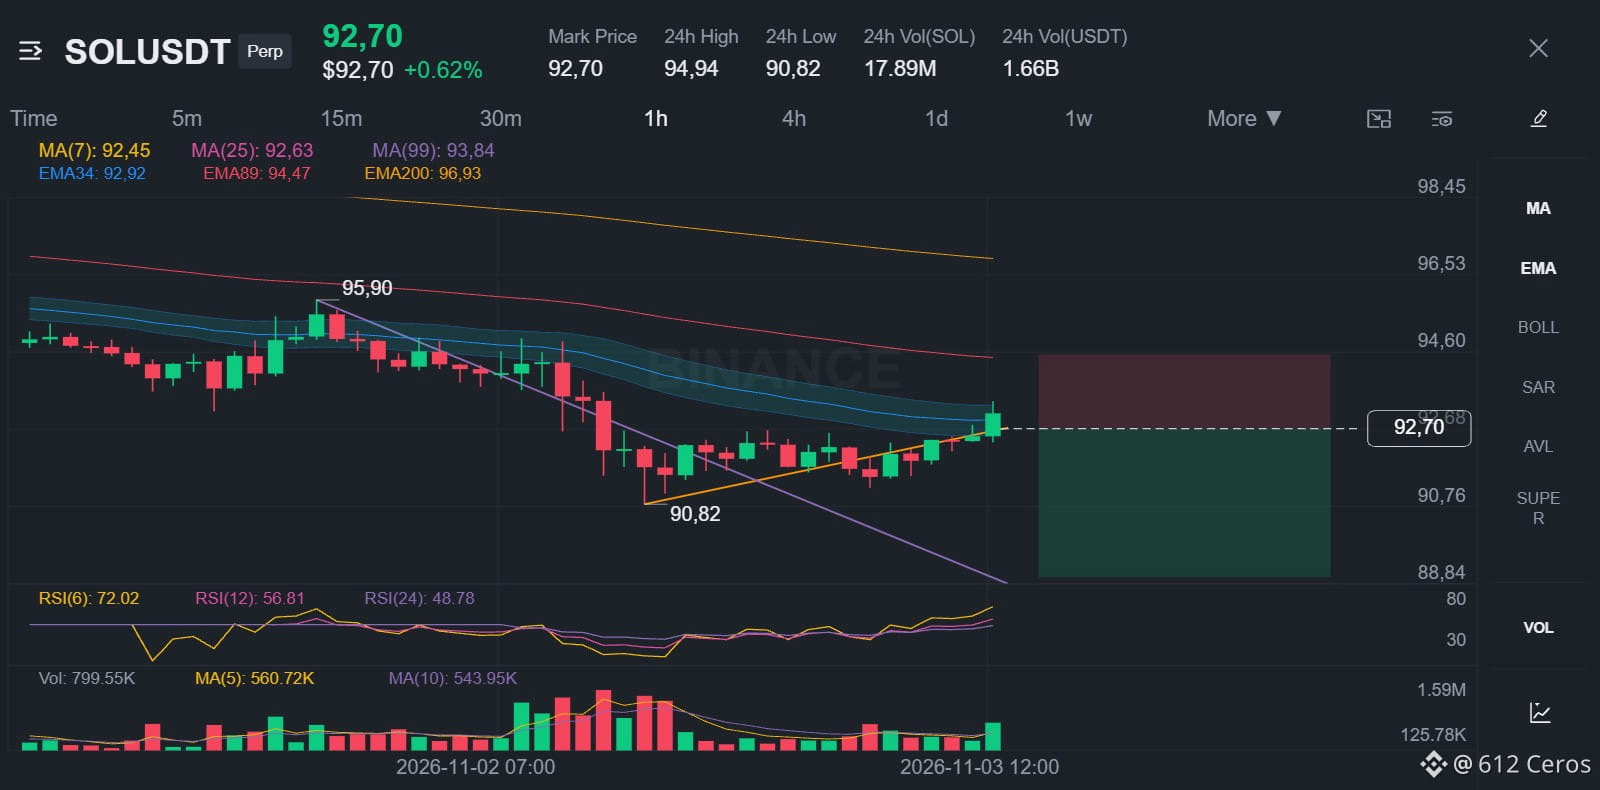
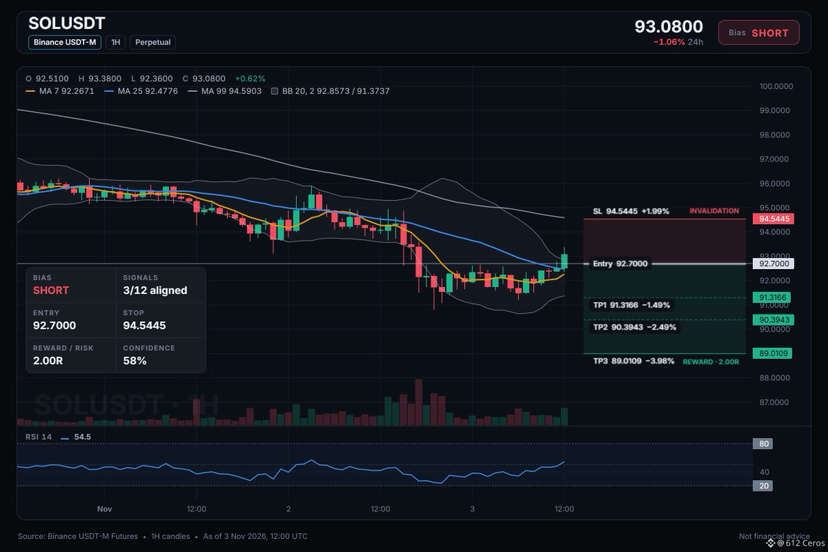
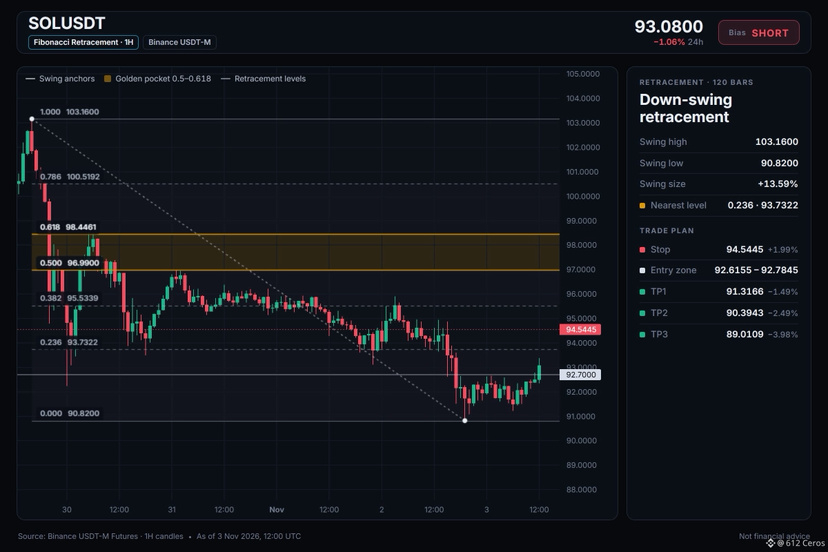
🔴 SHORT $SOL /USDT: expecting price to go DOWN
Bias: SHORT · Leaning
Entry: 92.6155 – 92.7845
TP1: 91.3166 (-1.5%)
TP2: 90.3943 (-2.5%)
TP3: 89.0109 (-4.0%)
SL: 94.5445 (+2.0%)
Plan: enter only inside the zone, close 50% at TP1, 25% at TP2, 25% at TP3, and move the stop to entry after TP1.
Note: moderate conviction only, keep size light.
Why SHORT? 3/12 signals agree, 1 against.
• 4h trend down (below EMA50 & EMA200)
• 1h trend down (below EMA50 & EMA200)
• Sellers have the momentum (4h RSI 35.3)
Risk: BTC is rising, this coin follows (corr 0.89)
Why now?
The daily trend reads range, and 3/12 signals aligned favour the short side. The plan is to work the 92.6155 – 92.7845 zone, scale out at 91.3166 and 90.3943, and stay patient for 89.0109. A move through 94.5445 means the idea is wrong and the stop does its job.
Does SOL tag 91.3166 first, or the stop?
{spot}(SOLUSDT)
SOL short setup: the levels I'm watching
🔴 SHORT $SOL /USDT: expecting price to go DOWN
Bias: SHORT · Leaning
Entry: 92.6155 – 92.7845
TP1: 91.3166 (-1.5%)
TP2: 90.3943 (-2.5%)
TP3: 89.0109 (-4.0%)
SL: 94.5445 (+2.0%)
Plan: enter only inside the zone, close 50% at TP1, 25% at TP2, 25% at TP3, and move the stop to entry after TP1.
Note: moderate conviction only, keep size light.
Why SHORT? 3/12 signals agree, 1 against.
• 4h trend down (below EMA50 & EMA200)
• 1h trend down (below EMA50 & EMA200)
• Sellers have the momentum (4h RSI 35.3)
Risk: BTC is rising, this coin follows (corr 0.89)
Why now?
The daily trend reads range, and 3/12 signals aligned favour the short side. The plan is to work the 92.6155 – 92.7845 zone, scale out at 91.3166 and 90.3943, and stay patient for 89.0109. A move through 94.5445 means the idea is wrong and the stop does its job.
Does SOL tag 91.3166 first, or the stop?
🔴 SHORT $SOL /USDT: expecting price to go DOWN
Bias: SHORT · Leaning
Entry: 92.6155 – 92.7845
TP1: 91.3166 (-1.5%)
TP2: 90.3943 (-2.5%)
TP3: 89.0109 (-4.0%)
SL: 94.5445 (+2.0%)
Plan: enter only inside the zone, close 50% at TP1, 25% at TP2, 25% at TP3, and move the stop to entry after TP1.
Note: moderate conviction only, keep size light.
Why SHORT? 3/12 signals agree, 1 against.
• 4h trend down (below EMA50 & EMA200)
• 1h trend down (below EMA50 & EMA200)
• Sellers have the momentum (4h RSI 35.3)
Risk: BTC is rising, this coin follows (corr 0.89)
Why now?
The daily trend reads range, and 3/12 signals aligned favour the short side. The plan is to work the 92.6155 – 92.7845 zone, scale out at 91.3166 and 90.3943, and stay patient for 89.0109. A move through 94.5445 means the idea is wrong and the stop does its job.
Does SOL tag 91.3166 first, or the stop?
15
·
--
Baissier
Voir la traduction
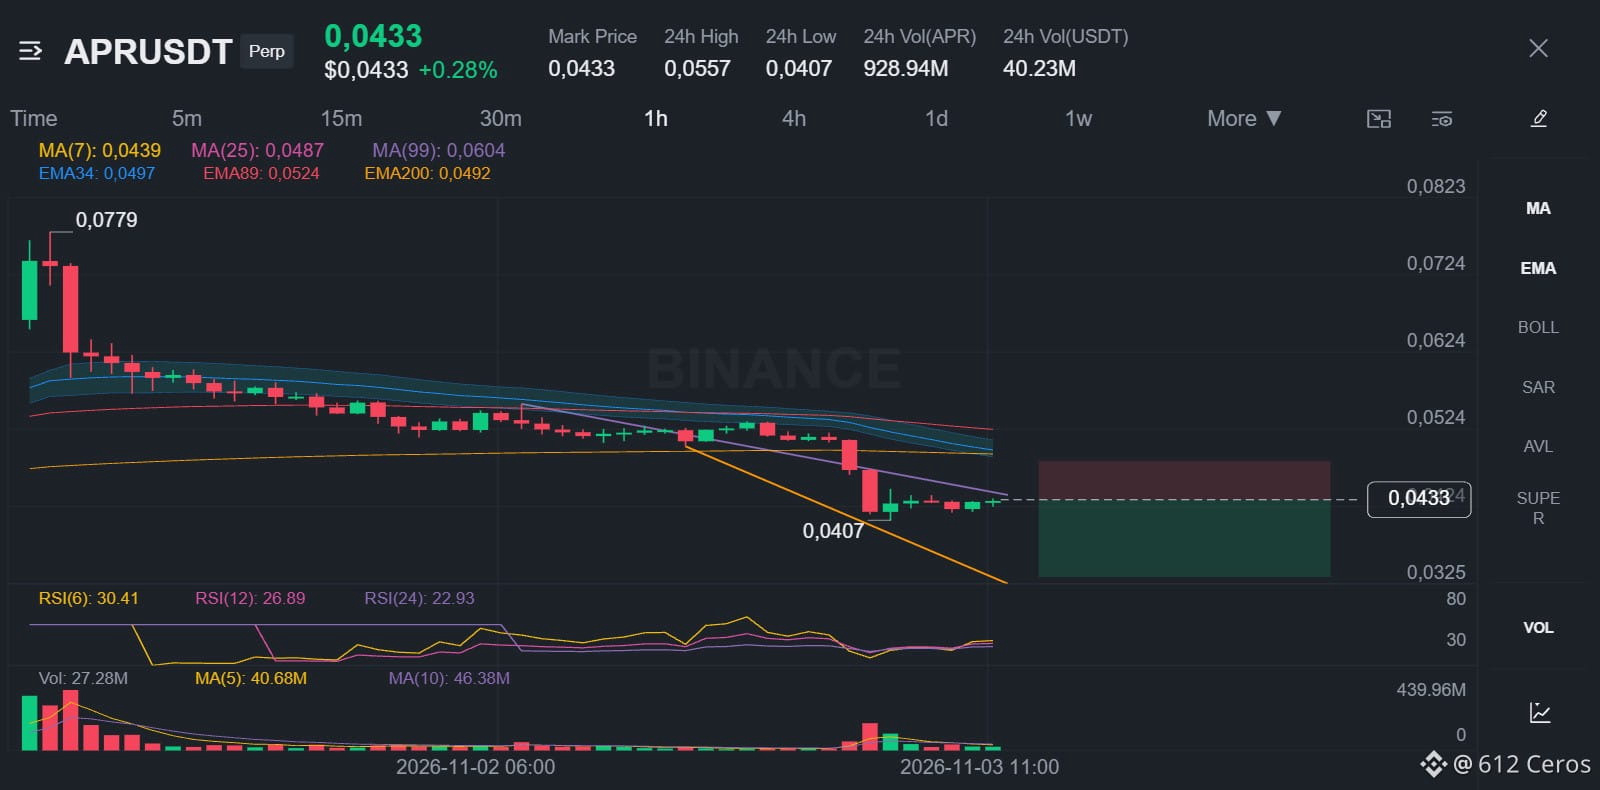
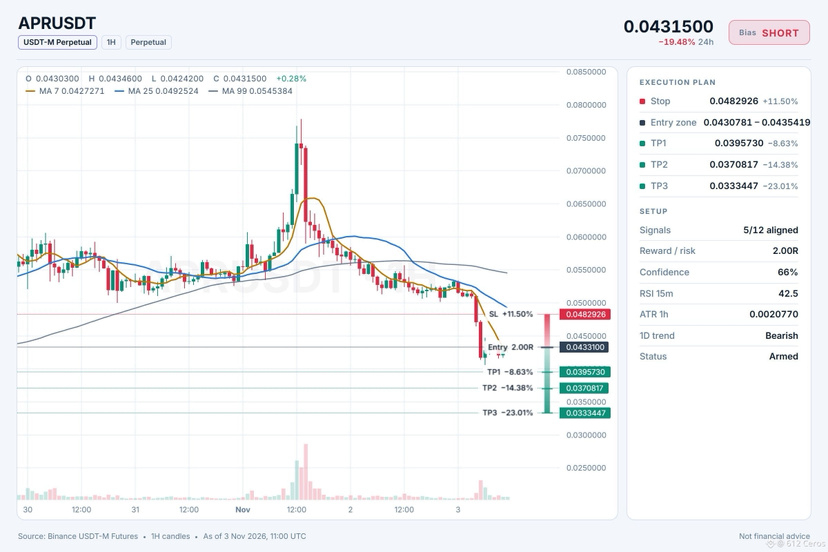
APR short setup: the levels I'm watching
🔴 SHORT $APR /USDT: expecting price to go DOWN
Bias: SHORT · Leaning
Entry: 0.0430781 – 0.0435419
TP1: 0.0395730 (-8.6%)
TP2: 0.0370817 (-14.4%)
TP3: 0.0333447 (-23.0%)
SL: 0.0482926 (+11.5%)
Plan: enter only inside the zone, close 50% at TP1, 25% at TP2, 25% at TP3, and move the stop to entry after TP1.
Note: moderate conviction only, keep size light.
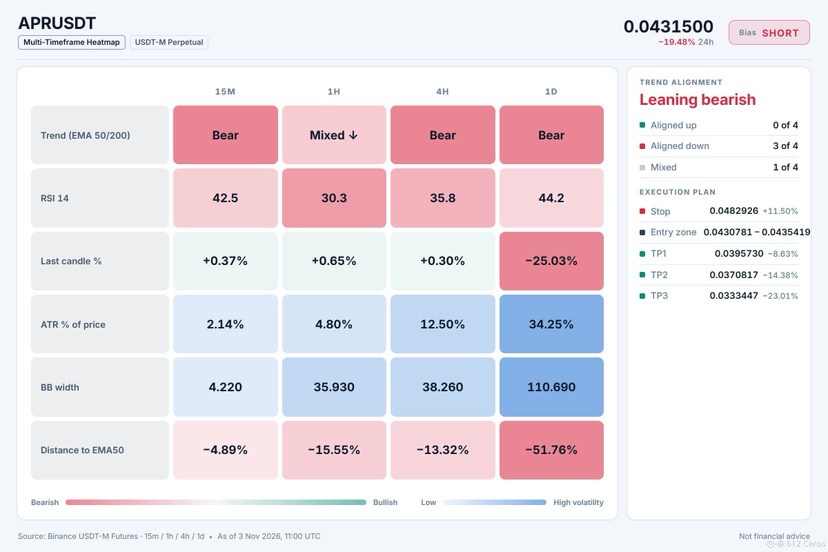
Why SHORT? 5/12 signals agree, 1 against.
• Daily trend down (below EMA50 & EMA200)
• 4h trend down (below EMA50 & EMA200)
• Sellers have the momentum (4h RSI 35.8)
Risk: Far below its average, bounce likely (−3.8 ATR from 1h EMA50)
The reasoning:
The daily trend reads bearish, and 5/12 signals aligned favour the short side. The plan is to work the 0.0430781 – 0.0435419 zone, scale out at 0.0395730 and 0.0370817, and stay patient for 0.0333447. A move through 0.0482926 means the idea is wrong and the stop does its job.
Does APR tag 0.0395730 first, or the stop?
{future}(APRUSDT)
APR short setup: the levels I'm watching
🔴 SHORT $APR /USDT: expecting price to go DOWN
Bias: SHORT · Leaning
Entry: 0.0430781 – 0.0435419
TP1: 0.0395730 (-8.6%)
TP2: 0.0370817 (-14.4%)
TP3: 0.0333447 (-23.0%)
SL: 0.0482926 (+11.5%)
Plan: enter only inside the zone, close 50% at TP1, 25% at TP2, 25% at TP3, and move the stop to entry after TP1.
Note: moderate conviction only, keep size light.
Why SHORT? 5/12 signals agree, 1 against.
• Daily trend down (below EMA50 & EMA200)
• 4h trend down (below EMA50 & EMA200)
• Sellers have the momentum (4h RSI 35.8)
Risk: Far below its average, bounce likely (−3.8 ATR from 1h EMA50)
The reasoning:
The daily trend reads bearish, and 5/12 signals aligned favour the short side. The plan is to work the 0.0430781 – 0.0435419 zone, scale out at 0.0395730 and 0.0370817, and stay patient for 0.0333447. A move through 0.0482926 means the idea is wrong and the stop does its job.
Does APR tag 0.0395730 first, or the stop?
🔴 SHORT $APR /USDT: expecting price to go DOWN
Bias: SHORT · Leaning
Entry: 0.0430781 – 0.0435419
TP1: 0.0395730 (-8.6%)
TP2: 0.0370817 (-14.4%)
TP3: 0.0333447 (-23.0%)
SL: 0.0482926 (+11.5%)
Plan: enter only inside the zone, close 50% at TP1, 25% at TP2, 25% at TP3, and move the stop to entry after TP1.
Note: moderate conviction only, keep size light.
Why SHORT? 5/12 signals agree, 1 against.
• Daily trend down (below EMA50 & EMA200)
• 4h trend down (below EMA50 & EMA200)
• Sellers have the momentum (4h RSI 35.8)
Risk: Far below its average, bounce likely (−3.8 ATR from 1h EMA50)
The reasoning:
The daily trend reads bearish, and 5/12 signals aligned favour the short side. The plan is to work the 0.0430781 – 0.0435419 zone, scale out at 0.0395730 and 0.0370817, and stay patient for 0.0333447. A move through 0.0482926 means the idea is wrong and the stop does its job.
Does APR tag 0.0395730 first, or the stop?
16
·
--
Baissier
Voir la traduction
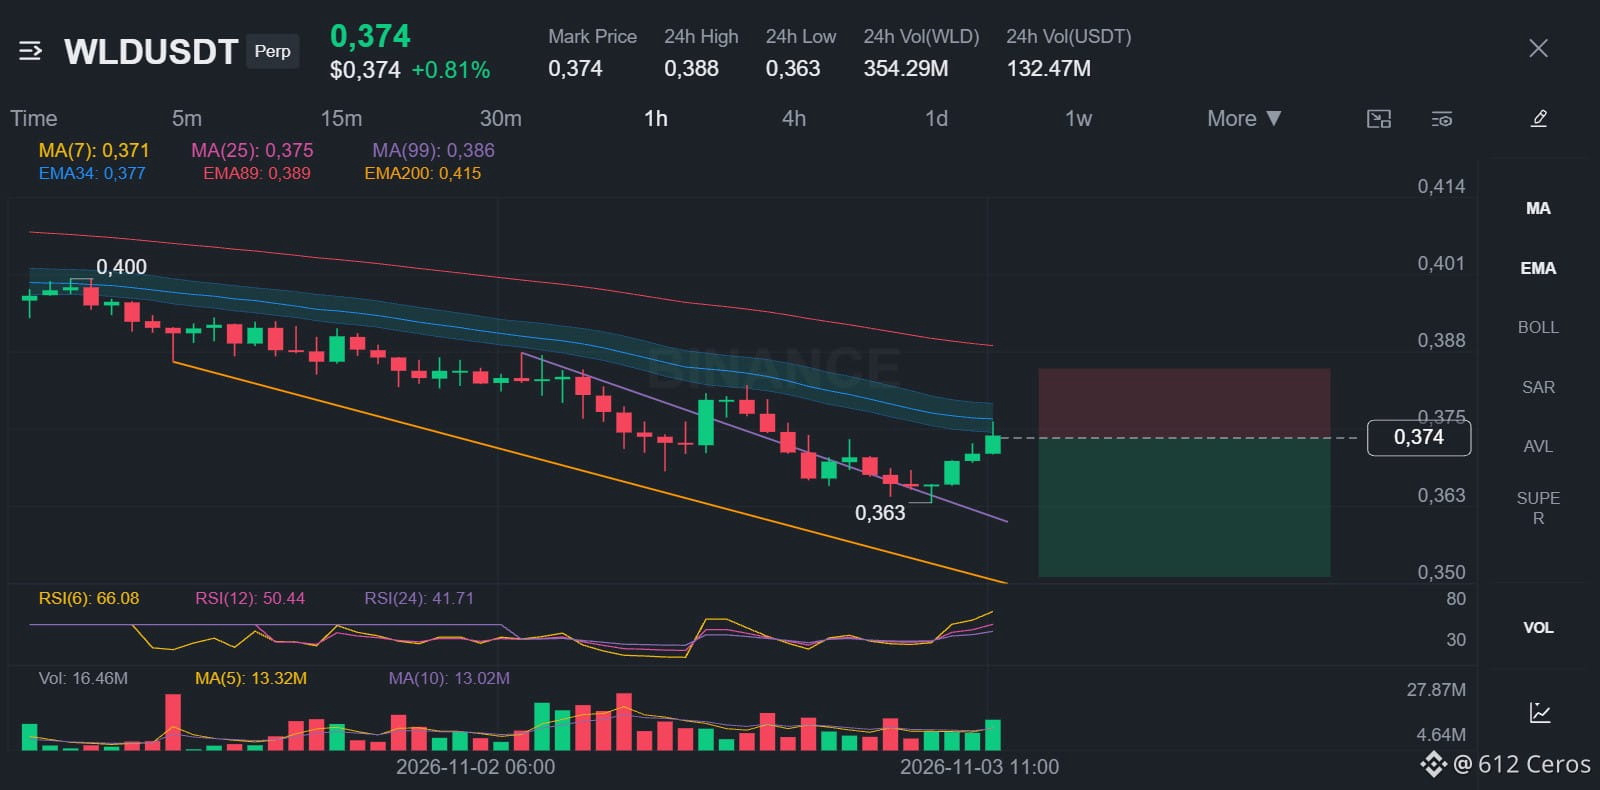
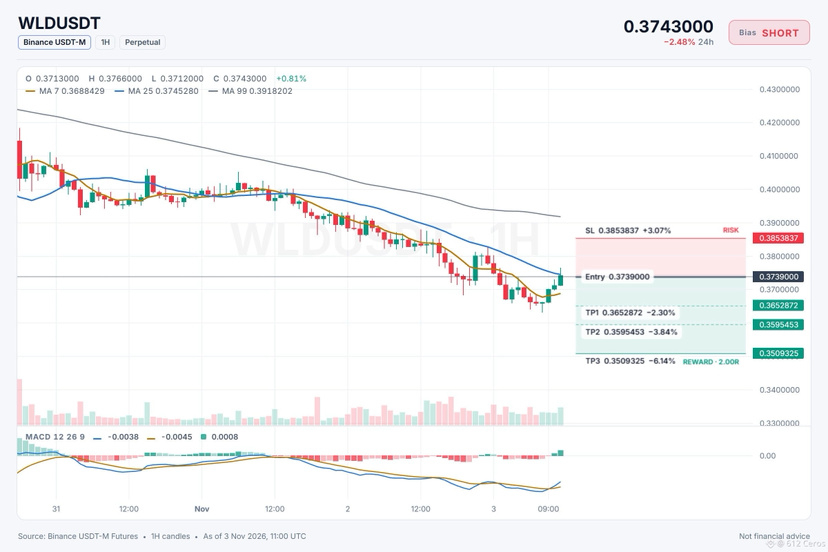
Range-bound WLD can still drop hard.
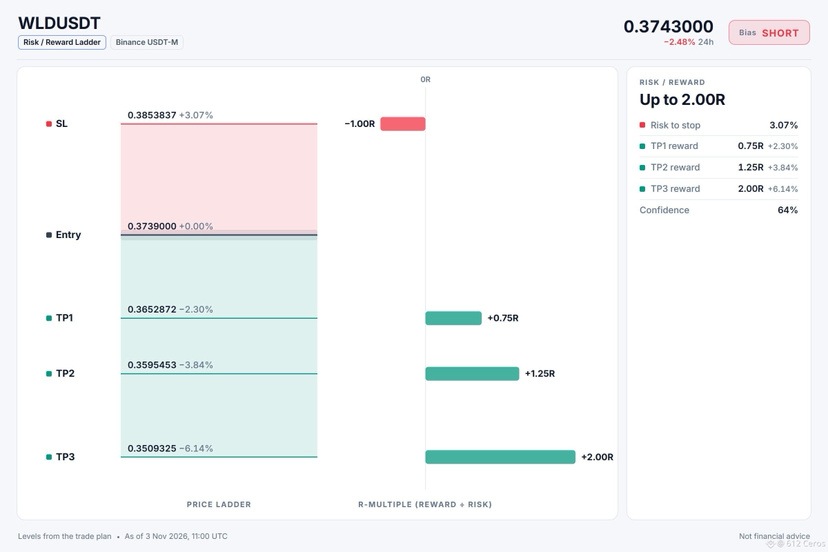
🔴 SHORT $WLD /USDT: expecting price to go DOWN
Bias: SHORT · Leaning
Entry: 0.3733584 – 0.3744416
TP1: 0.3652872 (-2.3%)
TP2: 0.3595453 (-3.8%)
TP3: 0.3509325 (-6.1%)
SL: 0.3853837 (+3.1%)
Plan: enter only inside the zone, close 50% at TP1, 25% at TP2, 25% at TP3, and move the stop to entry after TP1.
Note: moderate conviction only, keep size light.
Why SHORT? 5/12 signals agree, 1 against.
• 4h trend down (below EMA50 & EMA200)
• 1h trend down (below EMA50 & EMA200)
• Sellers have the momentum (4h RSI 36.3)
Risk: Buyers are driving the move (15m ADX 23.9)
Q: Why short here when buyers lead?
A: The 4h stack is bearish, meaning the swing trend is down.
Q: When would this setup be wrong?
A: A 15m ADX reading of 23.9 with DI+ above DI- means buyers are driving the move.
What is your WLD level if this fails?
{spot}(WLDUSDT)
Range-bound WLD can still drop hard.
🔴 SHORT $WLD /USDT: expecting price to go DOWN
Bias: SHORT · Leaning
Entry: 0.3733584 – 0.3744416
TP1: 0.3652872 (-2.3%)
TP2: 0.3595453 (-3.8%)
TP3: 0.3509325 (-6.1%)
SL: 0.3853837 (+3.1%)
Plan: enter only inside the zone, close 50% at TP1, 25% at TP2, 25% at TP3, and move the stop to entry after TP1.
Note: moderate conviction only, keep size light.
Why SHORT? 5/12 signals agree, 1 against.
• 4h trend down (below EMA50 & EMA200)
• 1h trend down (below EMA50 & EMA200)
• Sellers have the momentum (4h RSI 36.3)
Risk: Buyers are driving the move (15m ADX 23.9)
Q: Why short here when buyers lead?
A: The 4h stack is bearish, meaning the swing trend is down.
Q: When would this setup be wrong?
A: A 15m ADX reading of 23.9 with DI+ above DI- means buyers are driving the move.
What is your WLD level if this fails?
🔴 SHORT $WLD /USDT: expecting price to go DOWN
Bias: SHORT · Leaning
Entry: 0.3733584 – 0.3744416
TP1: 0.3652872 (-2.3%)
TP2: 0.3595453 (-3.8%)
TP3: 0.3509325 (-6.1%)
SL: 0.3853837 (+3.1%)
Plan: enter only inside the zone, close 50% at TP1, 25% at TP2, 25% at TP3, and move the stop to entry after TP1.
Note: moderate conviction only, keep size light.
Why SHORT? 5/12 signals agree, 1 against.
• 4h trend down (below EMA50 & EMA200)
• 1h trend down (below EMA50 & EMA200)
• Sellers have the momentum (4h RSI 36.3)
Risk: Buyers are driving the move (15m ADX 23.9)
Q: Why short here when buyers lead?
A: The 4h stack is bearish, meaning the swing trend is down.
Q: When would this setup be wrong?
A: A 15m ADX reading of 23.9 with DI+ above DI- means buyers are driving the move.
What is your WLD level if this fails?
7
·
--
Baissier
Voir la traduction
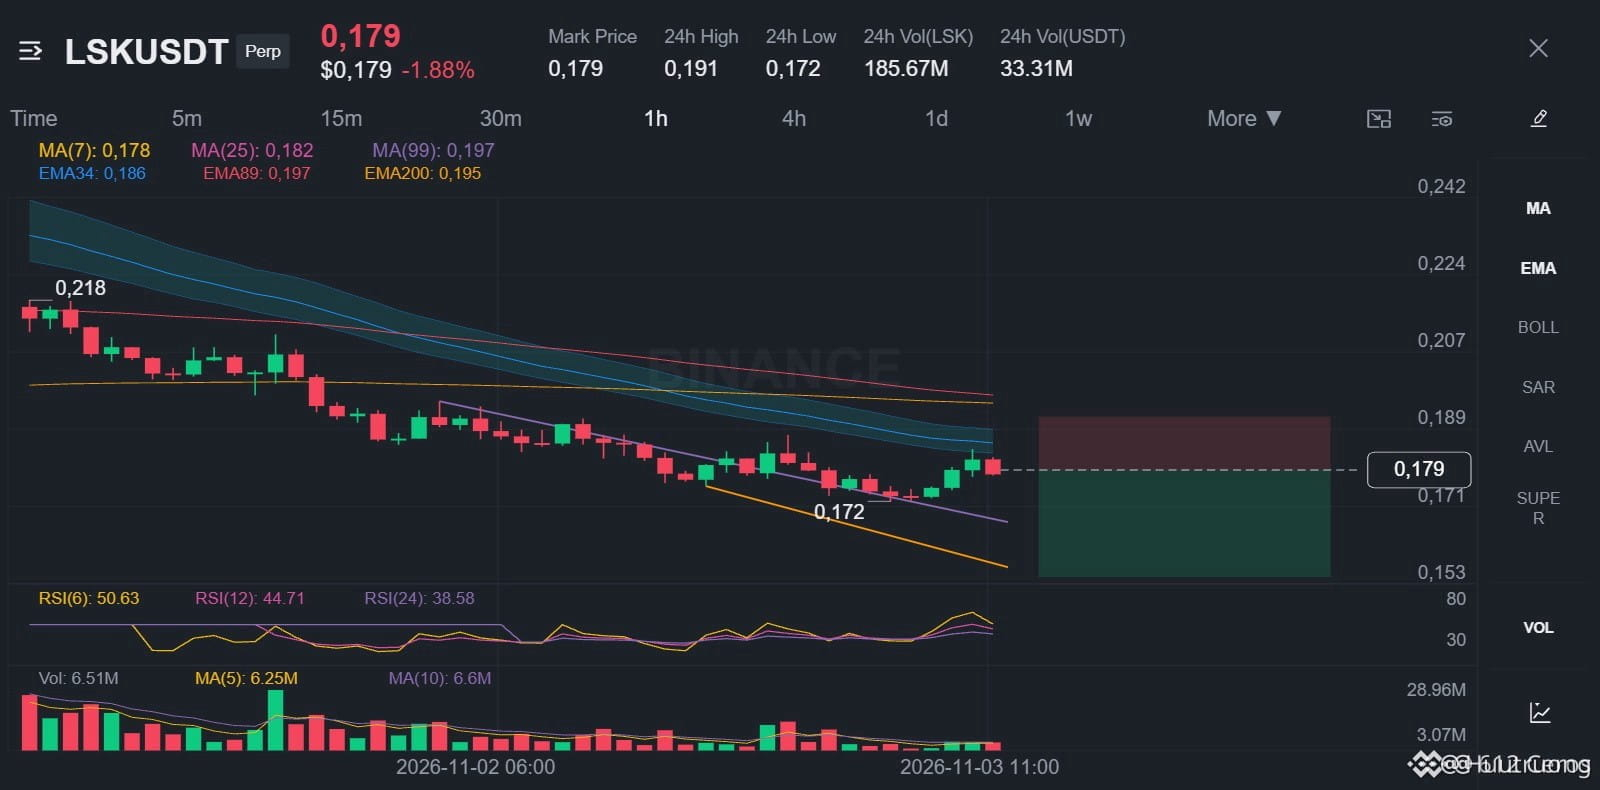
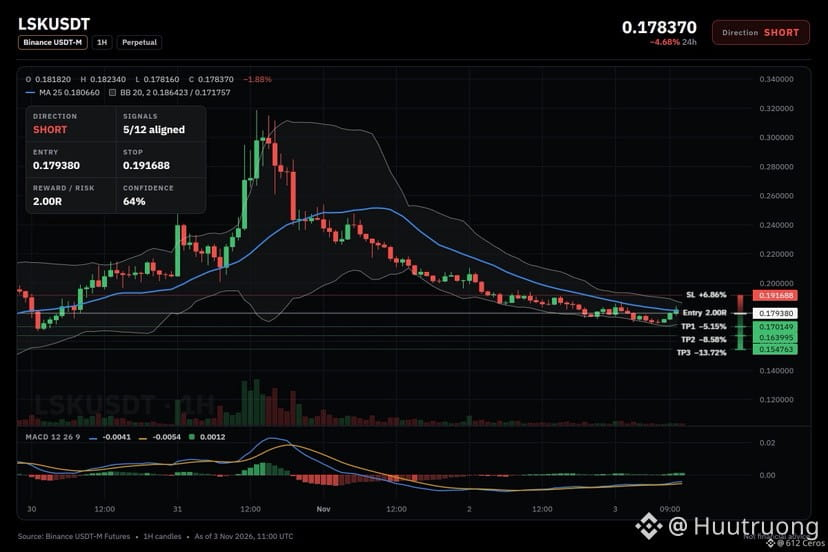
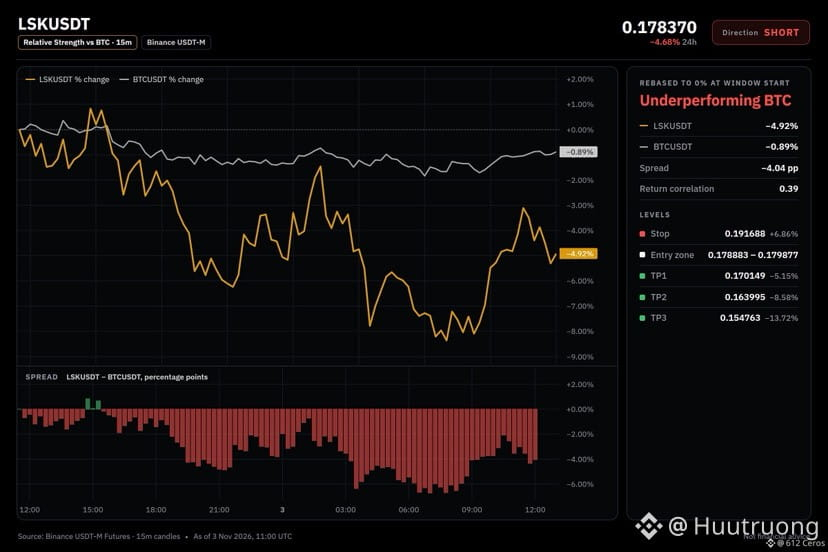
🔴 SHORT $LSK /USDT: expecting price to go DOWN
Bias: SHORT · Leaning
Entry: 0.178883 – 0.179877
TP1: 0.170149 (-5.1%)
TP2: 0.163995 (-8.6%)
TP3: 0.154763 (-13.7%)
SL: 0.191688 (+6.9%)
Plan: enter only inside the zone, close 50% at TP1, 25% at TP2, 25% at TP3, and move the stop to entry after TP1.
Note: moderate conviction only, keep size light.
LSK sits below both EMAs on the 4h stack
Why SHORT? 5/12 signals agree, 1 against.
• 4h trend down (below EMA50 & EMA200)
• 1h trend down (below EMA50 & EMA200)
• Sellers have the momentum (4h RSI 41.5)
Risk: Buyers are driving the move (15m ADX 23.8)
The 4h price sits below EMA50 and EMA200 in a bearish stack, with 4h RSI at 41.5 showing bearish momentum below 45.
Where do you see LSK finding support?
{spot}(LSKUSDT)
🔴 SHORT $LSK /USDT: expecting price to go DOWN
Bias: SHORT · Leaning
Entry: 0.178883 – 0.179877
TP1: 0.170149 (-5.1%)
TP2: 0.163995 (-8.6%)
TP3: 0.154763 (-13.7%)
SL: 0.191688 (+6.9%)
Plan: enter only inside the zone, close 50% at TP1, 25% at TP2, 25% at TP3, and move the stop to entry after TP1.
Note: moderate conviction only, keep size light.
LSK sits below both EMAs on the 4h stack
Why SHORT? 5/12 signals agree, 1 against.
• 4h trend down (below EMA50 & EMA200)
• 1h trend down (below EMA50 & EMA200)
• Sellers have the momentum (4h RSI 41.5)
Risk: Buyers are driving the move (15m ADX 23.8)
The 4h price sits below EMA50 and EMA200 in a bearish stack, with 4h RSI at 41.5 showing bearish momentum below 45.
Where do you see LSK finding support?
Bias: SHORT · Leaning
Entry: 0.178883 – 0.179877
TP1: 0.170149 (-5.1%)
TP2: 0.163995 (-8.6%)
TP3: 0.154763 (-13.7%)
SL: 0.191688 (+6.9%)
Plan: enter only inside the zone, close 50% at TP1, 25% at TP2, 25% at TP3, and move the stop to entry after TP1.
Note: moderate conviction only, keep size light.
LSK sits below both EMAs on the 4h stack
Why SHORT? 5/12 signals agree, 1 against.
• 4h trend down (below EMA50 & EMA200)
• 1h trend down (below EMA50 & EMA200)
• Sellers have the momentum (4h RSI 41.5)
Risk: Buyers are driving the move (15m ADX 23.8)
The 4h price sits below EMA50 and EMA200 in a bearish stack, with 4h RSI at 41.5 showing bearish momentum below 45.
Where do you see LSK finding support?
12
·
--
Haussier
Voir la traduction
The daily trend stacks bullish for HYPE.
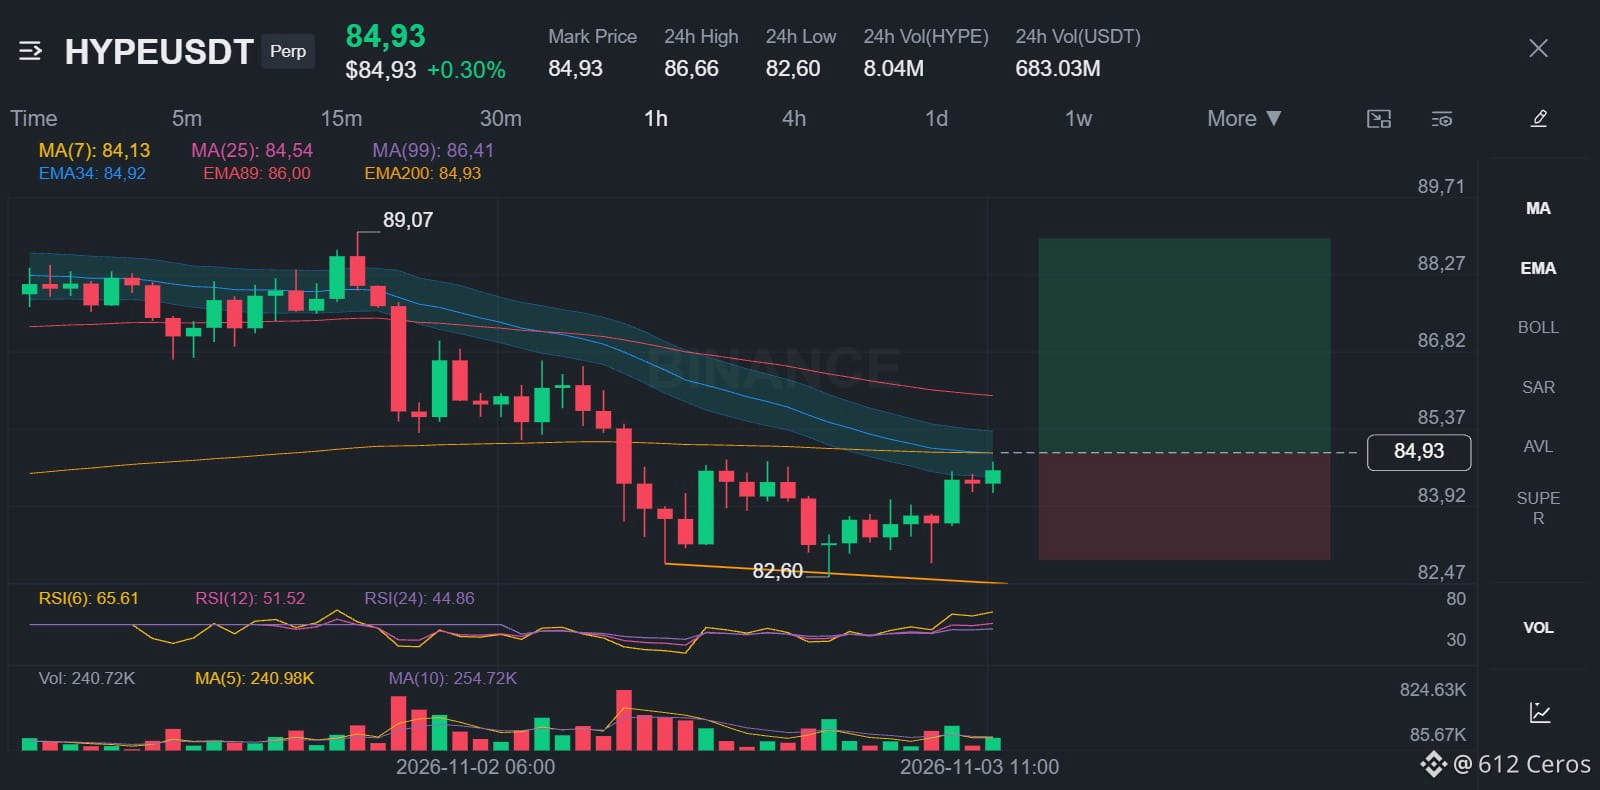
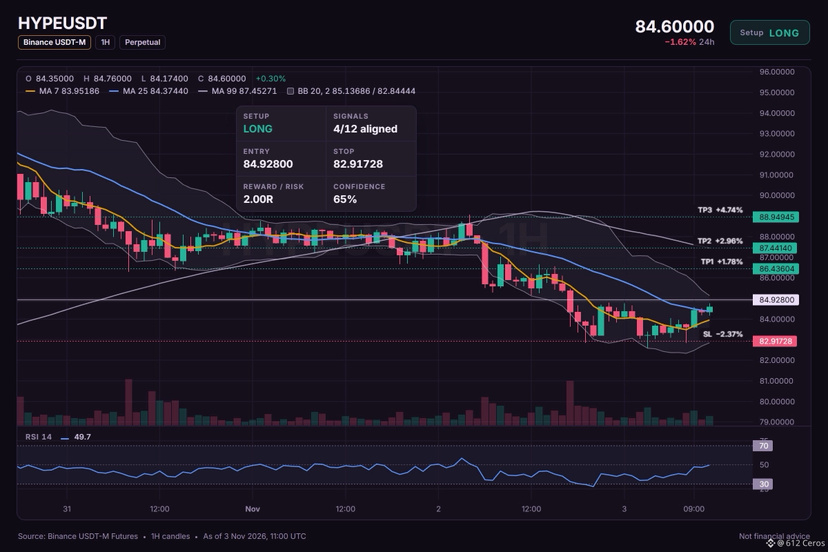
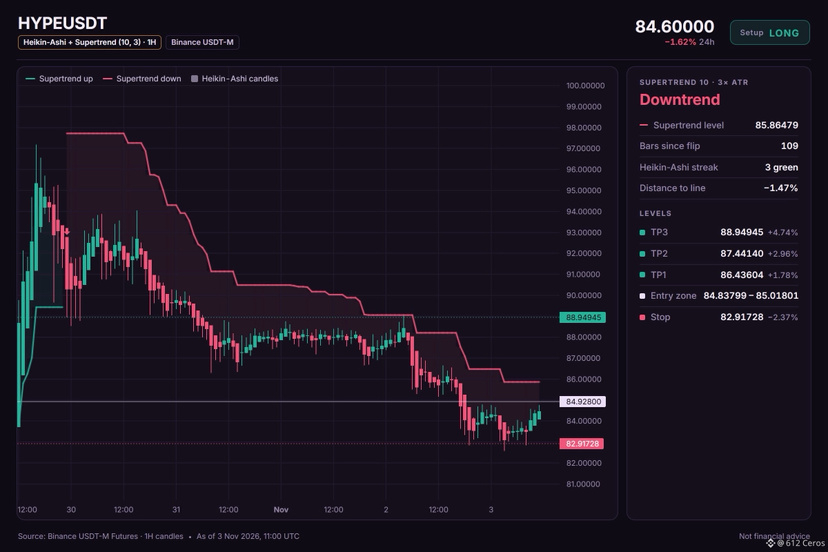
🟢 LONG $HYPE /USDT: expecting price to go UP
Bias: LONG · Leaning
Entry: 84.83799 – 85.01801
TP1: 86.43604 (+1.8%)
TP2: 87.44140 (+3.0%)
TP3: 88.94945 (+4.7%)
SL: 82.91728 (-2.4%)
Plan: enter only inside the zone, close 50% at TP1, 25% at TP2, 25% at TP3, and move the stop to entry after TP1.
Note: moderate conviction only, keep size light.
Why LONG? 4/12 signals agree, 1 against.
• Daily trend up (above EMA50 & EMA200)
• 4h trend up (above EMA50 & EMA200)
• Buyers are driving the move (15m ADX 21.2)
Risk: Sellers have the momentum (4h RSI 44.8)
My read on HYPE today
I'm watching HYPE because the daily trend is bullish and the 4h trend is also bullish. The 1h price is 84.92800, near the entry band, and the 15m RSI is 64.34, which means buyers are pressing but not overextended. The strongest support is the daily bullish stack, while the main risk is the 4h RSI at 44.8, meaning sellers have momentum on that timeframe.
Where would you set your invalidation for HYPE?
{spot}(HYPEUSDT)
The daily trend stacks bullish for HYPE.
🟢 LONG $HYPE /USDT: expecting price to go UP
Bias: LONG · Leaning
Entry: 84.83799 – 85.01801
TP1: 86.43604 (+1.8%)
TP2: 87.44140 (+3.0%)
TP3: 88.94945 (+4.7%)
SL: 82.91728 (-2.4%)
Plan: enter only inside the zone, close 50% at TP1, 25% at TP2, 25% at TP3, and move the stop to entry after TP1.
Note: moderate conviction only, keep size light.
Why LONG? 4/12 signals agree, 1 against.
• Daily trend up (above EMA50 & EMA200)
• 4h trend up (above EMA50 & EMA200)
• Buyers are driving the move (15m ADX 21.2)
Risk: Sellers have the momentum (4h RSI 44.8)
My read on HYPE today
I'm watching HYPE because the daily trend is bullish and the 4h trend is also bullish. The 1h price is 84.92800, near the entry band, and the 15m RSI is 64.34, which means buyers are pressing but not overextended. The strongest support is the daily bullish stack, while the main risk is the 4h RSI at 44.8, meaning sellers have momentum on that timeframe.
Where would you set your invalidation for HYPE?
🟢 LONG $HYPE /USDT: expecting price to go UP
Bias: LONG · Leaning
Entry: 84.83799 – 85.01801
TP1: 86.43604 (+1.8%)
TP2: 87.44140 (+3.0%)
TP3: 88.94945 (+4.7%)
SL: 82.91728 (-2.4%)
Plan: enter only inside the zone, close 50% at TP1, 25% at TP2, 25% at TP3, and move the stop to entry after TP1.
Note: moderate conviction only, keep size light.
Why LONG? 4/12 signals agree, 1 against.
• Daily trend up (above EMA50 & EMA200)
• 4h trend up (above EMA50 & EMA200)
• Buyers are driving the move (15m ADX 21.2)
Risk: Sellers have the momentum (4h RSI 44.8)
My read on HYPE today
I'm watching HYPE because the daily trend is bullish and the 4h trend is also bullish. The 1h price is 84.92800, near the entry band, and the 15m RSI is 64.34, which means buyers are pressing but not overextended. The strongest support is the daily bullish stack, while the main risk is the 4h RSI at 44.8, meaning sellers have momentum on that timeframe.
Where would you set your invalidation for HYPE?
5
·
--
Haussier
Voir la traduction
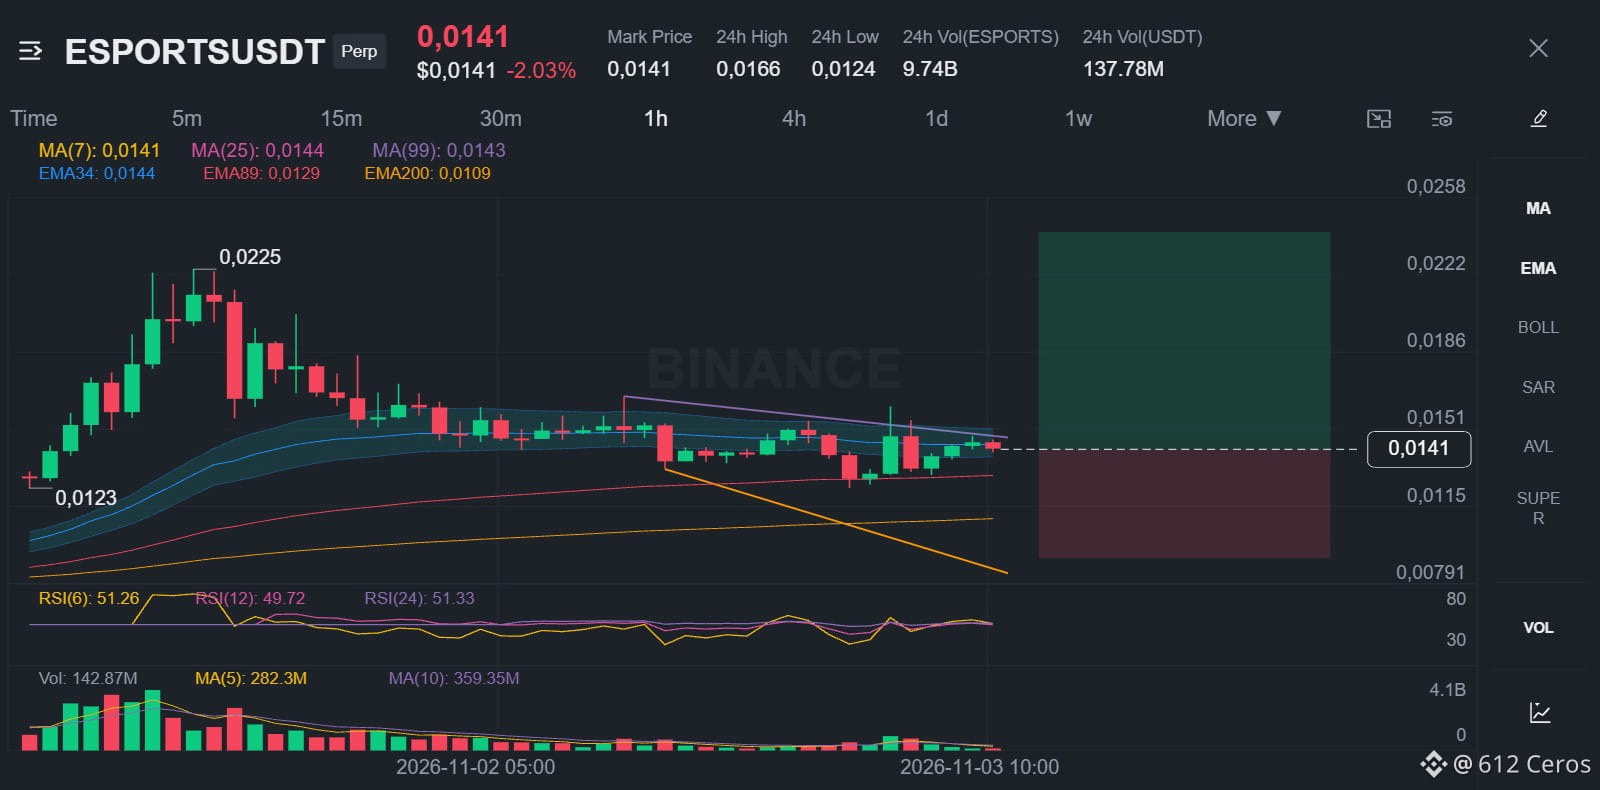
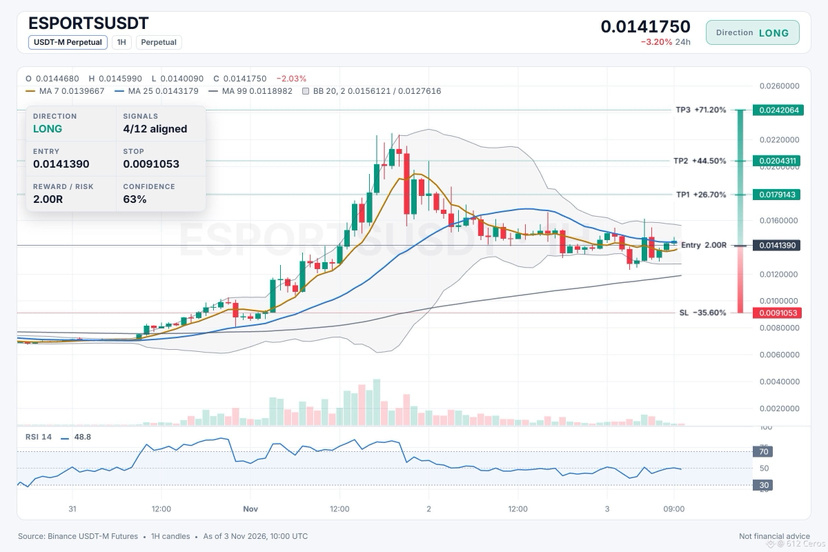
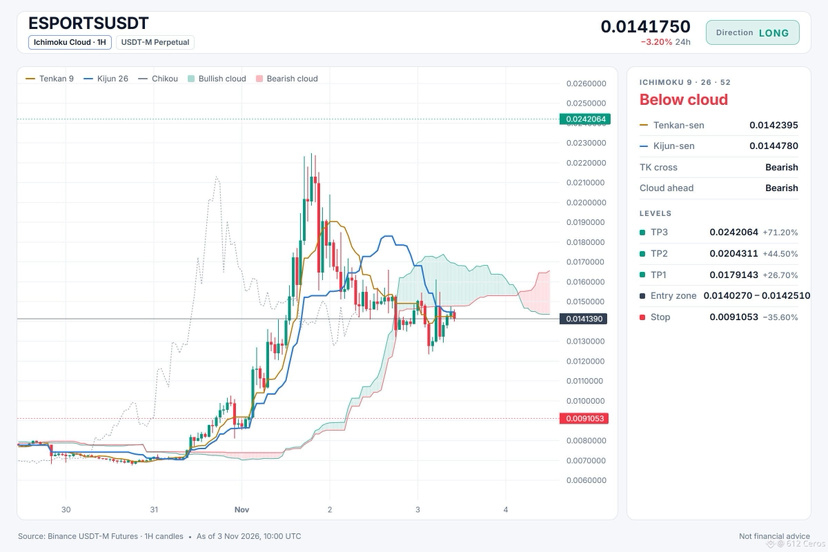
ESPORTS long setup: the levels I'm watching
🟢 LONG $ESPORTS /USDT: expecting price to go UP
Bias: LONG · Leaning
Entry: 0.0140270 – 0.0142510
TP1: 0.0179143 (+26.7%)
TP2: 0.0204311 (+44.5%)
TP3: 0.0242064 (+71.2%)
SL: 0.0091053 (-35.6%)
Plan: enter only inside the zone, close 50% at TP1, 25% at TP2, 25% at TP3, and move the stop to entry after TP1.
Note: moderate conviction only, keep size light.
Why LONG? 4/12 signals agree, 1 against.
• 4h trend up (above EMA50 & EMA200)
• 1h trend up (above EMA50 & EMA200)
• Buyers are driving the move (15m ADX 20.6)
Risk: Weaker than BTC (−2.46% 24h vs BTC)
The reasoning:
The daily trend reads range, and 4/12 signals aligned favour the long side. The plan is to work the 0.0140270 – 0.0142510 zone, scale out at 0.0179143 and 0.0204311, and stay patient for 0.0242064. A move through 0.0091053 means the idea is wrong and the stop does its job.
Does ESPORTS tag 0.0179143 first, or the stop?
{future}(ESPORTSUSDT)
ESPORTS long setup: the levels I'm watching
🟢 LONG $ESPORTS /USDT: expecting price to go UP
Bias: LONG · Leaning
Entry: 0.0140270 – 0.0142510
TP1: 0.0179143 (+26.7%)
TP2: 0.0204311 (+44.5%)
TP3: 0.0242064 (+71.2%)
SL: 0.0091053 (-35.6%)
Plan: enter only inside the zone, close 50% at TP1, 25% at TP2, 25% at TP3, and move the stop to entry after TP1.
Note: moderate conviction only, keep size light.
Why LONG? 4/12 signals agree, 1 against.
• 4h trend up (above EMA50 & EMA200)
• 1h trend up (above EMA50 & EMA200)
• Buyers are driving the move (15m ADX 20.6)
Risk: Weaker than BTC (−2.46% 24h vs BTC)
The reasoning:
The daily trend reads range, and 4/12 signals aligned favour the long side. The plan is to work the 0.0140270 – 0.0142510 zone, scale out at 0.0179143 and 0.0204311, and stay patient for 0.0242064. A move through 0.0091053 means the idea is wrong and the stop does its job.
Does ESPORTS tag 0.0179143 first, or the stop?
🟢 LONG $ESPORTS /USDT: expecting price to go UP
Bias: LONG · Leaning
Entry: 0.0140270 – 0.0142510
TP1: 0.0179143 (+26.7%)
TP2: 0.0204311 (+44.5%)
TP3: 0.0242064 (+71.2%)
SL: 0.0091053 (-35.6%)
Plan: enter only inside the zone, close 50% at TP1, 25% at TP2, 25% at TP3, and move the stop to entry after TP1.
Note: moderate conviction only, keep size light.
Why LONG? 4/12 signals agree, 1 against.
• 4h trend up (above EMA50 & EMA200)
• 1h trend up (above EMA50 & EMA200)
• Buyers are driving the move (15m ADX 20.6)
Risk: Weaker than BTC (−2.46% 24h vs BTC)
The reasoning:
The daily trend reads range, and 4/12 signals aligned favour the long side. The plan is to work the 0.0140270 – 0.0142510 zone, scale out at 0.0179143 and 0.0204311, and stay patient for 0.0242064. A move through 0.0091053 means the idea is wrong and the stop does its job.
Does ESPORTS tag 0.0179143 first, or the stop?
4
·
--
Baissier
Voir la traduction
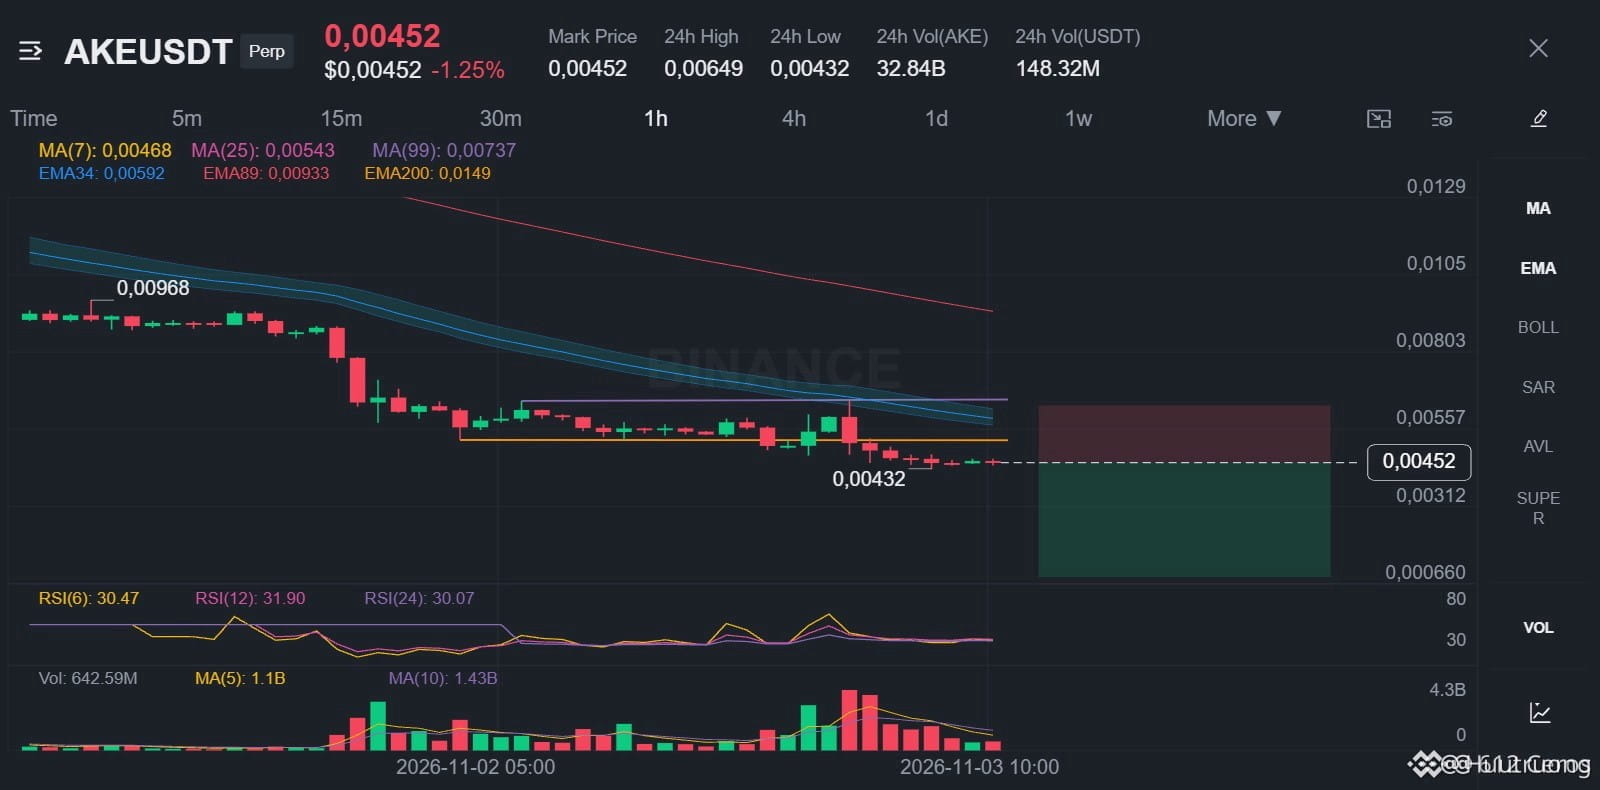
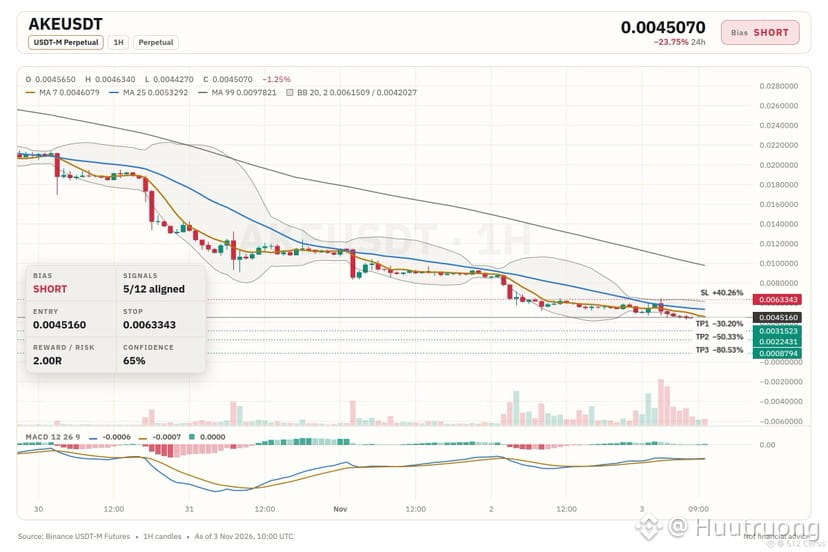
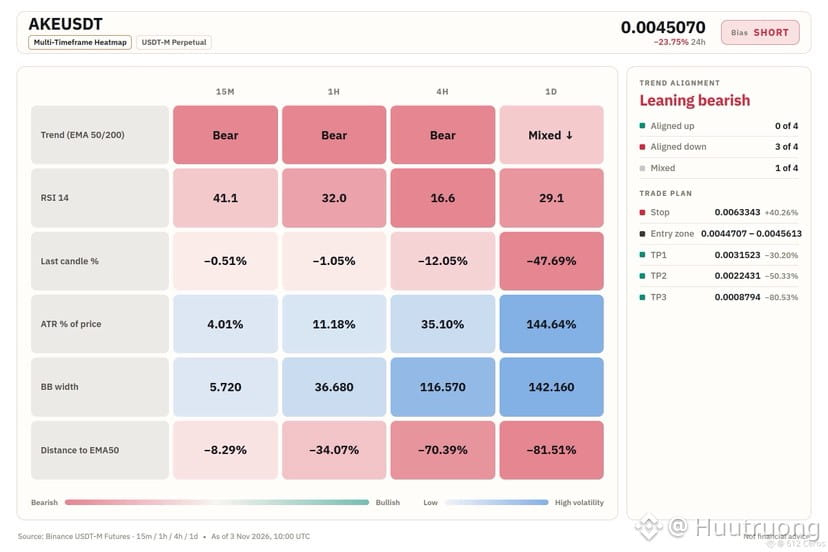
Is AKE trapped inside a bearish 4h stack?
🔴 SHORT $AKE /USDT: expecting price to go DOWN
Bias: SHORT · Leaning
Entry: 0.0044707 – 0.0045613
TP1: 0.0031523 (-30.2%)
TP2: 0.0022431 (-50.3%)
TP3: 0.0008794 (-80.5%)
SL: 0.0063343 (+40.3%)
Plan: enter only inside the zone, close 50% at TP1, 25% at TP2, 25% at TP3, and move the stop to entry after TP1.
Note: moderate conviction only, keep size light.
Why SHORT? 5/12 signals agree, 1 against.
• 4h trend down (below EMA50 & EMA200)
• 1h trend down (below EMA50 & EMA200)
• Sellers are driving the move (15m ADX 22.9)
Risk: Price is washed out, bounces are common from here (4h RSI 16.6, oversold)
Q: Why short AKE here?
A: The 4h trend shows price below EMA50 and EMA200, a bearish stack.
Q: When is this trade wrong?
A: A bounce is likely because the 1h price is 4.6 ATR below its EMA50.
What level would make you take the opposite side?
{future}(AKEUSDT)
Is AKE trapped inside a bearish 4h stack?
🔴 SHORT $AKE /USDT: expecting price to go DOWN
Bias: SHORT · Leaning
Entry: 0.0044707 – 0.0045613
TP1: 0.0031523 (-30.2%)
TP2: 0.0022431 (-50.3%)
TP3: 0.0008794 (-80.5%)
SL: 0.0063343 (+40.3%)
Plan: enter only inside the zone, close 50% at TP1, 25% at TP2, 25% at TP3, and move the stop to entry after TP1.
Note: moderate conviction only, keep size light.
Why SHORT? 5/12 signals agree, 1 against.
• 4h trend down (below EMA50 & EMA200)
• 1h trend down (below EMA50 & EMA200)
• Sellers are driving the move (15m ADX 22.9)
Risk: Price is washed out, bounces are common from here (4h RSI 16.6, oversold)
Q: Why short AKE here?
A: The 4h trend shows price below EMA50 and EMA200, a bearish stack.
Q: When is this trade wrong?
A: A bounce is likely because the 1h price is 4.6 ATR below its EMA50.
What level would make you take the opposite side?
🔴 SHORT $AKE /USDT: expecting price to go DOWN
Bias: SHORT · Leaning
Entry: 0.0044707 – 0.0045613
TP1: 0.0031523 (-30.2%)
TP2: 0.0022431 (-50.3%)
TP3: 0.0008794 (-80.5%)
SL: 0.0063343 (+40.3%)
Plan: enter only inside the zone, close 50% at TP1, 25% at TP2, 25% at TP3, and move the stop to entry after TP1.
Note: moderate conviction only, keep size light.
Why SHORT? 5/12 signals agree, 1 against.
• 4h trend down (below EMA50 & EMA200)
• 1h trend down (below EMA50 & EMA200)
• Sellers are driving the move (15m ADX 22.9)
Risk: Price is washed out, bounces are common from here (4h RSI 16.6, oversold)
Q: Why short AKE here?
A: The 4h trend shows price below EMA50 and EMA200, a bearish stack.
Q: When is this trade wrong?
A: A bounce is likely because the 1h price is 4.6 ATR below its EMA50.
What level would make you take the opposite side?
12
·
--
Baissier
Voir la traduction
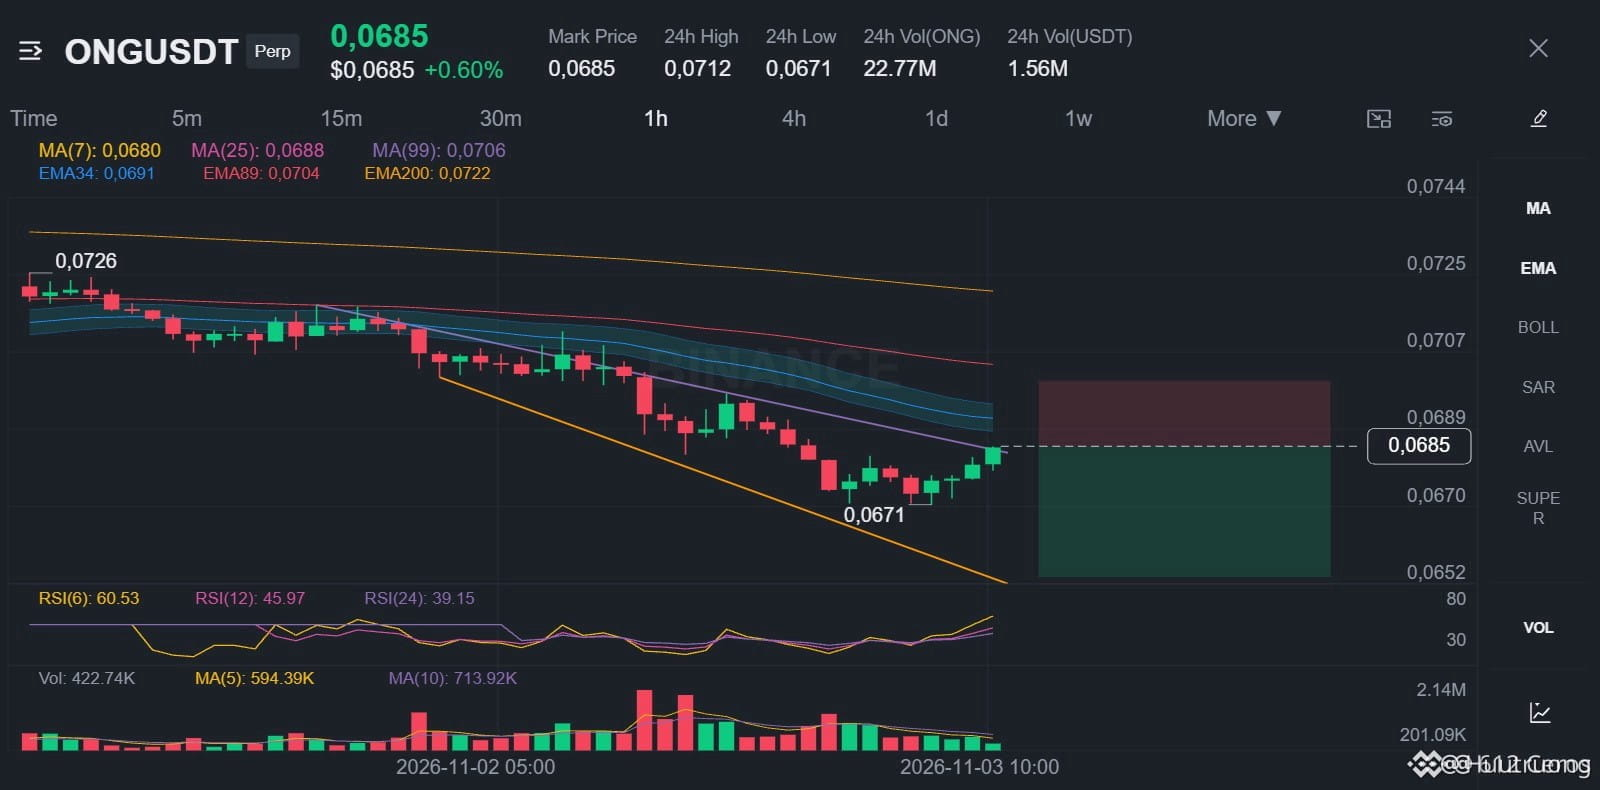
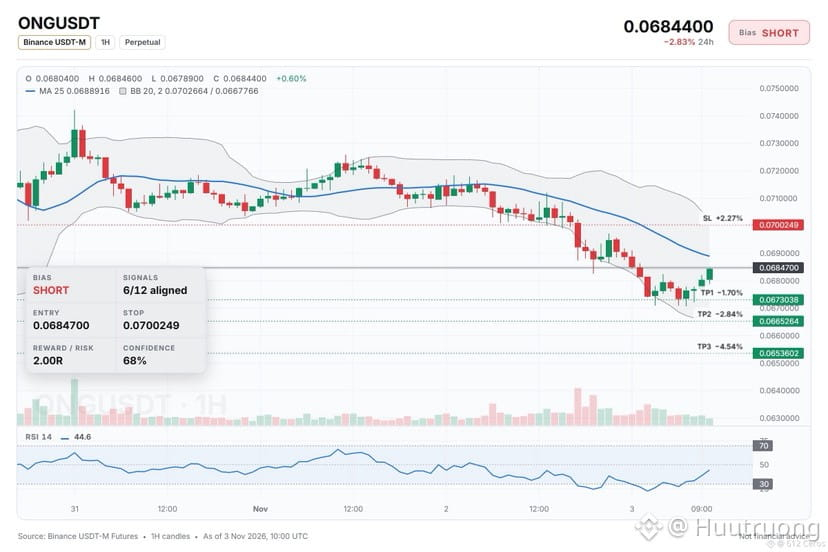
ONG keeps rallying while the stack says down.
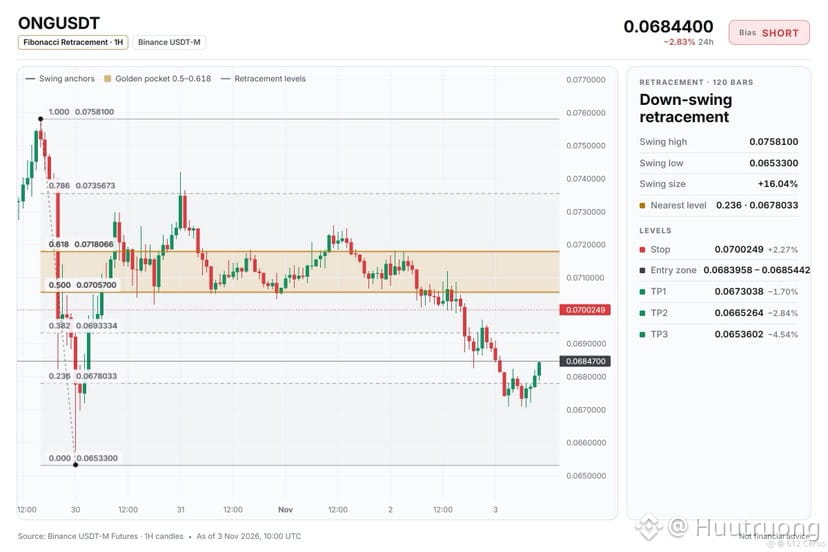
🔴 SHORT $ONG /USDT: expecting price to go DOWN
Bias: SHORT · Strong
Entry: 0.0683958 – 0.0685442
TP1: 0.0673038 (-1.7%)
TP2: 0.0665264 (-2.8%)
TP3: 0.0653602 (-4.5%)
SL: 0.0700249 (+2.3%)
Plan: enter only inside the zone, close 50% at TP1, 25% at TP2, 25% at TP3, and move the stop to entry after TP1.
Why SHORT? 6/12 signals agree, 1 against.
• 4h trend down (below EMA50 & EMA200)
• 1h trend down (below EMA50 & EMA200)
• Sellers have the momentum (4h RSI 31.6)
Risk: Buyers are pushing right now (+0.10% 15m candle)
Why I like it:
The 4h price sits below a bearish stack, and the 1h trend is also down. The 4h RSI is at 31.6, meaning sellers have momentum, while the 1h RSI is at 44.6, still favoring sellers. ONG is underperforming BTC by 2.00% over the last day, confirming relative weakness.
Where do you set your invalidation for this short?
{spot}(ONGUSDT)
ONG keeps rallying while the stack says down.
🔴 SHORT $ONG /USDT: expecting price to go DOWN
Bias: SHORT · Strong
Entry: 0.0683958 – 0.0685442
TP1: 0.0673038 (-1.7%)
TP2: 0.0665264 (-2.8%)
TP3: 0.0653602 (-4.5%)
SL: 0.0700249 (+2.3%)
Plan: enter only inside the zone, close 50% at TP1, 25% at TP2, 25% at TP3, and move the stop to entry after TP1.
Why SHORT? 6/12 signals agree, 1 against.
• 4h trend down (below EMA50 & EMA200)
• 1h trend down (below EMA50 & EMA200)
• Sellers have the momentum (4h RSI 31.6)
Risk: Buyers are pushing right now (+0.10% 15m candle)
Why I like it:
The 4h price sits below a bearish stack, and the 1h trend is also down. The 4h RSI is at 31.6, meaning sellers have momentum, while the 1h RSI is at 44.6, still favoring sellers. ONG is underperforming BTC by 2.00% over the last day, confirming relative weakness.
Where do you set your invalidation for this short?
🔴 SHORT $ONG /USDT: expecting price to go DOWN
Bias: SHORT · Strong
Entry: 0.0683958 – 0.0685442
TP1: 0.0673038 (-1.7%)
TP2: 0.0665264 (-2.8%)
TP3: 0.0653602 (-4.5%)
SL: 0.0700249 (+2.3%)
Plan: enter only inside the zone, close 50% at TP1, 25% at TP2, 25% at TP3, and move the stop to entry after TP1.
Why SHORT? 6/12 signals agree, 1 against.
• 4h trend down (below EMA50 & EMA200)
• 1h trend down (below EMA50 & EMA200)
• Sellers have the momentum (4h RSI 31.6)
Risk: Buyers are pushing right now (+0.10% 15m candle)
Why I like it:
The 4h price sits below a bearish stack, and the 1h trend is also down. The 4h RSI is at 31.6, meaning sellers have momentum, while the 1h RSI is at 44.6, still favoring sellers. ONG is underperforming BTC by 2.00% over the last day, confirming relative weakness.
Where do you set your invalidation for this short?
11
·
--
Baissier
Voir la traduction
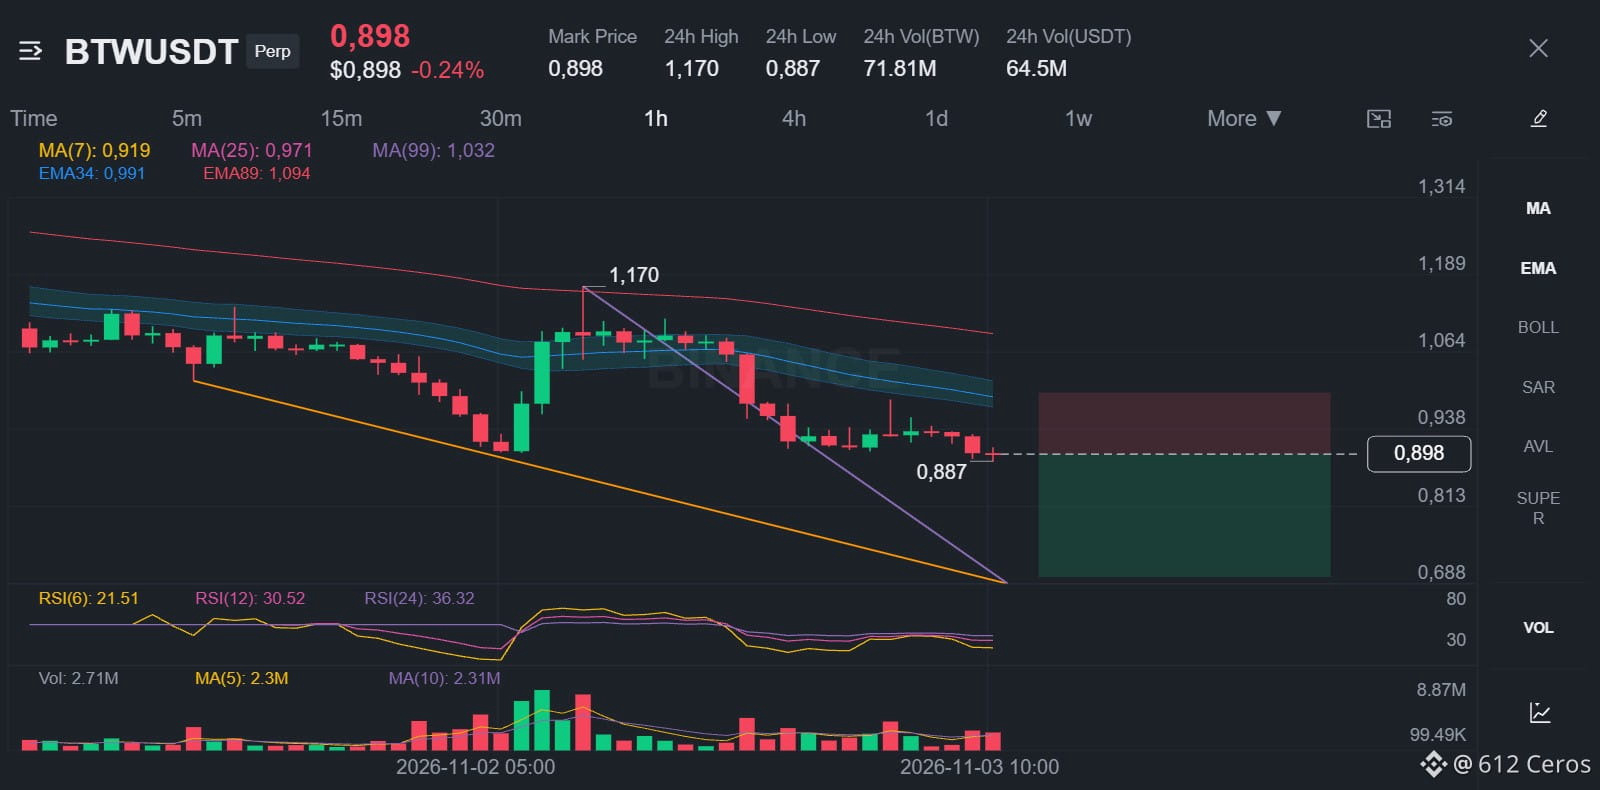
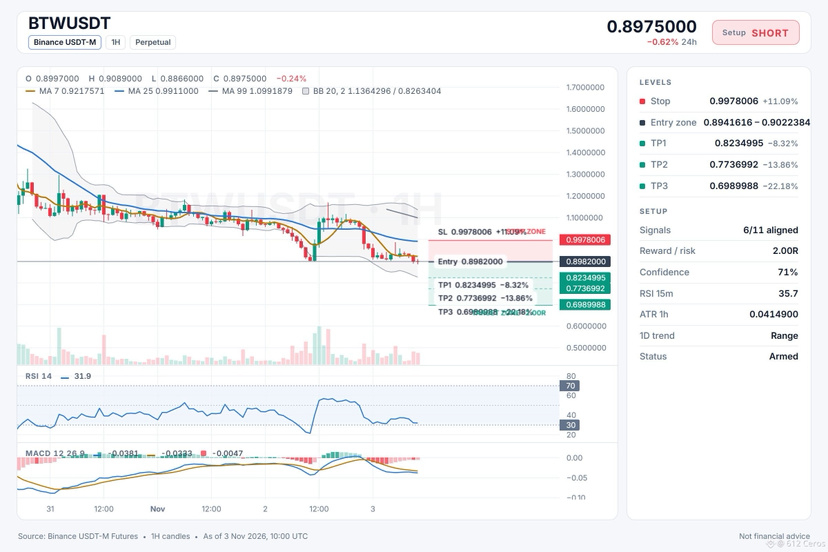
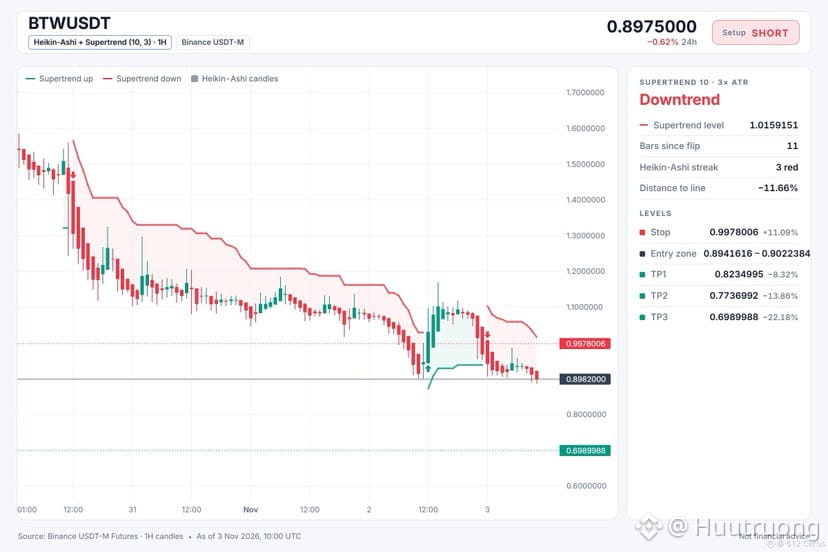
🔴 SHORT $BTW /USDT: expecting price to go DOWN
Bias: SHORT · Strong
Entry: 0.8941616 – 0.9022384
TP1: 0.8234995 (-8.3%)
TP2: 0.7736992 (-13.9%)
TP3: 0.6989988 (-22.2%)
SL: 0.9978006 (+11.1%)
Plan: enter only inside the zone, close 50% at TP1, 25% at TP2, 25% at TP3, and move the stop to entry after TP1.
Range-bound coins can still drop hard.
Why SHORT? 6/11 signals agree, 1 against.
• 4h trend down (below EMA50 & EMA200)
• 1h trend down (below EMA50 & EMA200)
• Sellers are driving the move (15m ADX 23.3)
Risk: Far below its average, bounce likely (−3.0 ATR from 1h EMA50)
The 4h trend shows price below both EMAs in a bearish stack, with 1h RSI at 31.9 confirming sellers are in control.
Where would you set your invalidation level?
{future}(BTWUSDT)
🔴 SHORT $BTW /USDT: expecting price to go DOWN
Bias: SHORT · Strong
Entry: 0.8941616 – 0.9022384
TP1: 0.8234995 (-8.3%)
TP2: 0.7736992 (-13.9%)
TP3: 0.6989988 (-22.2%)
SL: 0.9978006 (+11.1%)
Plan: enter only inside the zone, close 50% at TP1, 25% at TP2, 25% at TP3, and move the stop to entry after TP1.
Range-bound coins can still drop hard.
Why SHORT? 6/11 signals agree, 1 against.
• 4h trend down (below EMA50 & EMA200)
• 1h trend down (below EMA50 & EMA200)
• Sellers are driving the move (15m ADX 23.3)
Risk: Far below its average, bounce likely (−3.0 ATR from 1h EMA50)
The 4h trend shows price below both EMAs in a bearish stack, with 1h RSI at 31.9 confirming sellers are in control.
Where would you set your invalidation level?
Bias: SHORT · Strong
Entry: 0.8941616 – 0.9022384
TP1: 0.8234995 (-8.3%)
TP2: 0.7736992 (-13.9%)
TP3: 0.6989988 (-22.2%)
SL: 0.9978006 (+11.1%)
Plan: enter only inside the zone, close 50% at TP1, 25% at TP2, 25% at TP3, and move the stop to entry after TP1.
Range-bound coins can still drop hard.
Why SHORT? 6/11 signals agree, 1 against.
• 4h trend down (below EMA50 & EMA200)
• 1h trend down (below EMA50 & EMA200)
• Sellers are driving the move (15m ADX 23.3)
Risk: Far below its average, bounce likely (−3.0 ATR from 1h EMA50)
The 4h trend shows price below both EMAs in a bearish stack, with 1h RSI at 31.9 confirming sellers are in control.
Where would you set your invalidation level?
8
Connectez-vous pour découvrir plus de contenu
Rejoignez la communauté mondiale des adeptes de cryptomonnaies sur Binance Square
⚡️ Suviez les dernières informations importantes sur les cryptomonnaies.
💬 Jugé digne de confiance par la plus grande plateforme d’échange de cryptomonnaies au monde.
👍 Découvrez les connaissances que partagent les créateurs vérifiés.
Adresse e-mail/Nº de téléphone
Sujets d’actualité
BinanceIncidentReport
82,768 vues
768 mentions
Incident de sécurité Binance du 29 octobre 2026 : premières conclusions et mise à jour sur les mesures prises
Binance Blog
·403 mentions J’aime
·1.3M vues
BinanceReopensWithdrawalsForMoreAssets
214,293 vues
1,920 mentions
BinanceHourlyDepositsExceedWithdrawals
97,284 vues
909 mentions