

Cypher Silent
38 Publications

Cypher Silent
Signaler
Bloquer l’utilisateur
Exploring the intersection of Gold, Crypto & Global Markets. Sharing insights, trends, and smart investment strategies. Let's grow together!
Ouvert au trading
Trade régulièrement
4.6 an(s)
3 Suivis
6 Abonnés
9 J’aime
Publications
Portefeuille
Tous
Citations
PINNED
Article
Achat d’or des banques centrales : une demande record et ce que cela signifieAvez-vous suivi la hausse de l’or vers 4 400 $ et vous êtes demandé qui se trouve vraiment derrière ce mouvement ? L’achat d’or par les banques centrales est devenu l’une des forces les plus puissantes sur le marché de l’or depuis 2022. Ce n’est pas une demande “retail” habituelle : c’est une demande motivée par des politiques, portée par des institutions souveraines.
Au 12 août 2026, l’or au comptant s’échange à 4 401,70 $ la once troy. Ce niveau reflète bien plus que la demande liée à la joaillerie ou le trading de détail. Les institutions officielles remodèlent discrètement le marché, d’une manière que de nombreux investisseurs ne voient pas.
Pour les investisseurs particuliers, c’est important car la demande officielle peut soutenir les prix même lorsque le sentiment du marché devient négatif. Comprendre ce flux peut vous aider à éviter de vendre dans la panique lors des replis “normaux”.
Achat d’or des banques centrales : une demande record et ce que cela signifie
Avez-vous suivi la hausse de l’or vers 4 400 $ et vous êtes demandé qui se trouve vraiment derrière ce mouvement ? L’achat d’or par les banques centrales est devenu l’une des forces les plus puissantes sur le marché de l’or depuis 2022. Ce n’est pas une demande “retail” habituelle : c’est une demande motivée par des politiques, portée par des institutions souveraines.
Au 12 août 2026, l’or au comptant s’échange à 4 401,70 $ la once troy. Ce niveau reflète bien plus que la demande liée à la joaillerie ou le trading de détail. Les institutions officielles remodèlent discrètement le marché, d’une manière que de nombreux investisseurs ne voient pas.
Pour les investisseurs particuliers, c’est important car la demande officielle peut soutenir les prix même lorsque le sentiment du marché devient négatif. Comprendre ce flux peut vous aider à éviter de vendre dans la panique lors des replis “normaux”.
Au 12 août 2026, l’or au comptant s’échange à 4 401,70 $ la once troy. Ce niveau reflète bien plus que la demande liée à la joaillerie ou le trading de détail. Les institutions officielles remodèlent discrètement le marché, d’une manière que de nombreux investisseurs ne voient pas.
Pour les investisseurs particuliers, c’est important car la demande officielle peut soutenir les prix même lorsque le sentiment du marché devient négatif. Comprendre ce flux peut vous aider à éviter de vendre dans la panique lors des replis “normaux”.
2
1
18
Dois-je acheter ou vendre l’or lors de cette séance US ?
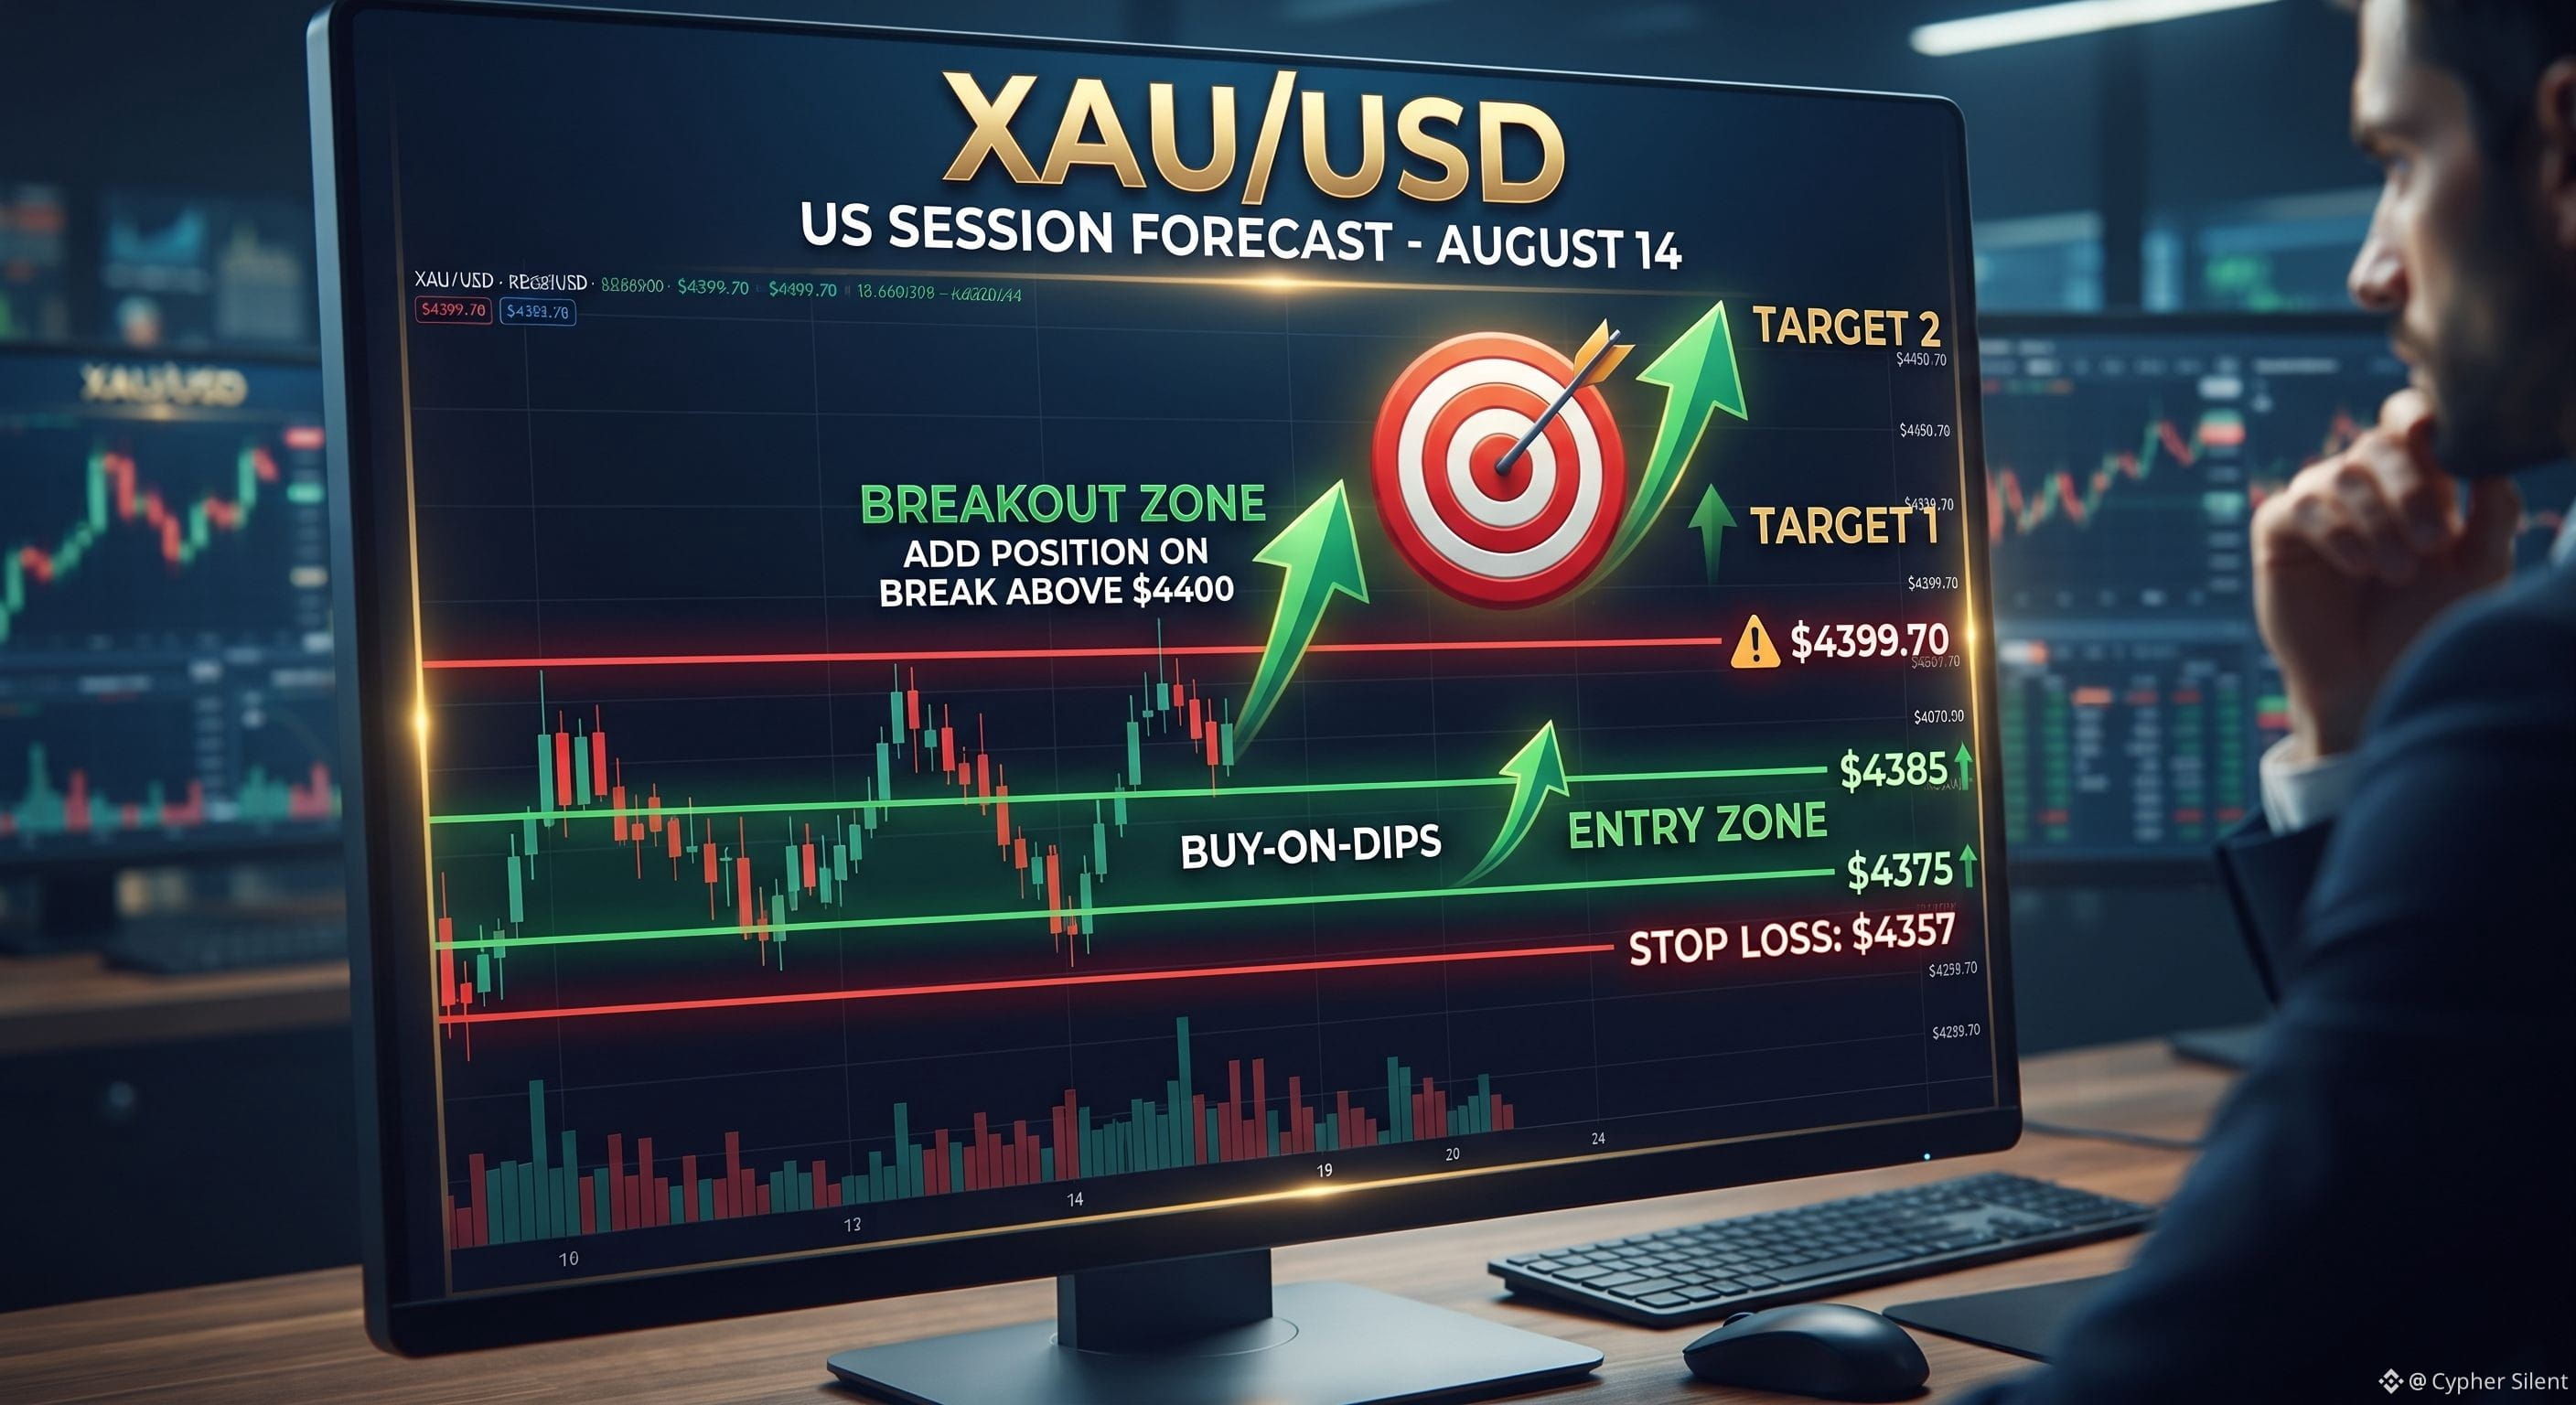
La prévision de la séance US XAUUSDT du 14 août suggère une approche d’achat sur replis. La zone d’entrée se situe entre 4 375 $ et 4 385 $, avec un stop loss à 4 357 $ et des objectifs à 4 419 $ et 4 450 $. Toutefois, la proximité de la résistance à 4 399,70 impose la prudence. Envisagez d’attendre une cassure au-dessus de 4 400 $ avant d’ajouter à vos positions.
#cryptotrading #GOLD #BinanceSquare #TradingSignals #HalalTrading $XAU
{future}(XAUUSDT)
Dois-je acheter ou vendre l’or lors de cette séance US ?
La prévision de la séance US XAUUSDT du 14 août suggère une approche d’achat sur replis. La zone d’entrée se situe entre 4 375 $ et 4 385 $, avec un stop loss à 4 357 $ et des objectifs à 4 419 $ et 4 450 $. Toutefois, la proximité de la résistance à 4 399,70 impose la prudence. Envisagez d’attendre une cassure au-dessus de 4 400 $ avant d’ajouter à vos positions.
#cryptotrading #GOLD #BinanceSquare #TradingSignals #HalalTrading $XAU
La prévision de la séance US XAUUSDT du 14 août suggère une approche d’achat sur replis. La zone d’entrée se situe entre 4 375 $ et 4 385 $, avec un stop loss à 4 357 $ et des objectifs à 4 419 $ et 4 450 $. Toutefois, la proximité de la résistance à 4 399,70 impose la prudence. Envisagez d’attendre une cassure au-dessus de 4 400 $ avant d’ajouter à vos positions.
#cryptotrading #GOLD #BinanceSquare #TradingSignals #HalalTrading $XAU
1
1
107
La prévision de séance US du #XAUUSD du 14 août est haussière, portée par un Dollar américain plus faible et des anticipations de hausse de la Fed qui s’estompent. Le prix évolue au-dessus de toutes les EMA et du VWAP, avec de forts indicateurs de momentum soutenant un mouvement vers 4 419 $ et 4 450 $. Toutefois, la structure baissière du graphique à plus long terme et la proximité de la résistance à 4 399,70 $ incitent à la prudence.
{future}(XAUUSDT)
Le niveau clé à surveiller est 4 400 $. Une cassure décisive au-dessus de ce niveau pourrait déclencher un mouvement vers 4 450 $, tandis qu’un rejet pourrait entraîner un repli vers 4 357 $. Tradez avec discipline, utilisez une gestion rigoureuse du risque et laissez le marché vous indiquer la direction. Prêt à automatiser votre trading sur l’or ?
Notre #Aİ #trading #Bot
"https://investortipster.com/marketplace/product/ai-trading/" peut exécuter cette stratégie 24/7 avec un taux de réussite de 83 % +.
Trader l’or (XAU/USD) comporte un risque important de perte. Ce contenu est fourni à titre informatif uniquement et ne constitue pas un conseil financier. Effectuez toujours vos propres recherches et tradez de manière responsable.
#GOLD_UPDATE
La prévision de séance US du #XAUUSD du 14 août est haussière, portée par un Dollar américain plus faible et des anticipations de hausse de la Fed qui s’estompent. Le prix évolue au-dessus de toutes les EMA et du VWAP, avec de forts indicateurs de momentum soutenant un mouvement vers 4 419 $ et 4 450 $. Toutefois, la structure baissière du graphique à plus long terme et la proximité de la résistance à 4 399,70 $ incitent à la prudence.
Le niveau clé à surveiller est 4 400 $. Une cassure décisive au-dessus de ce niveau pourrait déclencher un mouvement vers 4 450 $, tandis qu’un rejet pourrait entraîner un repli vers 4 357 $. Tradez avec discipline, utilisez une gestion rigoureuse du risque et laissez le marché vous indiquer la direction. Prêt à automatiser votre trading sur l’or ?
Notre #Aİ #trading #Bot
"https://investortipster.com/marketplace/product/ai-trading/" peut exécuter cette stratégie 24/7 avec un taux de réussite de 83 % +.
Trader l’or (XAU/USD) comporte un risque important de perte. Ce contenu est fourni à titre informatif uniquement et ne constitue pas un conseil financier. Effectuez toujours vos propres recherches et tradez de manière responsable.
#GOLD_UPDATE
Le niveau clé à surveiller est 4 400 $. Une cassure décisive au-dessus de ce niveau pourrait déclencher un mouvement vers 4 450 $, tandis qu’un rejet pourrait entraîner un repli vers 4 357 $. Tradez avec discipline, utilisez une gestion rigoureuse du risque et laissez le marché vous indiquer la direction. Prêt à automatiser votre trading sur l’or ?
Notre #Aİ #trading #Bot
"https://investortipster.com/marketplace/product/ai-trading/" peut exécuter cette stratégie 24/7 avec un taux de réussite de 83 % +.
Trader l’or (XAU/USD) comporte un risque important de perte. Ce contenu est fourni à titre informatif uniquement et ne constitue pas un conseil financier. Effectuez toujours vos propres recherches et tradez de manière responsable.
#GOLD_UPDATE

1
1
69

Article
Les Bulls sur l’or visent 4 450 $ tandis que les prévisions de la séance US XAUUSD du 14 août s’inversent à la hausseLes prévisions de la séance US XAUUSD du 14 août vont dans le sens de la hausse, alors que l’or rebondit depuis un plus bas hebdomadaire à 4 311 $, porté par un dollar américain plus faible et par l’atténuation des paris de hausse des taux de la Fed en septembre. Le prix se situe actuellement à 4 384,68, au-dessus de l’empilement des EMAs et du VWAP, avec des indicateurs de momentum qui affichent des signaux haussiers. La cible immédiate est le plus haut du swing H1 à 4 419, avec un objectif plus ambitieux à 4 450. Vous voulez trader automatiquement ce setup sur l’or ? Notre bot de trading IA tourne 24/7 sur XAU/USD avec un taux de réussite de 83 %+.
Aperçu du marché de l’or
Les Bulls sur l’or visent 4 450 $ tandis que les prévisions de la séance US XAUUSD du 14 août s’inversent à la hausse
Les prévisions de la séance US XAUUSD du 14 août vont dans le sens de la hausse, alors que l’or rebondit depuis un plus bas hebdomadaire à 4 311 $, porté par un dollar américain plus faible et par l’atténuation des paris de hausse des taux de la Fed en septembre. Le prix se situe actuellement à 4 384,68, au-dessus de l’empilement des EMAs et du VWAP, avec des indicateurs de momentum qui affichent des signaux haussiers. La cible immédiate est le plus haut du swing H1 à 4 419, avec un objectif plus ambitieux à 4 450. Vous voulez trader automatiquement ce setup sur l’or ? Notre bot de trading IA tourne 24/7 sur XAU/USD avec un taux de réussite de 83 %+.
Aperçu du marché de l’or
Aperçu du marché de l’or
1
1
76
Pourquoi #GOLD
{future}(XAUUSDT)
reste bloqué à 4 400 $ ?
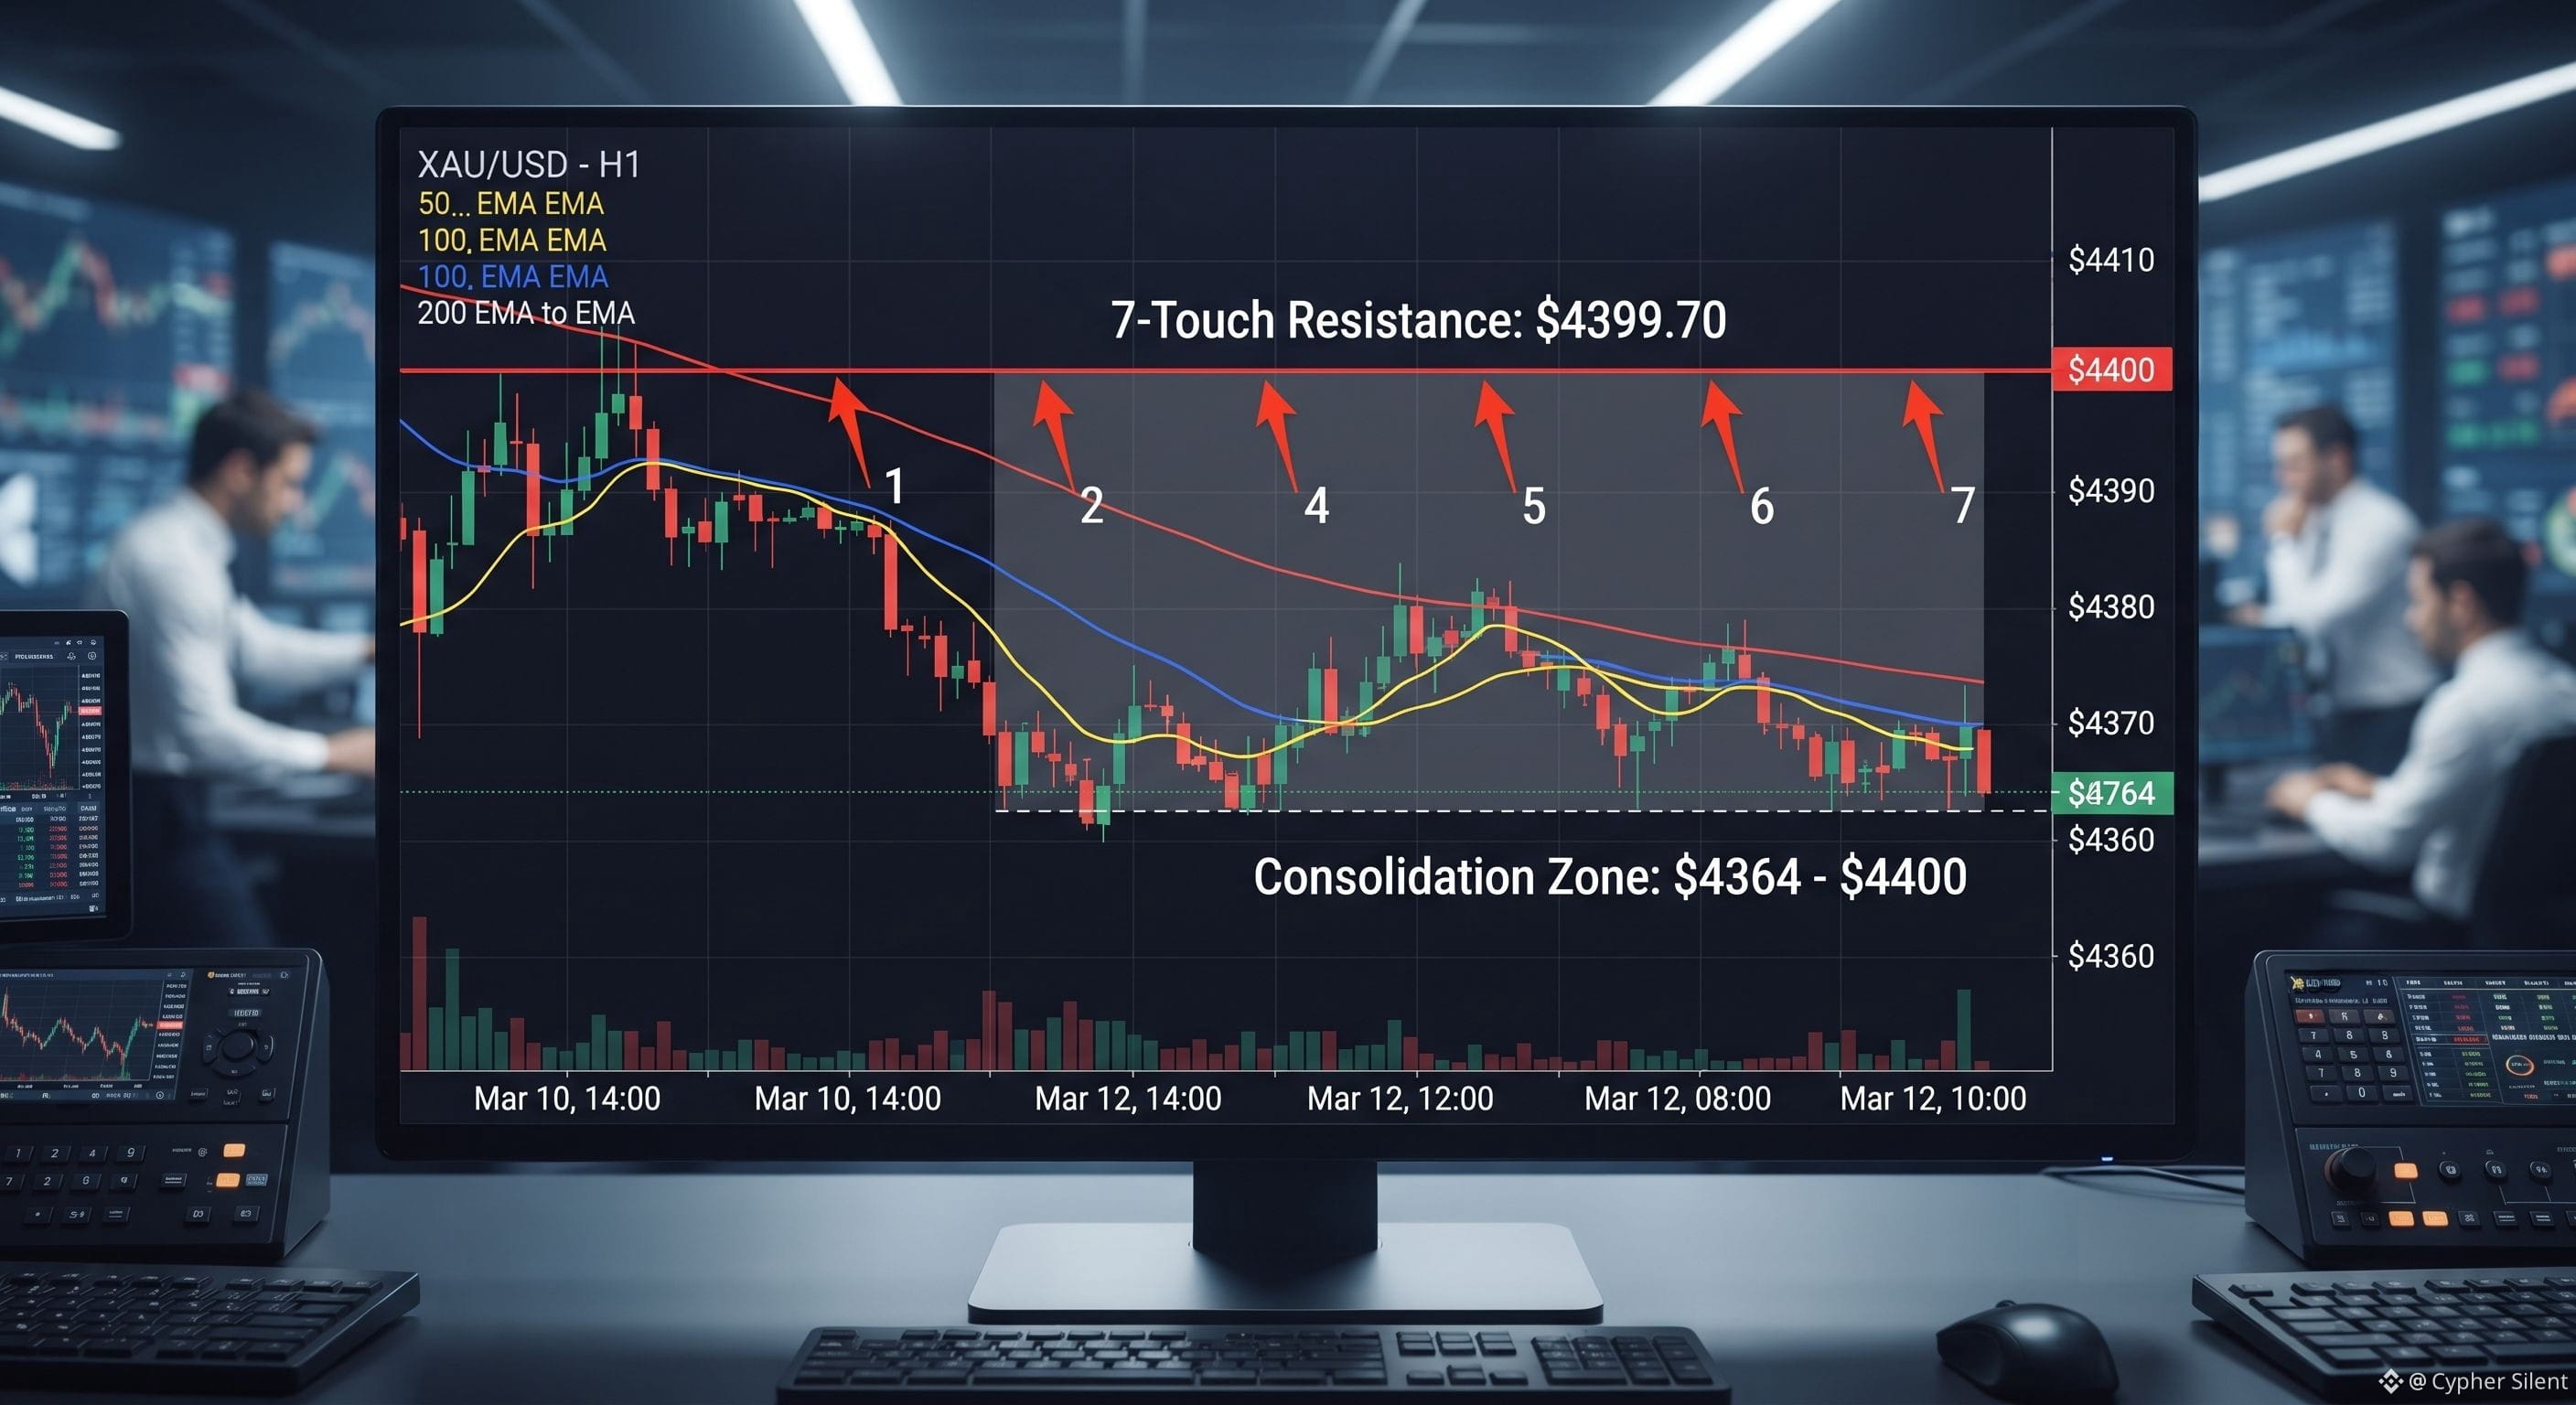
L’or fait face à une résistance de 7 touchpoints à 4 399,70 $, un niveau qui avait auparavant servi de support. Les vendeurs défendent cette zone, et la tendance baissière H1 (le prix est en dessous de toutes les MM) renforce la pression vendeuse. Tant que ce niveau n’est pas dépassé, l’or est susceptible de se consolider entre 4 364 $ et 4 400.$XAU
#HalalTrading #GOLD_UPDATE #GoldenOpportunity
Pourquoi #GOLD
reste bloqué à 4 400 $ ?
L’or fait face à une résistance de 7 touchpoints à 4 399,70 $, un niveau qui avait auparavant servi de support. Les vendeurs défendent cette zone, et la tendance baissière H1 (le prix est en dessous de toutes les MM) renforce la pression vendeuse. Tant que ce niveau n’est pas dépassé, l’or est susceptible de se consolider entre 4 364 $ et 4 400.$XAU
#HalalTrading #GOLD_UPDATE #GoldenOpportunity
reste bloqué à 4 400 $ ?
L’or fait face à une résistance de 7 touchpoints à 4 399,70 $, un niveau qui avait auparavant servi de support. Les vendeurs défendent cette zone, et la tendance baissière H1 (le prix est en dessous de toutes les MM) renforce la pression vendeuse. Tant que ce niveau n’est pas dépassé, l’or est susceptible de se consolider entre 4 364 $ et 4 400.$XAU
#HalalTrading #GOLD_UPDATE #GoldenOpportunity
1
1
74
Prix de l’or aujourd’hui 14 août 2026 Europe : test de rejet à 4 400 $.
{future}(XAUUSDT)
Pour la séance européenne, le setup le plus propre est une vente à découvert sur rejet à 4 399,70 $. Zone d’entrée : 4 395–4 400 $. Stop loss : 4 410 (au-dessus du cluster de résistance). Take profit 1 : 4 363,95 $ (plus bas du swing). Take profit 2 : 4 356,70 $ (pivot S). Cela donne un ratio risque-rendement d’environ 1:2,5 vers le TP1.
Sinon, un trader de cassure pourrait attendre une clôture confirmée au-dessus de 4 400 $ avec un momentum, puis viser 4 419,20 $. Mais vu le fort ADX et la structure baissière, la vente sur rejet est le scénario le plus probable. Pour une exécution automatisée de cette stratégie, envisagez le Price Action Pro EA $XAUT "https://investortipster.com/marketplace/product/price-action-pro/", qui exécute des configurations basées sur le SMC pour #XAUUSD .
Prix de l’or aujourd’hui 14 août 2026 Europe : test de rejet à 4 400 $.
Pour la séance européenne, le setup le plus propre est une vente à découvert sur rejet à 4 399,70 $. Zone d’entrée : 4 395–4 400 $. Stop loss : 4 410 (au-dessus du cluster de résistance). Take profit 1 : 4 363,95 $ (plus bas du swing). Take profit 2 : 4 356,70 $ (pivot S). Cela donne un ratio risque-rendement d’environ 1:2,5 vers le TP1.
Sinon, un trader de cassure pourrait attendre une clôture confirmée au-dessus de 4 400 $ avec un momentum, puis viser 4 419,20 $. Mais vu le fort ADX et la structure baissière, la vente sur rejet est le scénario le plus probable. Pour une exécution automatisée de cette stratégie, envisagez le Price Action Pro EA $XAUT "https://investortipster.com/marketplace/product/price-action-pro/", qui exécute des configurations basées sur le SMC pour #XAUUSD .
Pour la séance européenne, le setup le plus propre est une vente à découvert sur rejet à 4 399,70 $. Zone d’entrée : 4 395–4 400 $. Stop loss : 4 410 (au-dessus du cluster de résistance). Take profit 1 : 4 363,95 $ (plus bas du swing). Take profit 2 : 4 356,70 $ (pivot S). Cela donne un ratio risque-rendement d’environ 1:2,5 vers le TP1.
Sinon, un trader de cassure pourrait attendre une clôture confirmée au-dessus de 4 400 $ avec un momentum, puis viser 4 419,20 $. Mais vu le fort ADX et la structure baissière, la vente sur rejet est le scénario le plus probable. Pour une exécution automatisée de cette stratégie, envisagez le Price Action Pro EA $XAUT "https://investortipster.com/marketplace/product/price-action-pro/", qui exécute des configurations basées sur le SMC pour #XAUUSD .
124

Article
Prix de l’or aujourd’hui 14 août 2026 Europe : test de rejet à 4 400 $Prix de l’or aujourd’hui 14 août 2026 Europe : test de rejet à 4 400 $
Le prix de l’or aujourd’hui 14 août 2026 en Europe suit une ligne de crête à 4 399 $, les vendeurs défendant la zone de résistance des 7 touchers qui a plafonné chaque tentative de rallye cette semaine. Le graphique H1 montre une tendance baissière typique : sommets plus bas, creux plus bas, et le prix évolue sous l’empilement EMA20/50/200. Pourtant, l’élan M15 s’accélère et le marché se trouve en zone de décote. C’est un dilemme classique de la séance européenne : faut-il faire confiance à la structure quotidienne ou au rebond intraday ? La réponse réside dans la manière dont le prix réagit à 4 399,70 $ dans les prochaines heures. Voulez-vous trader cette configuration automatiquement ?
Prix de l’or aujourd’hui 14 août 2026 Europe : test de rejet à 4 400 $
Prix de l’or aujourd’hui 14 août 2026 Europe : test de rejet à 4 400 $
Le prix de l’or aujourd’hui 14 août 2026 en Europe suit une ligne de crête à 4 399 $, les vendeurs défendant la zone de résistance des 7 touchers qui a plafonné chaque tentative de rallye cette semaine. Le graphique H1 montre une tendance baissière typique : sommets plus bas, creux plus bas, et le prix évolue sous l’empilement EMA20/50/200. Pourtant, l’élan M15 s’accélère et le marché se trouve en zone de décote. C’est un dilemme classique de la séance européenne : faut-il faire confiance à la structure quotidienne ou au rebond intraday ? La réponse réside dans la manière dont le prix réagit à 4 399,70 $ dans les prochaines heures. Voulez-vous trader cette configuration automatiquement ?
Le prix de l’or aujourd’hui 14 août 2026 en Europe suit une ligne de crête à 4 399 $, les vendeurs défendant la zone de résistance des 7 touchers qui a plafonné chaque tentative de rallye cette semaine. Le graphique H1 montre une tendance baissière typique : sommets plus bas, creux plus bas, et le prix évolue sous l’empilement EMA20/50/200. Pourtant, l’élan M15 s’accélère et le marché se trouve en zone de décote. C’est un dilemme classique de la séance européenne : faut-il faire confiance à la structure quotidienne ou au rebond intraday ? La réponse réside dans la manière dont le prix réagit à 4 399,70 $ dans les prochaines heures. Voulez-vous trader cette configuration automatiquement ?
117
Article
Prévision du prix de l’or 13 août : défense à 4 063 $ ou cassure à 4 124 $ ?Aperçu du marché du prix de l’or
Au 12 août 2026, à 06h53 UTC, le prix de l’or s’échange à 4 401,70 $ par once troy. Le ton des premières heures est prudent : XAU/USD a du mal à prendre de l’élan au-dessus du seuil des 4 400 $. Les traders attendent de voir si la liquidité de New York confirmera une direction ou si elle prolongera simplement la dérive observée durant la nuit.
La force du dollar continue d’agir comme un frein pour les métaux précieux. Le billet vert a trouvé preneur face au franc suisse, et cela limite souvent le potentiel de hausse de l’or à court terme. Quand le dollar bénéficie d’une demande, l’or a tendance à perdre un peu de son attrait “valeur refuge” pour les acheteurs non américains.
Prévision du prix de l’or 13 août : défense à 4 063 $ ou cassure à 4 124 $ ?
Aperçu du marché du prix de l’or
Au 12 août 2026, à 06h53 UTC, le prix de l’or s’échange à 4 401,70 $ par once troy. Le ton des premières heures est prudent : XAU/USD a du mal à prendre de l’élan au-dessus du seuil des 4 400 $. Les traders attendent de voir si la liquidité de New York confirmera une direction ou si elle prolongera simplement la dérive observée durant la nuit.
La force du dollar continue d’agir comme un frein pour les métaux précieux. Le billet vert a trouvé preneur face au franc suisse, et cela limite souvent le potentiel de hausse de l’or à court terme. Quand le dollar bénéficie d’une demande, l’or a tendance à perdre un peu de son attrait “valeur refuge” pour les acheteurs non américains.
Au 12 août 2026, à 06h53 UTC, le prix de l’or s’échange à 4 401,70 $ par once troy. Le ton des premières heures est prudent : XAU/USD a du mal à prendre de l’élan au-dessus du seuil des 4 400 $. Les traders attendent de voir si la liquidité de New York confirmera une direction ou si elle prolongera simplement la dérive observée durant la nuit.
La force du dollar continue d’agir comme un frein pour les métaux précieux. Le billet vert a trouvé preneur face au franc suisse, et cela limite souvent le potentiel de hausse de l’or à court terme. Quand le dollar bénéficie d’une demande, l’or a tendance à perdre un peu de son attrait “valeur refuge” pour les acheteurs non américains.
64
Analyse technique
Structure des moyennes mobiles
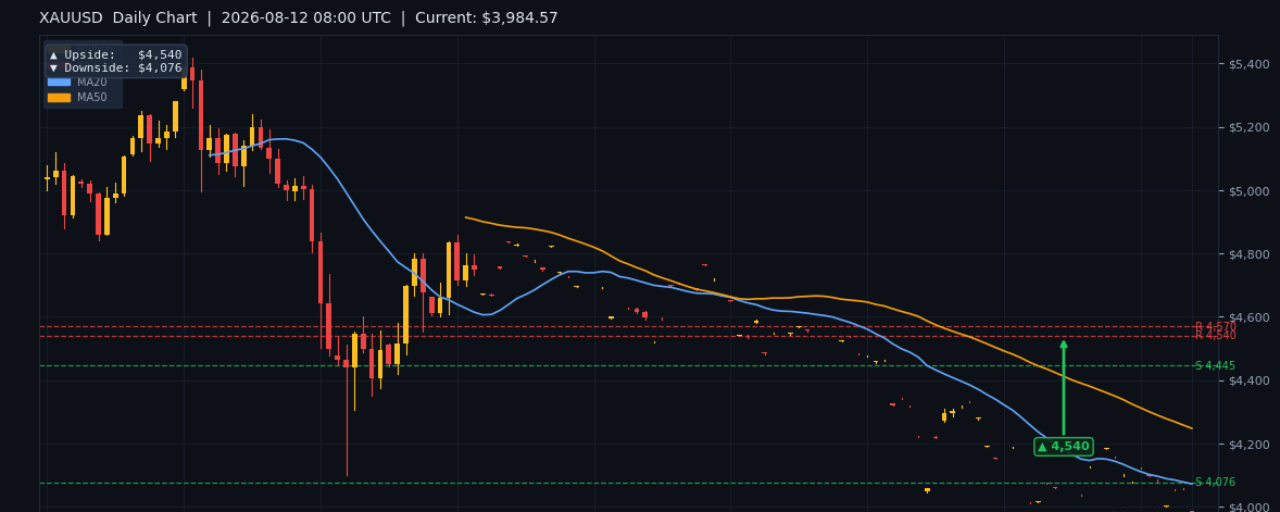
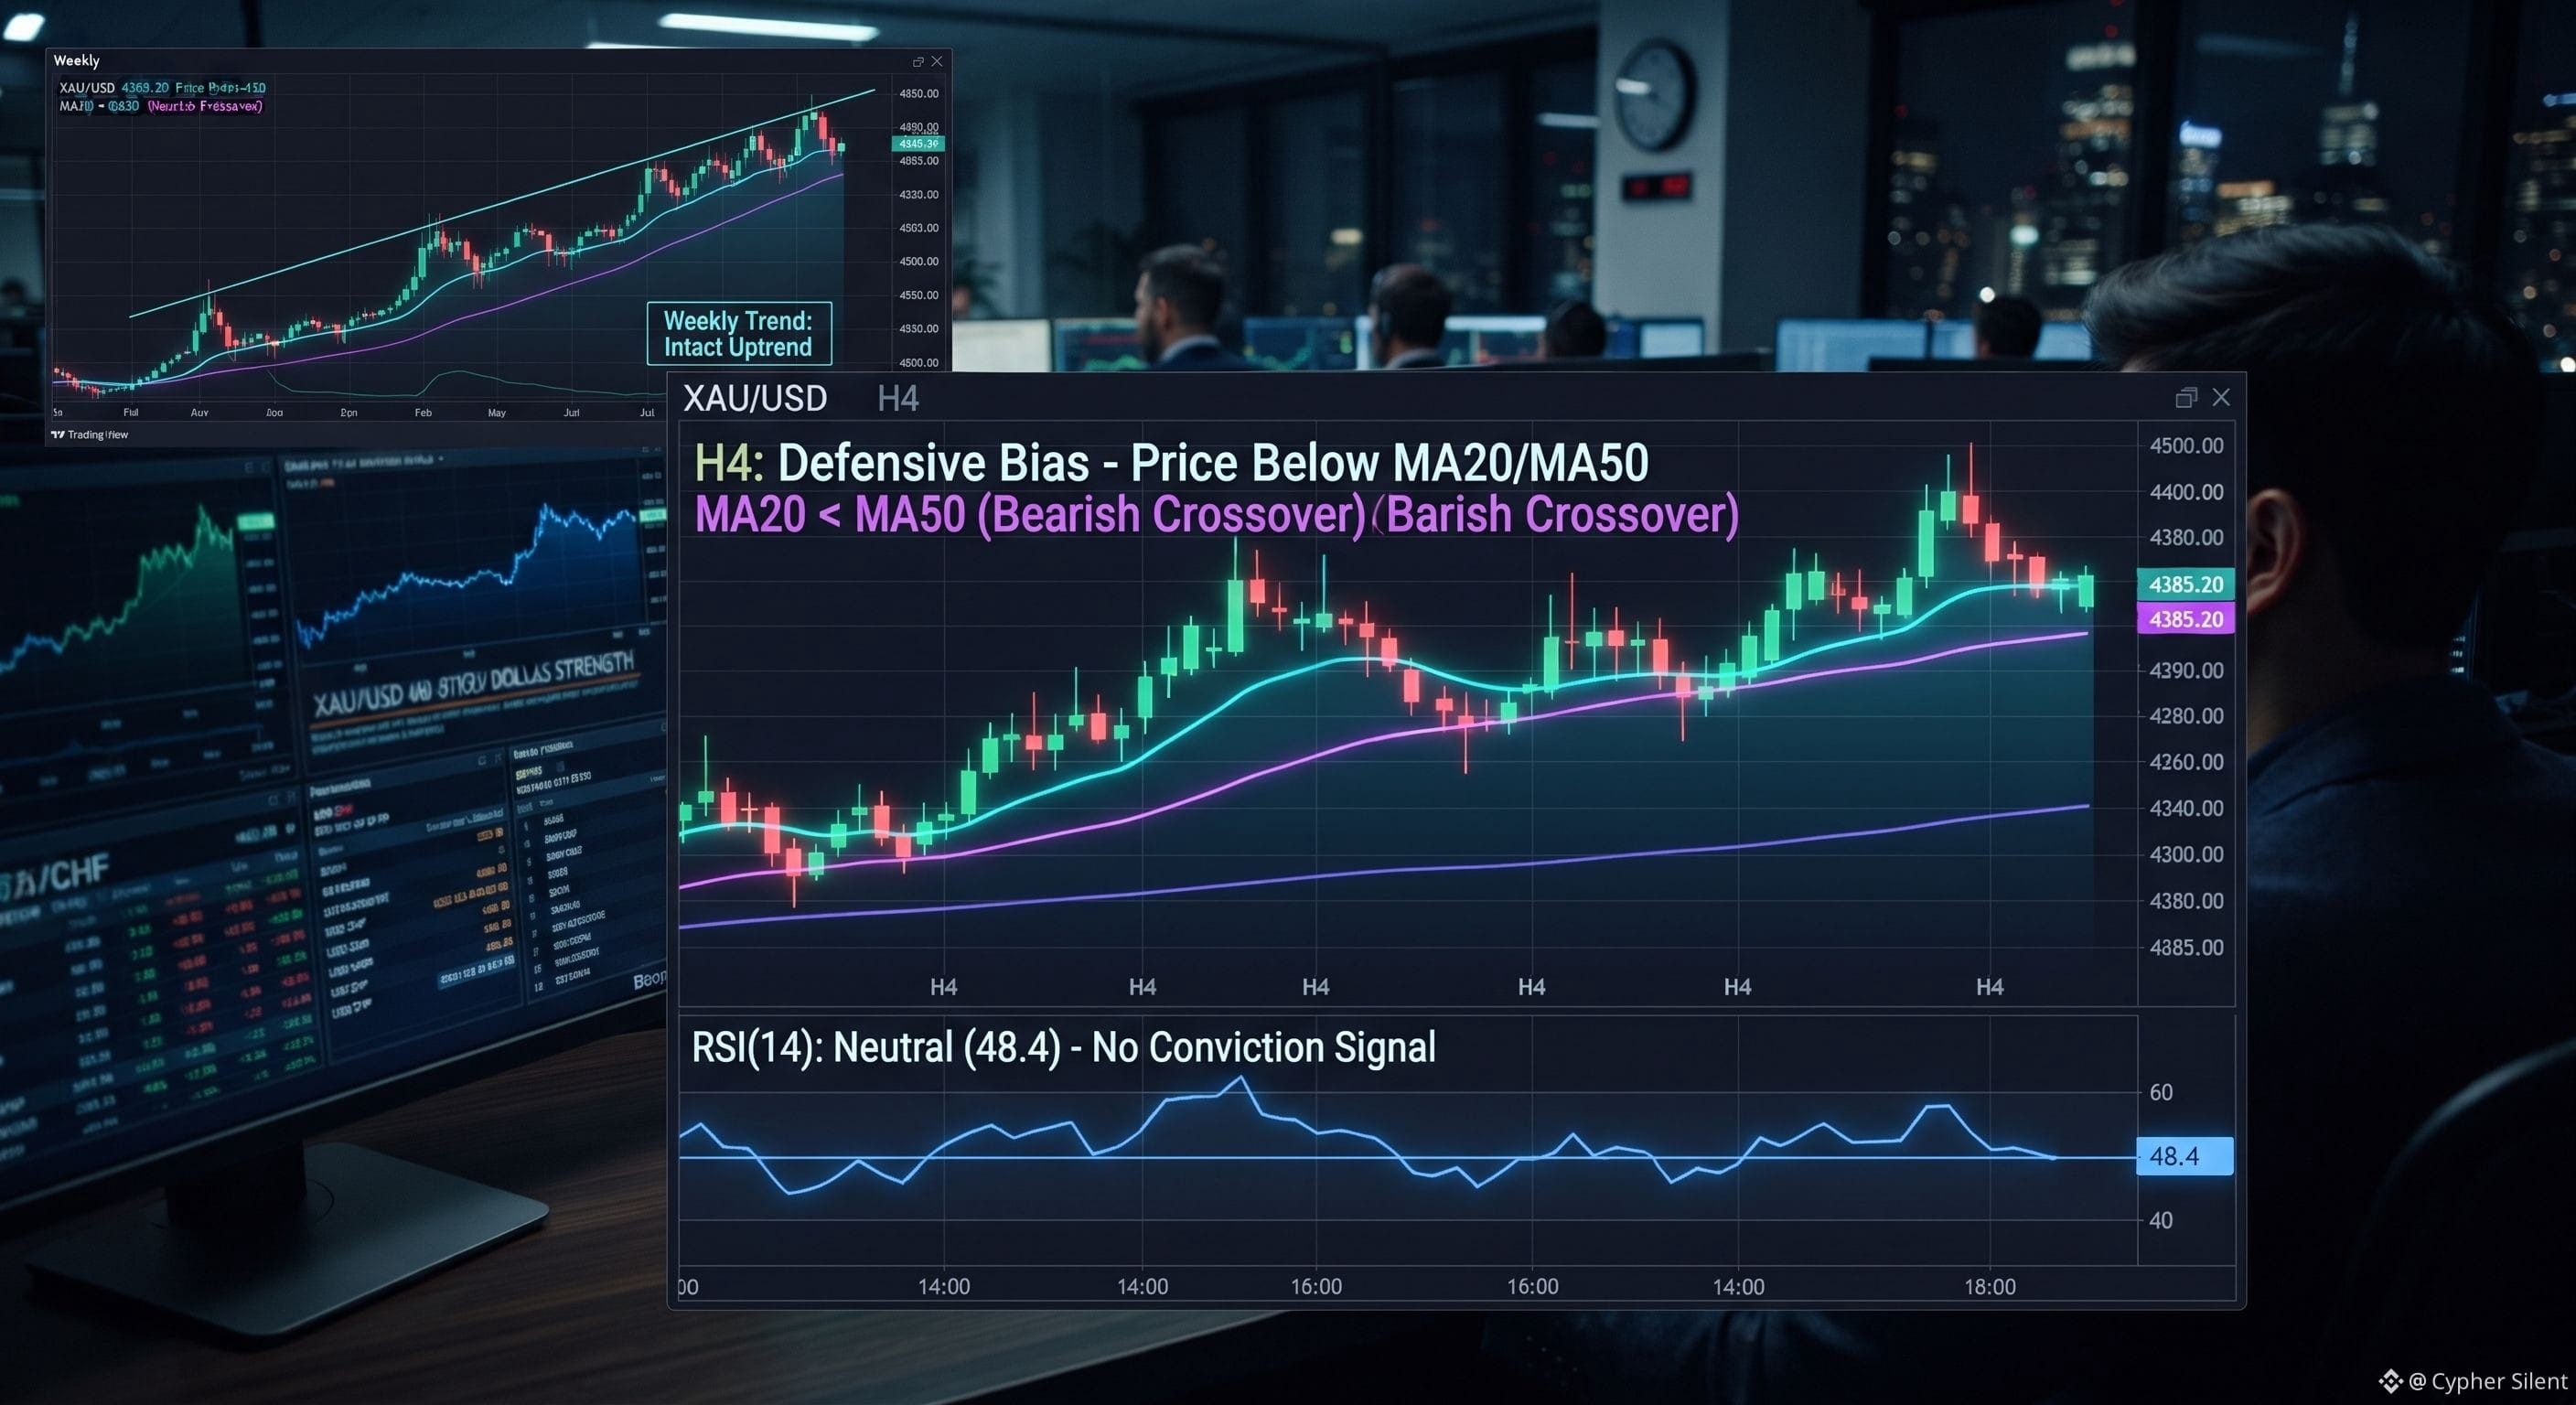
Le graphique H4 montre le prix de l’or en dessous de ses moyennes mobiles à courte durée, ce qui maintient une tendance à court terme défensive. Les MA20 et MA50 agissent désormais comme une résistance dynamique au-dessus du spot. Tant que #XAU/USD ne parvient pas à reprendre ce groupe, les hausses risquent d’être vendues.
La structure de l’EMA renforce également cette lecture. Lorsque la MA20 se situe sous la MA50, l’élan à court terme travaille encore contre les acheteurs. Cela ne garantit pas un repli plus profond, mais cela signifie que chaque rebond doit faire ses preuves.
Sur des horizons plus élevés, la perspective est plus constructive. La tendance hebdomadaire reste intacte : les investisseurs à plus long terme peuvent donc considérer les replis comme des opportunités plutôt que comme une raison de paniquer. L’enjeu est de savoir sur quel intervalle de temps vous tradez.
{future}(XAUUSDT)
#RSI et #momentum
Le RSI(14) sur le graphique H4 évolue près du milieu de sa fourchette. Cela laisse de la marge au prix de l’or pour évoluer dans les deux sens sans être suracheté ni survendu. Cela signifie aussi que l’indicateur ne signale pas encore un signal de retournement très convaincant.
Les traders orientés momentum devraient surveiller un RSI qui repasse au-dessus de 50 en parallèle avec une reconquête du groupe de moyennes mobiles par le prix. Si le RSI reste sous 50 pendant que le prix reteste la résistance, le rebond pourrait être de courte durée. Un mouvement combiné des deux aurait plus de poids.
À l’inverse, une baisse du RSI vers 40 ou moins indiquerait que les vendeurs prennent le contrôle. Cela pourrait déclencher un mouvement vers la prochaine zone de support significative. #indicator devient plus utile lorsqu’il s’aligne avec l’évolution des prix, et non lorsqu’il est utilisé isolément. #EthereumFoundationDropsPoseidonForL1
Analyse technique
Structure des moyennes mobiles
Le graphique H4 montre le prix de l’or en dessous de ses moyennes mobiles à courte durée, ce qui maintient une tendance à court terme défensive. Les MA20 et MA50 agissent désormais comme une résistance dynamique au-dessus du spot. Tant que #XAU/USD ne parvient pas à reprendre ce groupe, les hausses risquent d’être vendues.
La structure de l’EMA renforce également cette lecture. Lorsque la MA20 se situe sous la MA50, l’élan à court terme travaille encore contre les acheteurs. Cela ne garantit pas un repli plus profond, mais cela signifie que chaque rebond doit faire ses preuves.
Sur des horizons plus élevés, la perspective est plus constructive. La tendance hebdomadaire reste intacte : les investisseurs à plus long terme peuvent donc considérer les replis comme des opportunités plutôt que comme une raison de paniquer. L’enjeu est de savoir sur quel intervalle de temps vous tradez.
#RSI et #momentum
Le RSI(14) sur le graphique H4 évolue près du milieu de sa fourchette. Cela laisse de la marge au prix de l’or pour évoluer dans les deux sens sans être suracheté ni survendu. Cela signifie aussi que l’indicateur ne signale pas encore un signal de retournement très convaincant.
Les traders orientés momentum devraient surveiller un RSI qui repasse au-dessus de 50 en parallèle avec une reconquête du groupe de moyennes mobiles par le prix. Si le RSI reste sous 50 pendant que le prix reteste la résistance, le rebond pourrait être de courte durée. Un mouvement combiné des deux aurait plus de poids.
À l’inverse, une baisse du RSI vers 40 ou moins indiquerait que les vendeurs prennent le contrôle. Cela pourrait déclencher un mouvement vers la prochaine zone de support significative. #indicator devient plus utile lorsqu’il s’aligne avec l’évolution des prix, et non lorsqu’il est utilisé isolément. #EthereumFoundationDropsPoseidonForL1
Structure des moyennes mobiles
Le graphique H4 montre le prix de l’or en dessous de ses moyennes mobiles à courte durée, ce qui maintient une tendance à court terme défensive. Les MA20 et MA50 agissent désormais comme une résistance dynamique au-dessus du spot. Tant que #XAU/USD ne parvient pas à reprendre ce groupe, les hausses risquent d’être vendues.
La structure de l’EMA renforce également cette lecture. Lorsque la MA20 se situe sous la MA50, l’élan à court terme travaille encore contre les acheteurs. Cela ne garantit pas un repli plus profond, mais cela signifie que chaque rebond doit faire ses preuves.
Sur des horizons plus élevés, la perspective est plus constructive. La tendance hebdomadaire reste intacte : les investisseurs à plus long terme peuvent donc considérer les replis comme des opportunités plutôt que comme une raison de paniquer. L’enjeu est de savoir sur quel intervalle de temps vous tradez.
#RSI et #momentum
Le RSI(14) sur le graphique H4 évolue près du milieu de sa fourchette. Cela laisse de la marge au prix de l’or pour évoluer dans les deux sens sans être suracheté ni survendu. Cela signifie aussi que l’indicateur ne signale pas encore un signal de retournement très convaincant.
Les traders orientés momentum devraient surveiller un RSI qui repasse au-dessus de 50 en parallèle avec une reconquête du groupe de moyennes mobiles par le prix. Si le RSI reste sous 50 pendant que le prix reteste la résistance, le rebond pourrait être de courte durée. Un mouvement combiné des deux aurait plus de poids.
À l’inverse, une baisse du RSI vers 40 ou moins indiquerait que les vendeurs prennent le contrôle. Cela pourrait déclencher un mouvement vers la prochaine zone de support significative. #indicator devient plus utile lorsqu’il s’aligne avec l’évolution des prix, et non lorsqu’il est utilisé isolément. #EthereumFoundationDropsPoseidonForL1
1
1
129
Aperçu du marché du prix de l’or
Au 12 août 2026, à 06:53 UTC,
{future}(XAUUSDT)
t le prix #GOLD s’échange à 4 401,70 $ par once troy. Le ton de la séance matinale reste prudent : XAU/USD a du mal à reprendre de l’élan au-dessus de la barre des 4 400. #traders attendent de voir si New York #liquidity confirmera une direction ou prolongera simplement la dérive de la nuit.
La vigueur du dollar continue d’agir comme un vent contraire pour les métaux précieux. Le dollar a trouvé des acheteurs face au franc suisse, ce qui limite souvent la hausse de l’or à court terme. Lorsque le dollar se reprend, l’or a tendance à perdre une partie de son attrait de valeur refuge pour les acheteurs hors États-Unis.
Cela dit, la situation globale n’est pas baissière. Le prix de l’or demeure dans une tendance haussière de plus long terme sur le graphique hebdomadaire ; ce repli ressemble donc davantage à une consolidation normale qu’à une rupture structurelle. Cette distinction est importante car elle modifie la manière dont les traders devraient aborder les replis.
#USDT #forextrader
Aperçu du marché du prix de l’or
Au 12 août 2026, à 06:53 UTC,
t le prix #GOLD s’échange à 4 401,70 $ par once troy. Le ton de la séance matinale reste prudent : XAU/USD a du mal à reprendre de l’élan au-dessus de la barre des 4 400. #traders attendent de voir si New York #liquidity confirmera une direction ou prolongera simplement la dérive de la nuit.
La vigueur du dollar continue d’agir comme un vent contraire pour les métaux précieux. Le dollar a trouvé des acheteurs face au franc suisse, ce qui limite souvent la hausse de l’or à court terme. Lorsque le dollar se reprend, l’or a tendance à perdre une partie de son attrait de valeur refuge pour les acheteurs hors États-Unis.
Cela dit, la situation globale n’est pas baissière. Le prix de l’or demeure dans une tendance haussière de plus long terme sur le graphique hebdomadaire ; ce repli ressemble donc davantage à une consolidation normale qu’à une rupture structurelle. Cette distinction est importante car elle modifie la manière dont les traders devraient aborder les replis.
#USDT #forextrader
Au 12 août 2026, à 06:53 UTC,
t le prix #GOLD s’échange à 4 401,70 $ par once troy. Le ton de la séance matinale reste prudent : XAU/USD a du mal à reprendre de l’élan au-dessus de la barre des 4 400. #traders attendent de voir si New York #liquidity confirmera une direction ou prolongera simplement la dérive de la nuit.
La vigueur du dollar continue d’agir comme un vent contraire pour les métaux précieux. Le dollar a trouvé des acheteurs face au franc suisse, ce qui limite souvent la hausse de l’or à court terme. Lorsque le dollar se reprend, l’or a tendance à perdre une partie de son attrait de valeur refuge pour les acheteurs hors États-Unis.
Cela dit, la situation globale n’est pas baissière. Le prix de l’or demeure dans une tendance haussière de plus long terme sur le graphique hebdomadaire ; ce repli ressemble donc davantage à une consolidation normale qu’à une rupture structurelle. Cette distinction est importante car elle modifie la manière dont les traders devraient aborder les replis.
#USDT #forextrader

1
1
138
Qu’en pensez-vous ? 🤔🤔
Qu’en pensez-vous ? 🤔🤔
Cypher Silent
·
--
Les données de l’IPC (PPI) vont-elles impacter les prix de l’or aujourd’hui ?
Oui, les publications du Core PPI et du PPI prévues plus tard dans la journée sont les principaux catalyseurs de l’or. Un chiffre plus faible pourrait affaiblir le dollar et soutenir l’or, tandis qu’une lecture plus chaude renforcerait les attentes de hausse de la Fed et ferait probablement baisser les prix. Le marché intègre actuellement une lecture du core PPI de 0,3 %.
#USJulyCPI&PPIDueThisWeek #goldtrading #TradingSignal #forextrading $XAU
Oui, les publications du Core PPI et du PPI prévues plus tard dans la journée sont les principaux catalyseurs de l’or. Un chiffre plus faible pourrait affaiblir le dollar et soutenir l’or, tandis qu’une lecture plus chaude renforcerait les attentes de hausse de la Fed et ferait probablement baisser les prix. Le marché intègre actuellement une lecture du core PPI de 0,3 %.
#USJulyCPI&PPIDueThisWeek #goldtrading #TradingSignal #forextrading $XAU
17
Les données de l’IPC (PPI) vont-elles impacter les prix de l’or aujourd’hui ?
Oui, les publications du Core PPI et du PPI prévues plus tard dans la journée sont les principaux catalyseurs de l’or. Un chiffre plus faible pourrait affaiblir le dollar et soutenir l’or, tandis qu’une lecture plus chaude renforcerait les attentes de hausse de la Fed et ferait probablement baisser les prix. Le marché intègre actuellement une lecture du core PPI de 0,3 %.
#USJulyCPI&PPIDueThisWeek #goldtrading #TradingSignal #forextrading $XAU
Les données de l’IPC (PPI) vont-elles impacter les prix de l’or aujourd’hui ?
Oui, les publications du Core PPI et du PPI prévues plus tard dans la journée sont les principaux catalyseurs de l’or. Un chiffre plus faible pourrait affaiblir le dollar et soutenir l’or, tandis qu’une lecture plus chaude renforcerait les attentes de hausse de la Fed et ferait probablement baisser les prix. Le marché intègre actuellement une lecture du core PPI de 0,3 %.
#USJulyCPI&PPIDueThisWeek #goldtrading #TradingSignal #forextrading $XAU
Oui, les publications du Core PPI et du PPI prévues plus tard dans la journée sont les principaux catalyseurs de l’or. Un chiffre plus faible pourrait affaiblir le dollar et soutenir l’or, tandis qu’une lecture plus chaude renforcerait les attentes de hausse de la Fed et ferait probablement baisser les prix. Le marché intègre actuellement une lecture du core PPI de 0,3 %.
#USJulyCPI&PPIDueThisWeek #goldtrading #TradingSignal #forextrading $XAU
1
157
#USJulyCPI&PPIDueThisWeek #GOLD_UPDATE #forextrading #GoldenLionSignal
Prévision de la séance asiatique XAUUSD 13 août : objectif 4 560 $
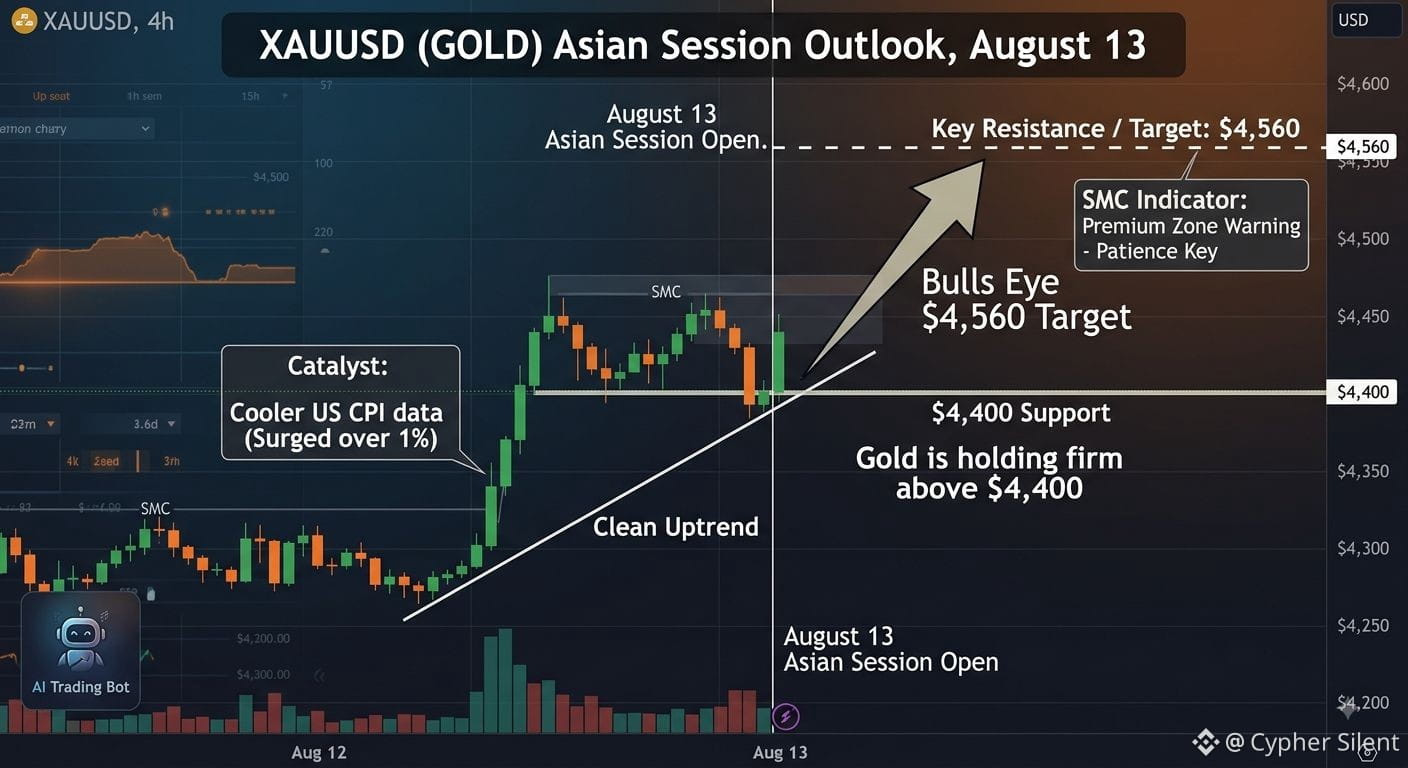
L’or reste solide au-dessus de 4 400 $ à l’ouverture de la séance asiatique, et la prévision pour la séance XAUUSD du 13 août indique un potentiel de hausse supplémentaire vers 4 560 $. Le métal a bondi de plus de 1 % après des données US CPI plus fraîches, tandis que le graphique journalier montre une tendance haussière nette, sans résistance historique apparente au-dessus. Pour les traders, il s’agit d’un schéma classique de continuation de momentum — mais l’avertissement de zone premium de l’indicateur SMC suggère qu’il faut faire preuve de patience. Vous voulez trader automatiquement cette configuration sur l’or ? Notre Bot de Trading IA fonctionne 24 h/24 et 7 j/7 sur XAU/USD avec un taux de réussite de 83 %+.
#USJulyCPI&PPIDueThisWeek #GOLD_UPDATE #forextrading #GoldenLionSignal
Prévision de la séance asiatique XAUUSD 13 août : objectif 4 560 $
L’or reste solide au-dessus de 4 400 $ à l’ouverture de la séance asiatique, et la prévision pour la séance XAUUSD du 13 août indique un potentiel de hausse supplémentaire vers 4 560 $. Le métal a bondi de plus de 1 % après des données US CPI plus fraîches, tandis que le graphique journalier montre une tendance haussière nette, sans résistance historique apparente au-dessus. Pour les traders, il s’agit d’un schéma classique de continuation de momentum — mais l’avertissement de zone premium de l’indicateur SMC suggère qu’il faut faire preuve de patience. Vous voulez trader automatiquement cette configuration sur l’or ? Notre Bot de Trading IA fonctionne 24 h/24 et 7 j/7 sur XAU/USD avec un taux de réussite de 83 %+.
Prévision de la séance asiatique XAUUSD 13 août : objectif 4 560 $
L’or reste solide au-dessus de 4 400 $ à l’ouverture de la séance asiatique, et la prévision pour la séance XAUUSD du 13 août indique un potentiel de hausse supplémentaire vers 4 560 $. Le métal a bondi de plus de 1 % après des données US CPI plus fraîches, tandis que le graphique journalier montre une tendance haussière nette, sans résistance historique apparente au-dessus. Pour les traders, il s’agit d’un schéma classique de continuation de momentum — mais l’avertissement de zone premium de l’indicateur SMC suggère qu’il faut faire preuve de patience. Vous voulez trader automatiquement cette configuration sur l’or ? Notre Bot de Trading IA fonctionne 24 h/24 et 7 j/7 sur XAU/USD avec un taux de réussite de 83 %+.
1
2
215
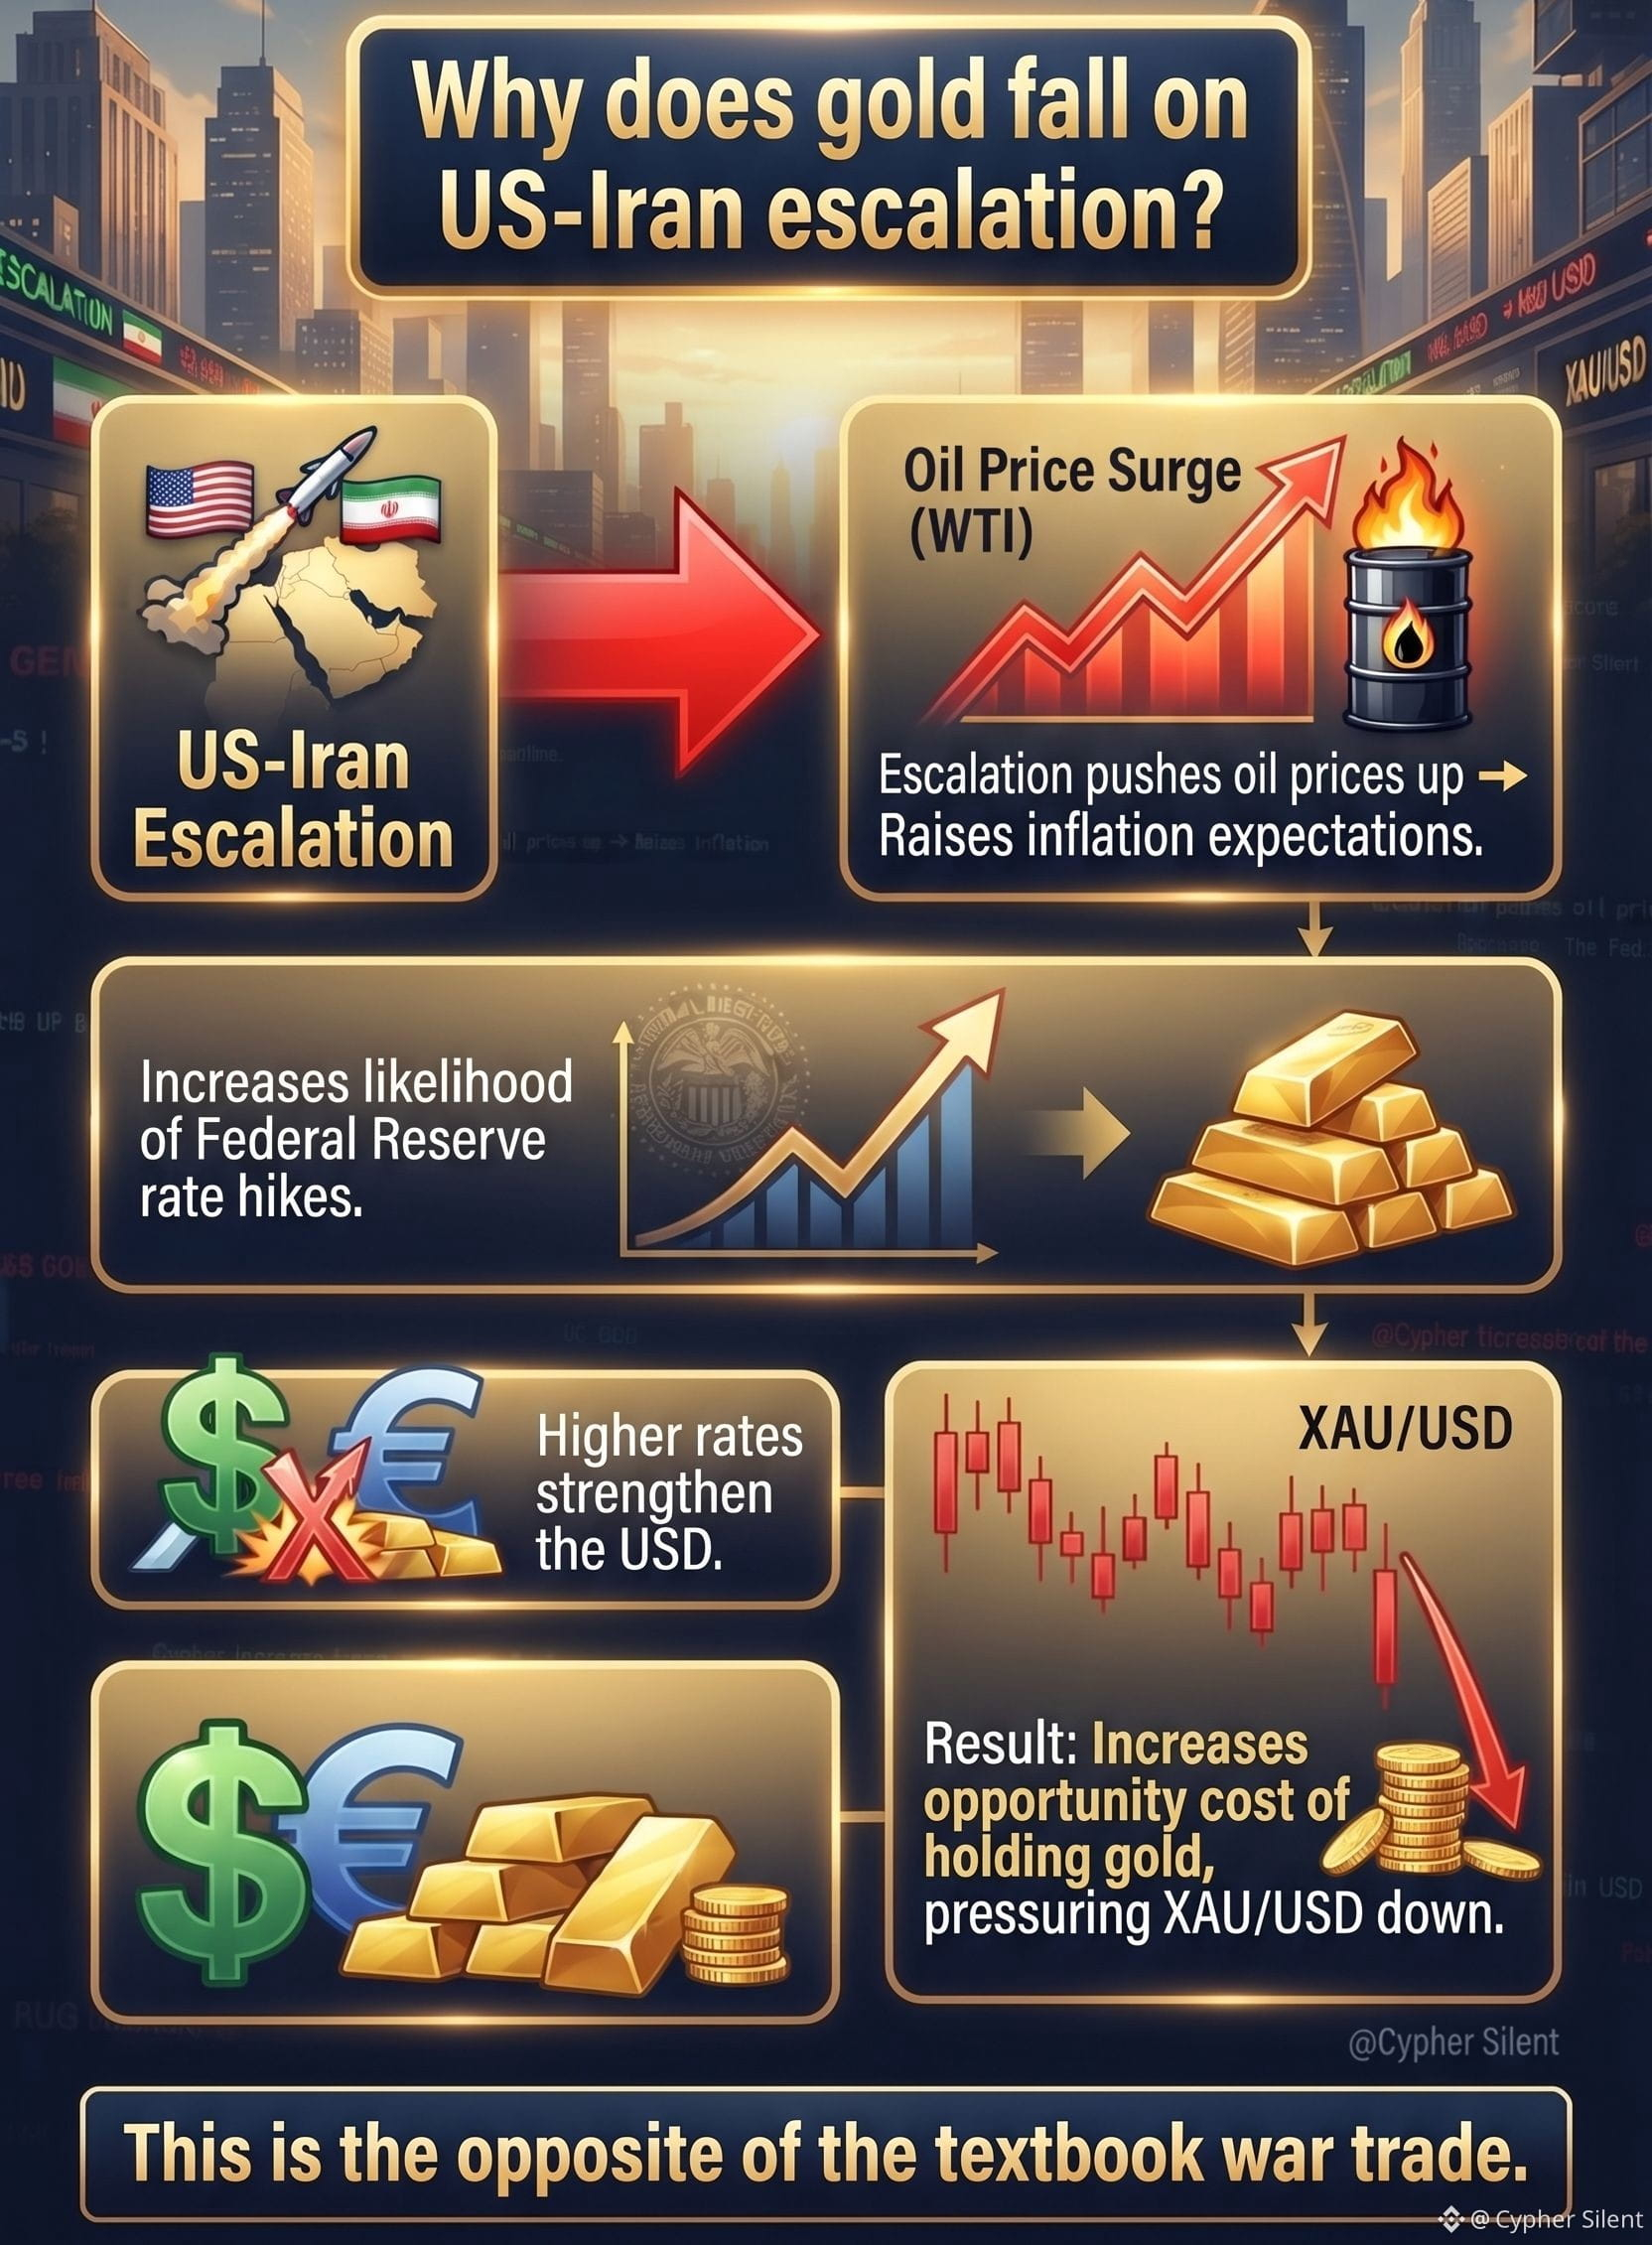
Pourquoi l’or baisse lors de l’escalade entre les États-Unis et l’Iran ?
L’escalade fait monter les prix du pétrole, ce qui accroît les anticipations d’inflation et augmente la probabilité de hausses des taux de la Réserve fédérale. Des taux plus élevés renforcent le dollar et augmentent le coût d’opportunité de détenir de l’or, ce qui exerce une pression à la baisse sur #XAU /#usd . #USJulyCPI&PPIDueThisWeek #XUAT #GOLD
{future}(XAUUSDT)
{future}(XAUTUSDT)
Pourquoi l’or baisse lors de l’escalade entre les États-Unis et l’Iran ?
L’escalade fait monter les prix du pétrole, ce qui accroît les anticipations d’inflation et augmente la probabilité de hausses des taux de la Réserve fédérale. Des taux plus élevés renforcent le dollar et augmentent le coût d’opportunité de détenir de l’or, ce qui exerce une pression à la baisse sur #XAU /#usd . #USJulyCPI&PPIDueThisWeek #XUAT #GOLD
L’escalade fait monter les prix du pétrole, ce qui accroît les anticipations d’inflation et augmente la probabilité de hausses des taux de la Réserve fédérale. Des taux plus élevés renforcent le dollar et augmentent le coût d’opportunité de détenir de l’or, ce qui exerce une pression à la baisse sur #XAU /#usd . #USJulyCPI&PPIDueThisWeek #XUAT #GOLD
1
160
L’or est-il un refuge sûr pendant le conflit américano-iranien ?
VOIR PLUS :: investortipster.com & smartgoldtrade.com
#BinanceSquare #XAU #USJulyCPI&PPIDueThisWeek #GOLD #goldtrading
Dans ce conflit, l’or a réagi plus favorablement aux titres de paix qu’aux titres de guerre. La dynamique du dollar et du pétrole a pris le dessus sur la demande traditionnelle de valeurs refuges. Les traders devraient se concentrer sur la corrélation pétrole-dollar-or plutôt que de supposer qu’une guerre entraîne automatiquement une hausse de l’or.
L’or est-il un refuge sûr pendant le conflit américano-iranien ?
VOIR PLUS :: investortipster.com & smartgoldtrade.com
#BinanceSquare #XAU #USJulyCPI&PPIDueThisWeek #GOLD #goldtrading
Dans ce conflit, l’or a réagi plus favorablement aux titres de paix qu’aux titres de guerre. La dynamique du dollar et du pétrole a pris le dessus sur la demande traditionnelle de valeurs refuges. Les traders devraient se concentrer sur la corrélation pétrole-dollar-or plutôt que de supposer qu’une guerre entraîne automatiquement une hausse de l’or.
VOIR PLUS :: investortipster.com & smartgoldtrade.com
#BinanceSquare #XAU #USJulyCPI&PPIDueThisWeek #GOLD #goldtrading
Dans ce conflit, l’or a réagi plus favorablement aux titres de paix qu’aux titres de guerre. La dynamique du dollar et du pétrole a pris le dessus sur la demande traditionnelle de valeurs refuges. Les traders devraient se concentrer sur la corrélation pétrole-dollar-or plutôt que de supposer qu’une guerre entraîne automatiquement une hausse de l’or.

2
116

Mouvement du prix de l’XAU par rapport au dollar (USD) – ouverture de Londres le 12 août : objectif taureau 4 477 $
Le scénario haussier est clair, mais l’angle contrarien mérite d’être pris en compte. Price Action V3 a signalé une cassure de tendance avec un SELL à 4 406,355 $ et un stop à 4 436,355 $. Cela entre en conflit avec la structure haussière des horizons supérieurs, et l’historique montre qu’il a récemment été perdant de trader à contre-courant de la tendance H1/H4/D1 — les deux pertes précédentes étaient des SELL dans un marché haussier.
Cependant, une annonce chaude de l’IPC (CPI) pourrait invalider rapidement la thèse haussière. Si le CPI hors variation (core) ressort au-dessus de 0,3 %, l’or pourrait chuter en traversant le support à 4 399,70 $ et tester le pivot à 4 371,84 $. Le niveau de renversement clé à surveiller est une clôture quotidienne en dessous de 4 386,53 $, l’EMA50 sur H1. Tant que cela ne se produit pas, le chemin de moindre résistance reste à la hausse.
#XAU #XAUUSD #forex #forextrading
Mouvement du prix de l’XAU par rapport au dollar (USD) – ouverture de Londres le 12 août : objectif taureau 4 477 $
Le scénario haussier est clair, mais l’angle contrarien mérite d’être pris en compte. Price Action V3 a signalé une cassure de tendance avec un SELL à 4 406,355 $ et un stop à 4 436,355 $. Cela entre en conflit avec la structure haussière des horizons supérieurs, et l’historique montre qu’il a récemment été perdant de trader à contre-courant de la tendance H1/H4/D1 — les deux pertes précédentes étaient des SELL dans un marché haussier.
Cependant, une annonce chaude de l’IPC (CPI) pourrait invalider rapidement la thèse haussière. Si le CPI hors variation (core) ressort au-dessus de 0,3 %, l’or pourrait chuter en traversant le support à 4 399,70 $ et tester le pivot à 4 371,84 $. Le niveau de renversement clé à surveiller est une clôture quotidienne en dessous de 4 386,53 $, l’EMA50 sur H1. Tant que cela ne se produit pas, le chemin de moindre résistance reste à la hausse.
#XAU #XAUUSD #forex #forextrading
Le scénario haussier est clair, mais l’angle contrarien mérite d’être pris en compte. Price Action V3 a signalé une cassure de tendance avec un SELL à 4 406,355 $ et un stop à 4 436,355 $. Cela entre en conflit avec la structure haussière des horizons supérieurs, et l’historique montre qu’il a récemment été perdant de trader à contre-courant de la tendance H1/H4/D1 — les deux pertes précédentes étaient des SELL dans un marché haussier.
Cependant, une annonce chaude de l’IPC (CPI) pourrait invalider rapidement la thèse haussière. Si le CPI hors variation (core) ressort au-dessus de 0,3 %, l’or pourrait chuter en traversant le support à 4 399,70 $ et tester le pivot à 4 371,84 $. Le niveau de renversement clé à surveiller est une clôture quotidienne en dessous de 4 386,53 $, l’EMA50 sur H1. Tant que cela ne se produit pas, le chemin de moindre résistance reste à la hausse.
#XAU #XAUUSD #forex #forextrading

1
150
Mouvement du prix XAU USD le 12 août à l’ouverture de Londres : objectif taureau à 4 477 $
Le mouvement du prix XAU USD du 12 août à l’ouverture de Londres révèle une structure haussière nette sur plusieurs périodes. Sur le graphique H1, le prix se situe au-dessus de la superposition des EMA — EMA20 à 4 394,14 $, EMA50 à 4 386,53 $ et EMA200 à 4 324,72 $ — avec des plus hauts et des plus bas plus élevés qui restent intactes. Le RSI affiche 61,29, indiquant une dynamique haussière sans être en surachat, tandis que le MACD reste positif, avec un histogramme qui s’élargit à 0,7611.
L’ADX à 19,54 indique une force de tendance modérée, ce qui signifie que le mouvement est réel, mais pas encore explosif. Le prix est au-dessus du VWAP à 4 392,58 $, confirmant une position haussière intrajournalière. Le support le plus proche se situe à 4 399,70 $, un niveau présentant six touchers d’importance historique. En dessous, 4 107,00 $ et 4 070,80 $ servent de zones de support plus profondes, deux anciens niveaux de résistance désormais inversés.
Sur les périodes H4 et D1, le tableau est tout aussi constructif. Le RSI H4 est à 66,85, le RSI D1 à 67,52 : tous deux haussiers sans être étirés. La clôture quotidienne à 4 406,25 maintient la porte ouverte à une poussée vers le plus haut du swing à 4 474,60 $. L’ATR de 10,62 vous indique que la fourchette quotidienne moyenne laisse de la place pour un mouvement de 20 $+, donc la consolidation actuelle reste bien dans des paramètres normaux.
#XAU #XAUUSD #forextrader #forextrading #LiveTrading
Mouvement du prix XAU USD le 12 août à l’ouverture de Londres : objectif taureau à 4 477 $
Le mouvement du prix XAU USD du 12 août à l’ouverture de Londres révèle une structure haussière nette sur plusieurs périodes. Sur le graphique H1, le prix se situe au-dessus de la superposition des EMA — EMA20 à 4 394,14 $, EMA50 à 4 386,53 $ et EMA200 à 4 324,72 $ — avec des plus hauts et des plus bas plus élevés qui restent intactes. Le RSI affiche 61,29, indiquant une dynamique haussière sans être en surachat, tandis que le MACD reste positif, avec un histogramme qui s’élargit à 0,7611.
L’ADX à 19,54 indique une force de tendance modérée, ce qui signifie que le mouvement est réel, mais pas encore explosif. Le prix est au-dessus du VWAP à 4 392,58 $, confirmant une position haussière intrajournalière. Le support le plus proche se situe à 4 399,70 $, un niveau présentant six touchers d’importance historique. En dessous, 4 107,00 $ et 4 070,80 $ servent de zones de support plus profondes, deux anciens niveaux de résistance désormais inversés.
Sur les périodes H4 et D1, le tableau est tout aussi constructif. Le RSI H4 est à 66,85, le RSI D1 à 67,52 : tous deux haussiers sans être étirés. La clôture quotidienne à 4 406,25 maintient la porte ouverte à une poussée vers le plus haut du swing à 4 474,60 $. L’ATR de 10,62 vous indique que la fourchette quotidienne moyenne laisse de la place pour un mouvement de 20 $+, donc la consolidation actuelle reste bien dans des paramètres normaux.
#XAU #XAUUSD #forextrader #forextrading #LiveTrading
Le mouvement du prix XAU USD du 12 août à l’ouverture de Londres révèle une structure haussière nette sur plusieurs périodes. Sur le graphique H1, le prix se situe au-dessus de la superposition des EMA — EMA20 à 4 394,14 $, EMA50 à 4 386,53 $ et EMA200 à 4 324,72 $ — avec des plus hauts et des plus bas plus élevés qui restent intactes. Le RSI affiche 61,29, indiquant une dynamique haussière sans être en surachat, tandis que le MACD reste positif, avec un histogramme qui s’élargit à 0,7611.
L’ADX à 19,54 indique une force de tendance modérée, ce qui signifie que le mouvement est réel, mais pas encore explosif. Le prix est au-dessus du VWAP à 4 392,58 $, confirmant une position haussière intrajournalière. Le support le plus proche se situe à 4 399,70 $, un niveau présentant six touchers d’importance historique. En dessous, 4 107,00 $ et 4 070,80 $ servent de zones de support plus profondes, deux anciens niveaux de résistance désormais inversés.
Sur les périodes H4 et D1, le tableau est tout aussi constructif. Le RSI H4 est à 66,85, le RSI D1 à 67,52 : tous deux haussiers sans être étirés. La clôture quotidienne à 4 406,25 maintient la porte ouverte à une poussée vers le plus haut du swing à 4 474,60 $. L’ATR de 10,62 vous indique que la fourchette quotidienne moyenne laisse de la place pour un mouvement de 20 $+, donc la consolidation actuelle reste bien dans des paramètres normaux.
#XAU #XAUUSD #forextrader #forextrading #LiveTrading
1
158
·
--
Haussier
Prévision du prix de l’or : semaine du 08 au 14 août 2026
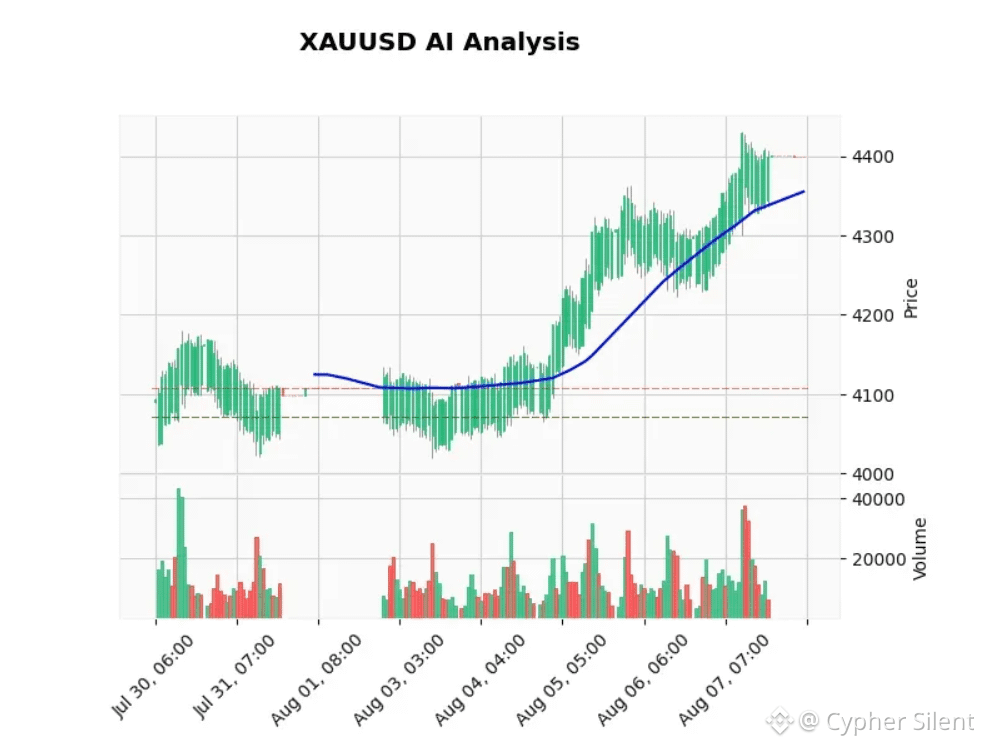
Le marché de l’or aborde la semaine du 08 au 14 août 2026 dans un climat de forte tension. Après une rallye puissante ayant fait grimper les prix de plus de 7 % en une seule semaine, la paire XAU/USD s’approche désormais d’une barrière technique critique située à 4 401,30 $. Le contexte fondamental reste nettement haussier, porté par la demande de valeurs refuge et par l’évolution des anticipations concernant la Réserve fédérale, mais le tableau technique en ce début de semaine est loin d’être net. Le prix se situe directement sur une zone de résistance, sans support proche pour servir d’ancrage à une entrée à faible risque. C’est un marché qui exige patience et précision, pas une poursuite impulsive. Pour les traders qui cherchent à se positionner pour la semaine à venir, la question clé est simple : l’or va-t-il franchir les 4 401 $ et prolonger sa hausse, ou un repli vers 4 223 $ est-il au programme ? Cette prévision hebdomadaire complète détaille la technique, les fondamentaux et une stratégie de trading claire pour traverser les jours à venir.
Vous souhaitez trader automatiquement cette configuration sur l’or ? Notre AI Trading BOT (https://investortipster.com/marketplace/product/ai-trading/)fonctionne 24/7 sur XAU/USD avec un taux de réussite de 83 % +.
Bilan de la semaine passée
La semaine du 01 au 07 août 2026 restera comme l’une des périodes les plus explosives pour l’or cette année. Le principal catalyseur a été une publication inattendue et particulièrement faible des Non-Farm Payrolls (NFP), qui a brisé les attentes du marché concernant de nouvelles hausses de taux de la Réserve fédérale. La réaction immédiate a été une forte dépréciation du dollar américain, ainsi qu’une chute correspondante des rendements des Treasuries, deux éléments qui ont servi de carburant au métal précieux. L’or a réagi avec une hausse spectaculaire de +2,30 % sur une seule journée, contribuant à un gain hebdomadaire d’environ 7 %. Ce mouvement a fait passer le prix de la mi-zone des 4 100 $ à un plus haut proche de 4 401 $, un niveau qui constitue désormais la résistance immédiate.
La hausse n’a pas été uniquement une réaction instinctive aux données sur l’emploi. Elle a aussi été soutenue par un changement plus large de la dynamique du sentiment de marché. POUR EN SAVOIR PLUS :: HTTPS://SMARTGOLDTRADE.COM
Prévision du prix de l’or : semaine du 08 au 14 août 2026
Le marché de l’or aborde la semaine du 08 au 14 août 2026 dans un climat de forte tension. Après une rallye puissante ayant fait grimper les prix de plus de 7 % en une seule semaine, la paire XAU/USD s’approche désormais d’une barrière technique critique située à 4 401,30 $. Le contexte fondamental reste nettement haussier, porté par la demande de valeurs refuge et par l’évolution des anticipations concernant la Réserve fédérale, mais le tableau technique en ce début de semaine est loin d’être net. Le prix se situe directement sur une zone de résistance, sans support proche pour servir d’ancrage à une entrée à faible risque. C’est un marché qui exige patience et précision, pas une poursuite impulsive. Pour les traders qui cherchent à se positionner pour la semaine à venir, la question clé est simple : l’or va-t-il franchir les 4 401 $ et prolonger sa hausse, ou un repli vers 4 223 $ est-il au programme ? Cette prévision hebdomadaire complète détaille la technique, les fondamentaux et une stratégie de trading claire pour traverser les jours à venir.
Vous souhaitez trader automatiquement cette configuration sur l’or ? Notre AI Trading BOT (https://investortipster.com/marketplace/product/ai-trading/)fonctionne 24/7 sur XAU/USD avec un taux de réussite de 83 % +.
Bilan de la semaine passée
La semaine du 01 au 07 août 2026 restera comme l’une des périodes les plus explosives pour l’or cette année. Le principal catalyseur a été une publication inattendue et particulièrement faible des Non-Farm Payrolls (NFP), qui a brisé les attentes du marché concernant de nouvelles hausses de taux de la Réserve fédérale. La réaction immédiate a été une forte dépréciation du dollar américain, ainsi qu’une chute correspondante des rendements des Treasuries, deux éléments qui ont servi de carburant au métal précieux. L’or a réagi avec une hausse spectaculaire de +2,30 % sur une seule journée, contribuant à un gain hebdomadaire d’environ 7 %. Ce mouvement a fait passer le prix de la mi-zone des 4 100 $ à un plus haut proche de 4 401 $, un niveau qui constitue désormais la résistance immédiate.
La hausse n’a pas été uniquement une réaction instinctive aux données sur l’emploi. Elle a aussi été soutenue par un changement plus large de la dynamique du sentiment de marché. POUR EN SAVOIR PLUS :: HTTPS://SMARTGOLDTRADE.COM
Le marché de l’or aborde la semaine du 08 au 14 août 2026 dans un climat de forte tension. Après une rallye puissante ayant fait grimper les prix de plus de 7 % en une seule semaine, la paire XAU/USD s’approche désormais d’une barrière technique critique située à 4 401,30 $. Le contexte fondamental reste nettement haussier, porté par la demande de valeurs refuge et par l’évolution des anticipations concernant la Réserve fédérale, mais le tableau technique en ce début de semaine est loin d’être net. Le prix se situe directement sur une zone de résistance, sans support proche pour servir d’ancrage à une entrée à faible risque. C’est un marché qui exige patience et précision, pas une poursuite impulsive. Pour les traders qui cherchent à se positionner pour la semaine à venir, la question clé est simple : l’or va-t-il franchir les 4 401 $ et prolonger sa hausse, ou un repli vers 4 223 $ est-il au programme ? Cette prévision hebdomadaire complète détaille la technique, les fondamentaux et une stratégie de trading claire pour traverser les jours à venir.
Vous souhaitez trader automatiquement cette configuration sur l’or ? Notre AI Trading BOT (https://investortipster.com/marketplace/product/ai-trading/)fonctionne 24/7 sur XAU/USD avec un taux de réussite de 83 % +.
Bilan de la semaine passée
La semaine du 01 au 07 août 2026 restera comme l’une des périodes les plus explosives pour l’or cette année. Le principal catalyseur a été une publication inattendue et particulièrement faible des Non-Farm Payrolls (NFP), qui a brisé les attentes du marché concernant de nouvelles hausses de taux de la Réserve fédérale. La réaction immédiate a été une forte dépréciation du dollar américain, ainsi qu’une chute correspondante des rendements des Treasuries, deux éléments qui ont servi de carburant au métal précieux. L’or a réagi avec une hausse spectaculaire de +2,30 % sur une seule journée, contribuant à un gain hebdomadaire d’environ 7 %. Ce mouvement a fait passer le prix de la mi-zone des 4 100 $ à un plus haut proche de 4 401 $, un niveau qui constitue désormais la résistance immédiate.
La hausse n’a pas été uniquement une réaction instinctive aux données sur l’emploi. Elle a aussi été soutenue par un changement plus large de la dynamique du sentiment de marché. POUR EN SAVOIR PLUS :: HTTPS://SMARTGOLDTRADE.COM
101

Article
Impact de la Réserve fédérale sur l’or : comment les décisions de taux façonnent les prix de l’or en 2026Peu de forces font bouger le marché de l’or aussi spectaculairement que la Réserve fédérale des États-Unis. Si vous avez déjà vu le cours de l’or osciller de 50 $ ou plus en une seule après-midi, il est probable qu’une annonce de la Fed en soit la cause. Comprendre l’impact de la Réserve fédérale sur l’or n’est pas réservé aux professionnels de Wall Street : c’est un savoir essentiel pour chaque investisseur particulier qui souhaite trader l’or de manière intelligente et protéger son patrimoine.
Avec l’or actuellement coté à 4 052,06 $ par once troy au 8 août 2026, les enjeux n’ont jamais été aussi élevés. Chaque mot du président de la Réserve fédérale, chaque déclaration du FOMC et chaque changement de politique monétaire envoient des ondes de choc sur le marché de l’or, capables soit d’éroder, soit de multiplier votre investissement en l’espace de quelques heures.
Impact de la Réserve fédérale sur l’or : comment les décisions de taux façonnent les prix de l’or en 2026
Peu de forces font bouger le marché de l’or aussi spectaculairement que la Réserve fédérale des États-Unis. Si vous avez déjà vu le cours de l’or osciller de 50 $ ou plus en une seule après-midi, il est probable qu’une annonce de la Fed en soit la cause. Comprendre l’impact de la Réserve fédérale sur l’or n’est pas réservé aux professionnels de Wall Street : c’est un savoir essentiel pour chaque investisseur particulier qui souhaite trader l’or de manière intelligente et protéger son patrimoine.
Avec l’or actuellement coté à 4 052,06 $ par once troy au 8 août 2026, les enjeux n’ont jamais été aussi élevés. Chaque mot du président de la Réserve fédérale, chaque déclaration du FOMC et chaque changement de politique monétaire envoient des ondes de choc sur le marché de l’or, capables soit d’éroder, soit de multiplier votre investissement en l’espace de quelques heures.
Avec l’or actuellement coté à 4 052,06 $ par once troy au 8 août 2026, les enjeux n’ont jamais été aussi élevés. Chaque mot du président de la Réserve fédérale, chaque déclaration du FOMC et chaque changement de politique monétaire envoient des ondes de choc sur le marché de l’or, capables soit d’éroder, soit de multiplier votre investissement en l’espace de quelques heures.
1
100
Connectez-vous pour découvrir plus de contenu
Rejoignez la communauté mondiale des adeptes de cryptomonnaies sur Binance Square
⚡️ Suviez les dernières informations importantes sur les cryptomonnaies.
💬 Jugé digne de confiance par la plus grande plateforme d’échange de cryptomonnaies au monde.
👍 Découvrez les connaissances que partagent les créateurs vérifiés.
Adresse e-mail/Nº de téléphone
Sujets d’actualité
NvidiaApproves$150BBuyback
1,178 vues
29 mentions
#NvidiaApproves$150BBuyback
Onde de choc de rachat de 150 milliards de dollars de Nvidia : est-ce que les flux de trésorerie liés à l’IA alimentent la prochaine flambée du marché ? 🚀
Le supercycle de l’IA vient d’envoyer des ondes de choc à travers les marchés traditionnels (tradfi) et crypto ! Le conseil d’administration de NVIDIA a autorisé une hausse massive de 150 milliards de dollars de son programme de rachat d’actions, portant l’autorisation totale restante de rachat de la société à 235 milliards de dollars.
Il s’agit de la plus grande autorisation de rachat d’actions de l’histoire des entreprises américaines, dépassant le repère d’Apple à 110 milliards de dollars.
📰 Faits marquants & décryptage du marché
Restitution de capital record : Le fondateur et PDG de NVIDIA, Jensen Huang, a cité « un changement de plateforme, une fois par génération, vers l’IA » ainsi que de solides flux de trésorerie d’entreprise comme principaux moteurs du retour de capital aux actionnaires.
L’inverse des replis du marché : Malgré la pression plus large sur les actions et la hausse des rendements des bons du Trésor américain, les actions de $NVDA ont bondi de plus de 3 % à l’annonce, signalant la confiance des investisseurs institutionnels dans les actifs tech.
Retombées sur l’IA décentralisée : Historiquement, les grands titres bullish sur NVIDIA déclenchent un sentiment positif pour les protocoles d’infrastructure d’IA décentralisée (tels que NEAR, RENDER et FET), car les projets web3 liés à l’IA suivent les valorisations du secteur de l’IA dans son ensemble.
❓ Point à discuter
Nvidia annonce un rachat massif de 150 Md ! Les gains sur les actions technologiques vont-ils déborder vers le Bitcoin et les tokens d’IA ?
$RENDER
📊 Signal de trading crypto associé : RENDER/USDT
Biais de trading : Bullish
Zone d’entrée : 5,20 $ – 5,45 $
Objectif 1 (TP1) : 6,10 $
Objectif 2 (TP2) : 6,85 $
Stop Loss (SL) : 4,85 $
Effet de levier (futures) : 3x – 5x (Isolé)
Justification technique : RENDER réagit souvent fortement au matériel Nvidia et aux développements en matière de capital lié à l’IA. Le prix se consolide près du support clé de la moyenne mobile, avec un volume spot en hausse après la $NVDAB
annonce.
#HackersDrainOver12.4MXRPFromDCENTWallets #CryptoNews #AITokens #TradingSignals
Lily星星
·1 mentions J’aime
·95 vues
OpenAIDelaysGPT6.1OverSafetyIssues
5,265 vues
236 mentions
AMDToAcquireWorldLabsFor$8.2B
788 vues
28 mentions