
Muhamamd Adeel
584 Publications

Muhamamd Adeel
Signaler
Bloquer l’utilisateur
Daily provide Latest News.
10 Suivis
52 Abonnés
59 J’aime
Publications
Tous
Citations
Article
Voir la traduction
The Dry Powder Is Gone — So Who's Buying Bitcoin at $63K?Everyone's waiting for the dry powder to buy the dip.
The problem? The powder is gone.
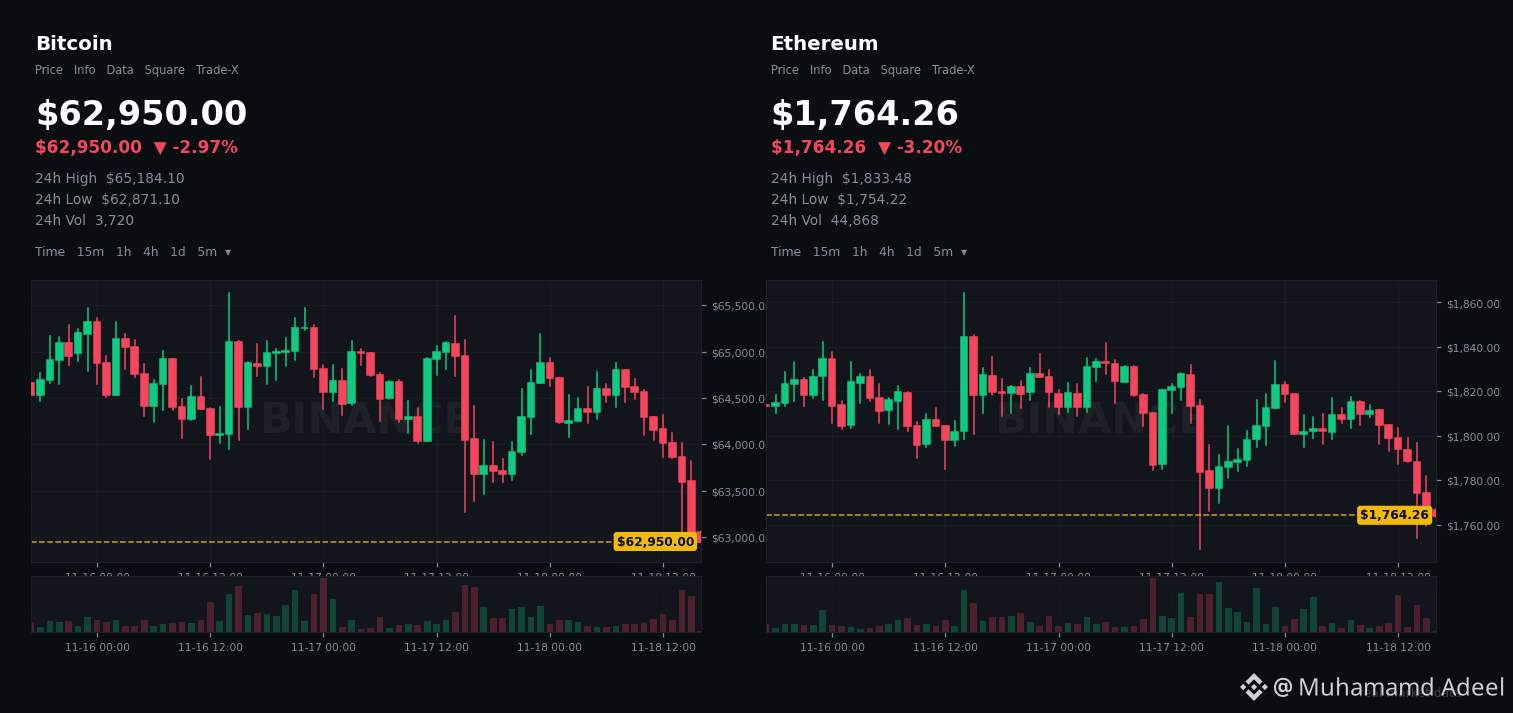
$BTC flushed to $62,029 on 15 November — its lowest since July — then bounced, and now trades in the low $63,000s. Fear & Greed sits at 11. Extreme Fear. Sixth straight day.
And here's the number nobody's talking about: stablecoin supply just fell $14.2B in 30 days. That's the steepest monthly contraction since June 2022.
This isn't a pile of cash waiting on the sidelines. It's cash leaving the building.
$USDT alone is down $6.6B in 60 days — shrinking faster than it did after FTX collapsed. The stablecoins actually sitting on exchanges? About $52.7B. That's the 1st percentile — the lowest reading in a year. Binance's stablecoin buffer fell from around $41B to $32B in the weeks after the late-October hack, and while the drain has stopped, nothing has flooded back in.
So no — there is no wall of fresh money parked on exchanges, ready to catch the next dip. Glassnode put it bluntly: for a bull market to happen, capital needs to enter, not leave.
But — and this is the part that makes this interesting — someone still bought the flush.
Buyers absorbed roughly 66,000 BTC in the $62,000–$66,000 zone in just two days of heavy selling. Realised losses hit levels previously seen only near the market lows of 2018, 2020 and 2022. Whale wallets holding 1,000+ BTC added about 84,000 BTC in a month — though some of that may be wallet reshuffling rather than fresh buying. On-chain analyst James Check calls it the fourth capitulation event since the all-time high, and says Bitcoin is back in its deep-value zone.
So we have two truths at once: the system's cash is draining, but the buyers who are left are absorbing everything the sellers throw at them.
That's not a confirmed bottom. ETFs still bled $239.9M on 17 November. Short-term whales just realised $579M in losses. Demand is still weak, and the FOMC minutes land tonight at 19:00 UTC, with a December hike heavily priced in.
Here's what I'm watching. $62K is the line. A daily close below it opens the door to $58,500, then the aggregate realised price near $53,700. Hold it, and the next test is $65K — then $74,100, the average cost of short-term holders, which Glassnode says needs to be reclaimed to validate any bottom.
And $ETH is the tell: if majors hold their ground while Bitcoin stalls, capital isn't leaving — it's waiting. If they crack together, the drain is still in charge.
The dry powder story was comforting. The chain says it's wrong. What the chain does say is that capitulation is real, buyers are absorbing the flush, and the next move gets decided at $62K — not by hope, but by whether fresh money finally shows up.
Not financial advice. DYOR.
The Dry Powder Is Gone — So Who's Buying Bitcoin at $63K?
Everyone's waiting for the dry powder to buy the dip.
The problem? The powder is gone.
$BTC flushed to $62,029 on 15 November — its lowest since July — then bounced, and now trades in the low $63,000s. Fear & Greed sits at 11. Extreme Fear. Sixth straight day.
And here's the number nobody's talking about: stablecoin supply just fell $14.2B in 30 days. That's the steepest monthly contraction since June 2022.
This isn't a pile of cash waiting on the sidelines. It's cash leaving the building.
$USDT alone is down $6.6B in 60 days — shrinking faster than it did after FTX collapsed. The stablecoins actually sitting on exchanges? About $52.7B. That's the 1st percentile — the lowest reading in a year. Binance's stablecoin buffer fell from around $41B to $32B in the weeks after the late-October hack, and while the drain has stopped, nothing has flooded back in.
So no — there is no wall of fresh money parked on exchanges, ready to catch the next dip. Glassnode put it bluntly: for a bull market to happen, capital needs to enter, not leave.
But — and this is the part that makes this interesting — someone still bought the flush.
Buyers absorbed roughly 66,000 BTC in the $62,000–$66,000 zone in just two days of heavy selling. Realised losses hit levels previously seen only near the market lows of 2018, 2020 and 2022. Whale wallets holding 1,000+ BTC added about 84,000 BTC in a month — though some of that may be wallet reshuffling rather than fresh buying. On-chain analyst James Check calls it the fourth capitulation event since the all-time high, and says Bitcoin is back in its deep-value zone.
So we have two truths at once: the system's cash is draining, but the buyers who are left are absorbing everything the sellers throw at them.
That's not a confirmed bottom. ETFs still bled $239.9M on 17 November. Short-term whales just realised $579M in losses. Demand is still weak, and the FOMC minutes land tonight at 19:00 UTC, with a December hike heavily priced in.
Here's what I'm watching. $62K is the line. A daily close below it opens the door to $58,500, then the aggregate realised price near $53,700. Hold it, and the next test is $65K — then $74,100, the average cost of short-term holders, which Glassnode says needs to be reclaimed to validate any bottom.
And $ETH is the tell: if majors hold their ground while Bitcoin stalls, capital isn't leaving — it's waiting. If they crack together, the drain is still in charge.
The dry powder story was comforting. The chain says it's wrong. What the chain does say is that capitulation is real, buyers are absorbing the flush, and the next move gets decided at $62K — not by hope, but by whether fresh money finally shows up.
Not financial advice. DYOR.
The problem? The powder is gone.
$BTC flushed to $62,029 on 15 November — its lowest since July — then bounced, and now trades in the low $63,000s. Fear & Greed sits at 11. Extreme Fear. Sixth straight day.
And here's the number nobody's talking about: stablecoin supply just fell $14.2B in 30 days. That's the steepest monthly contraction since June 2022.
This isn't a pile of cash waiting on the sidelines. It's cash leaving the building.
$USDT alone is down $6.6B in 60 days — shrinking faster than it did after FTX collapsed. The stablecoins actually sitting on exchanges? About $52.7B. That's the 1st percentile — the lowest reading in a year. Binance's stablecoin buffer fell from around $41B to $32B in the weeks after the late-October hack, and while the drain has stopped, nothing has flooded back in.
So no — there is no wall of fresh money parked on exchanges, ready to catch the next dip. Glassnode put it bluntly: for a bull market to happen, capital needs to enter, not leave.
But — and this is the part that makes this interesting — someone still bought the flush.
Buyers absorbed roughly 66,000 BTC in the $62,000–$66,000 zone in just two days of heavy selling. Realised losses hit levels previously seen only near the market lows of 2018, 2020 and 2022. Whale wallets holding 1,000+ BTC added about 84,000 BTC in a month — though some of that may be wallet reshuffling rather than fresh buying. On-chain analyst James Check calls it the fourth capitulation event since the all-time high, and says Bitcoin is back in its deep-value zone.
So we have two truths at once: the system's cash is draining, but the buyers who are left are absorbing everything the sellers throw at them.
That's not a confirmed bottom. ETFs still bled $239.9M on 17 November. Short-term whales just realised $579M in losses. Demand is still weak, and the FOMC minutes land tonight at 19:00 UTC, with a December hike heavily priced in.
Here's what I'm watching. $62K is the line. A daily close below it opens the door to $58,500, then the aggregate realised price near $53,700. Hold it, and the next test is $65K — then $74,100, the average cost of short-term holders, which Glassnode says needs to be reclaimed to validate any bottom.
And $ETH is the tell: if majors hold their ground while Bitcoin stalls, capital isn't leaving — it's waiting. If they crack together, the drain is still in charge.
The dry powder story was comforting. The chain says it's wrong. What the chain does say is that capitulation is real, buyers are absorbing the flush, and the next move gets decided at $62K — not by hope, but by whether fresh money finally shows up.
Not financial advice. DYOR.
Article
Voir la traduction
Nvidia Beat by $7B — So Why Is Bitcoin Still Stuck at $64K?Nvidia just printed the biggest beat of the year. Bitcoin yawned.
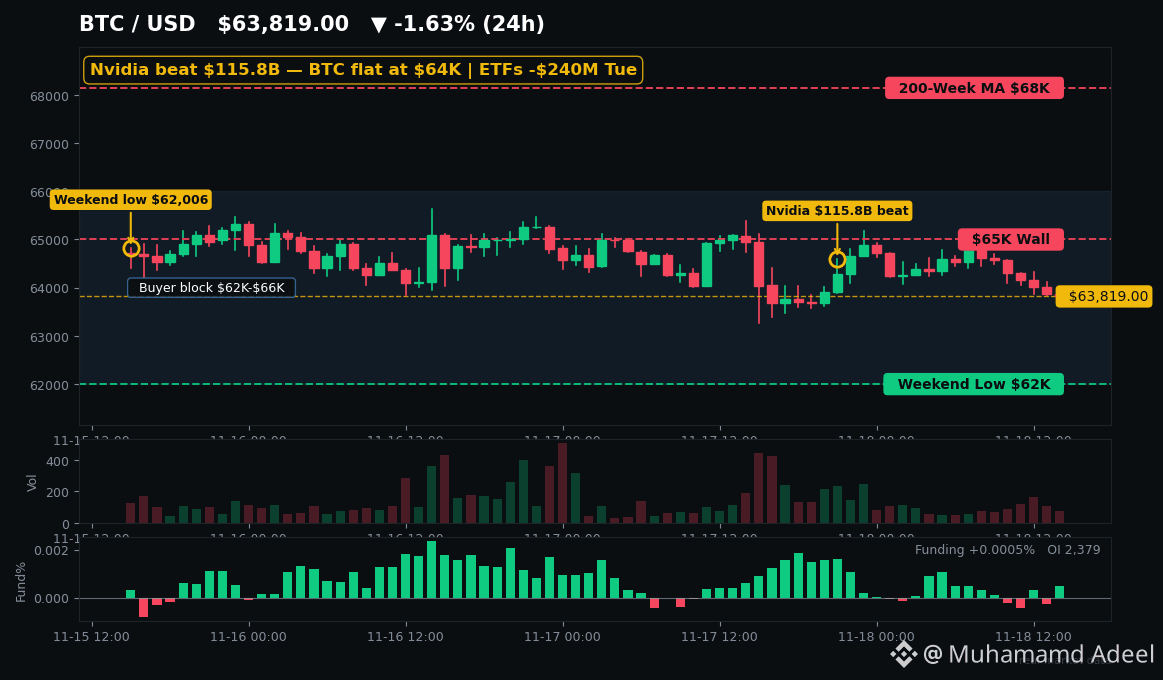
$115.8 billion in revenue. Up 103% year over year. Roughly $7 billion above what Wall Street expected, with next quarter guided to $130 billion. Nvidia's stock jumped ~4% after hours. Nasdaq futures rallied. Stocks cheered.
And $BTC? Flat. Around $64,000. It popped about $600 on the news, then gave it straight back within the hour.
The most-watched earnings report on the planet just smashed expectations — and crypto couldn't hold a $600 bounce. This isn't a market waiting for good news. It's a market that stopped listening to it.
Here's what actually matters: the money is still leaving.
US spot Bitcoin ETFs bled $239.9 million on Tuesday — and BlackRock's IBIT alone accounted for $209.5 million of it, 87% of the total. That came one day after a tiny $7.9 million inflow that was supposed to end a seven-session outflow streak — it didn't. November's total is now -$2.58 billion. Ethereum ETFs lost $29.1 million the same day. Check $ETH's chart and you'll see the same story — stuck near $1,800, down over 40% this year.
Meanwhile the Fear & Greed Index sits at 11 — Extreme Fear, six days running. Bitcoin's daily RSI hit 19.95 on Saturday, a reading that usually shows up near exhaustion.
So why isn't the Nvidia beat saving crypto? Last November, during a crypto selloff, Nvidia's report lifted Bitcoin to $93,000 overnight — then it faded to $88,000 the same day. Across 16 Nvidia earnings reports, Bitcoin's average move afterwards is 1.68% — exactly its average daily move. In other words: the earnings pop is noise. Flows and rates are the signal.
And the rate signal is brutal. The market now prices roughly a 92–96% chance of a Fed hike on December 9. The FOMC minutes land tonight — but they cover the October meeting, before the hot inflation print, so don't expect them to soften anything.
Here's the twist: when 96% of the market expects the same hike, the hike is already in the price. Bitcoin is down ~49% from its October 2025 peak. The sellers? Mostly weak hands: short-term holders just realized their worst losses since February, while long-term holders aren't selling at all — and buyers absorbed 66,000 BTC in the $62,000–$66,000 zone. K33's Vetle Lunde calls anything under $70,000 "a gift" for patient buyers, while warning the recovery will be choppy, not a V-shape. Bitwise's Matt Hougan says the cause of the selloff — the Fed repricing — has now played out.
Watch the levels. Support is $62,000 — Sunday's low — then $60,000, where Glassnode sees a liquidation cluster. Resistance is $65,000, then the 200-week moving average near $68,000. A daily close above $68,000 with ETF inflows returning is the line that forces the bears to rethink. A break below $60,000 is the one that turns a correction into a cascade.
Nvidia proved AI isn't collapsing. Crypto's problem was never AI — it's that nobody with real money is buying yet, and until the ETF flows turn, no earnings beat will do it for them.
Not financial advice. DYOR.
Nvidia Beat by $7B — So Why Is Bitcoin Still Stuck at $64K?
Nvidia just printed the biggest beat of the year. Bitcoin yawned.
$115.8 billion in revenue. Up 103% year over year. Roughly $7 billion above what Wall Street expected, with next quarter guided to $130 billion. Nvidia's stock jumped ~4% after hours. Nasdaq futures rallied. Stocks cheered.
And $BTC ? Flat. Around $64,000. It popped about $600 on the news, then gave it straight back within the hour.
The most-watched earnings report on the planet just smashed expectations — and crypto couldn't hold a $600 bounce. This isn't a market waiting for good news. It's a market that stopped listening to it.
Here's what actually matters: the money is still leaving.
US spot Bitcoin ETFs bled $239.9 million on Tuesday — and BlackRock's IBIT alone accounted for $209.5 million of it, 87% of the total. That came one day after a tiny $7.9 million inflow that was supposed to end a seven-session outflow streak — it didn't. November's total is now -$2.58 billion. Ethereum ETFs lost $29.1 million the same day. Check $ETH 's chart and you'll see the same story — stuck near $1,800, down over 40% this year.
Meanwhile the Fear & Greed Index sits at 11 — Extreme Fear, six days running. Bitcoin's daily RSI hit 19.95 on Saturday, a reading that usually shows up near exhaustion.
So why isn't the Nvidia beat saving crypto? Last November, during a crypto selloff, Nvidia's report lifted Bitcoin to $93,000 overnight — then it faded to $88,000 the same day. Across 16 Nvidia earnings reports, Bitcoin's average move afterwards is 1.68% — exactly its average daily move. In other words: the earnings pop is noise. Flows and rates are the signal.
And the rate signal is brutal. The market now prices roughly a 92–96% chance of a Fed hike on December 9. The FOMC minutes land tonight — but they cover the October meeting, before the hot inflation print, so don't expect them to soften anything.
Here's the twist: when 96% of the market expects the same hike, the hike is already in the price. Bitcoin is down ~49% from its October 2025 peak. The sellers? Mostly weak hands: short-term holders just realized their worst losses since February, while long-term holders aren't selling at all — and buyers absorbed 66,000 BTC in the $62,000–$66,000 zone. K33's Vetle Lunde calls anything under $70,000 "a gift" for patient buyers, while warning the recovery will be choppy, not a V-shape. Bitwise's Matt Hougan says the cause of the selloff — the Fed repricing — has now played out.
Watch the levels. Support is $62,000 — Sunday's low — then $60,000, where Glassnode sees a liquidation cluster. Resistance is $65,000, then the 200-week moving average near $68,000. A daily close above $68,000 with ETF inflows returning is the line that forces the bears to rethink. A break below $60,000 is the one that turns a correction into a cascade.
Nvidia proved AI isn't collapsing. Crypto's problem was never AI — it's that nobody with real money is buying yet, and until the ETF flows turn, no earnings beat will do it for them.
Not financial advice. DYOR.
$115.8 billion in revenue. Up 103% year over year. Roughly $7 billion above what Wall Street expected, with next quarter guided to $130 billion. Nvidia's stock jumped ~4% after hours. Nasdaq futures rallied. Stocks cheered.
And $BTC ? Flat. Around $64,000. It popped about $600 on the news, then gave it straight back within the hour.
The most-watched earnings report on the planet just smashed expectations — and crypto couldn't hold a $600 bounce. This isn't a market waiting for good news. It's a market that stopped listening to it.
Here's what actually matters: the money is still leaving.
US spot Bitcoin ETFs bled $239.9 million on Tuesday — and BlackRock's IBIT alone accounted for $209.5 million of it, 87% of the total. That came one day after a tiny $7.9 million inflow that was supposed to end a seven-session outflow streak — it didn't. November's total is now -$2.58 billion. Ethereum ETFs lost $29.1 million the same day. Check $ETH 's chart and you'll see the same story — stuck near $1,800, down over 40% this year.
Meanwhile the Fear & Greed Index sits at 11 — Extreme Fear, six days running. Bitcoin's daily RSI hit 19.95 on Saturday, a reading that usually shows up near exhaustion.
So why isn't the Nvidia beat saving crypto? Last November, during a crypto selloff, Nvidia's report lifted Bitcoin to $93,000 overnight — then it faded to $88,000 the same day. Across 16 Nvidia earnings reports, Bitcoin's average move afterwards is 1.68% — exactly its average daily move. In other words: the earnings pop is noise. Flows and rates are the signal.
And the rate signal is brutal. The market now prices roughly a 92–96% chance of a Fed hike on December 9. The FOMC minutes land tonight — but they cover the October meeting, before the hot inflation print, so don't expect them to soften anything.
Here's the twist: when 96% of the market expects the same hike, the hike is already in the price. Bitcoin is down ~49% from its October 2025 peak. The sellers? Mostly weak hands: short-term holders just realized their worst losses since February, while long-term holders aren't selling at all — and buyers absorbed 66,000 BTC in the $62,000–$66,000 zone. K33's Vetle Lunde calls anything under $70,000 "a gift" for patient buyers, while warning the recovery will be choppy, not a V-shape. Bitwise's Matt Hougan says the cause of the selloff — the Fed repricing — has now played out.
Watch the levels. Support is $62,000 — Sunday's low — then $60,000, where Glassnode sees a liquidation cluster. Resistance is $65,000, then the 200-week moving average near $68,000. A daily close above $68,000 with ETF inflows returning is the line that forces the bears to rethink. A break below $60,000 is the one that turns a correction into a cascade.
Nvidia proved AI isn't collapsing. Crypto's problem was never AI — it's that nobody with real money is buying yet, and until the ETF flows turn, no earnings beat will do it for them.
Not financial advice. DYOR.
Voir la traduction
BTC Crashed Below 5K — But Tokenized Bonds Are Quietly WinningBitcoin just broke $65K and fear is at 11.
But while everyone was panic-selling, the most boring trade in crypto kept moving: real bonds, on-chain.
Here's the split nobody is talking about. Tokenized US Treasuries are a ~$14 billion market right now. Tokenized stocks just hit a record $3.8 billion — up 590% this year. On Monday, Wirex put tokenized Apple, Amazon and Microsoft shares on Base. DTCC's tokenization service went live on 28 October. Nasdaq starts near-24-hour trading on 6 December.
Wall Street isn't debating tokenization anymore. It's building it. Standard Chartered sees the RWA market going from ~$45 billion today to $2 trillion by end-2028. Citi's base case is $5.5 trillion by 2030.
So why is $POLYX — the token of Polymesh, the chain literally built for regulated securities — sitting at its all-time low?
$POLYX is ~$0.0257 right now. It printed a fresh all-time low of $0.0251 on 15 November. It's down 15% this week, 25% this month, and roughly 96% below its March 2024 high of ~$0.75. RSI is 24 — deeply oversold. And this is after Polymesh shipped a real upgrade on 11 November, giving every asset an EVM address so Ethereum wallets can finally touch it.
That's the honest truth about this market: the Treasuries held up. The token didn't. $POLYX isn't a claim on a bond's yield — it's a bet on the plumbing. And right now, the plumbing is unloved, illiquid, and trading on about $500K of daily volume.
History says this gap is exactly where the fireworks start. When BlackRock announced BUIDL in March 2024, $POLYX ripped 86% in a single day and 146% in a week. Then it gave back 47% the next month. RWA tokens are narrative leverage — they move violently on headlines and bleed slowly in between. In the August 2024 crash, $ONDO fell 45% in four days, then bounced 37% the next day and led the whole market's recovery.
So watch the levels. $0.0251 is the line in the sand — the all-time low. Lose it and there's no chart below, just air. Hold it, and the first test is $0.0263, then $0.030, where the token closed on upgrade day. Check $POLYX on the chart — that $0.0251 line is the whole trade right now.
The risks are real, and I'm not hiding them. BlackRock's BUIDL has bled $320 million in ten days. Tokenized Treasuries have cooled from their $15.9 billion summer peak. $LINK is the infrastructure name everyone actually watches here, and even it can't save a token with uncapped supply and thin liquidity. A tokenized bond can be frozen by its issuer. It isn't the same as owning the bill.
But the direction is one-way. DTCC is live. Nasdaq goes nearly 24/7 in weeks. Tokenized stocks are at record highs while crypto panics. The rails are being laid — the only question is whether the market notices the tokens that run on them before the next headline does.
Not financial advice. DYOR.
BTC Crashed Below 5K — But Tokenized Bonds Are Quietly Winning
Bitcoin just broke $65K and fear is at 11.
But while everyone was panic-selling, the most boring trade in crypto kept moving: real bonds, on-chain.
Here's the split nobody is talking about. Tokenized US Treasuries are a ~$14 billion market right now. Tokenized stocks just hit a record $3.8 billion — up 590% this year. On Monday, Wirex put tokenized Apple, Amazon and Microsoft shares on Base. DTCC's tokenization service went live on 28 October. Nasdaq starts near-24-hour trading on 6 December.
Wall Street isn't debating tokenization anymore. It's building it. Standard Chartered sees the RWA market going from ~$45 billion today to $2 trillion by end-2028. Citi's base case is $5.5 trillion by 2030.
So why is $POLYX — the token of Polymesh, the chain literally built for regulated securities — sitting at its all-time low?
$POLYX is ~$0.0257 right now. It printed a fresh all-time low of $0.0251 on 15 November. It's down 15% this week, 25% this month, and roughly 96% below its March 2024 high of ~$0.75. RSI is 24 — deeply oversold. And this is after Polymesh shipped a real upgrade on 11 November, giving every asset an EVM address so Ethereum wallets can finally touch it.
That's the honest truth about this market: the Treasuries held up. The token didn't. $POLYX isn't a claim on a bond's yield — it's a bet on the plumbing. And right now, the plumbing is unloved, illiquid, and trading on about $500K of daily volume.
History says this gap is exactly where the fireworks start. When BlackRock announced BUIDL in March 2024, $POLYX ripped 86% in a single day and 146% in a week. Then it gave back 47% the next month. RWA tokens are narrative leverage — they move violently on headlines and bleed slowly in between. In the August 2024 crash, $ONDO fell 45% in four days, then bounced 37% the next day and led the whole market's recovery.
So watch the levels. $0.0251 is the line in the sand — the all-time low. Lose it and there's no chart below, just air. Hold it, and the first test is $0.0263, then $0.030, where the token closed on upgrade day. Check $POLYX on the chart — that $0.0251 line is the whole trade right now.
The risks are real, and I'm not hiding them. BlackRock's BUIDL has bled $320 million in ten days. Tokenized Treasuries have cooled from their $15.9 billion summer peak. $LINK is the infrastructure name everyone actually watches here, and even it can't save a token with uncapped supply and thin liquidity. A tokenized bond can be frozen by its issuer. It isn't the same as owning the bill.
But the direction is one-way. DTCC is live. Nasdaq goes nearly 24/7 in weeks. Tokenized stocks are at record highs while crypto panics. The rails are being laid — the only question is whether the market notices the tokens that run on them before the next headline does.
Not financial advice. DYOR.
But while everyone was panic-selling, the most boring trade in crypto kept moving: real bonds, on-chain.
Here's the split nobody is talking about. Tokenized US Treasuries are a ~$14 billion market right now. Tokenized stocks just hit a record $3.8 billion — up 590% this year. On Monday, Wirex put tokenized Apple, Amazon and Microsoft shares on Base. DTCC's tokenization service went live on 28 October. Nasdaq starts near-24-hour trading on 6 December.
Wall Street isn't debating tokenization anymore. It's building it. Standard Chartered sees the RWA market going from ~$45 billion today to $2 trillion by end-2028. Citi's base case is $5.5 trillion by 2030.
So why is $POLYX — the token of Polymesh, the chain literally built for regulated securities — sitting at its all-time low?
$POLYX is ~$0.0257 right now. It printed a fresh all-time low of $0.0251 on 15 November. It's down 15% this week, 25% this month, and roughly 96% below its March 2024 high of ~$0.75. RSI is 24 — deeply oversold. And this is after Polymesh shipped a real upgrade on 11 November, giving every asset an EVM address so Ethereum wallets can finally touch it.
That's the honest truth about this market: the Treasuries held up. The token didn't. $POLYX isn't a claim on a bond's yield — it's a bet on the plumbing. And right now, the plumbing is unloved, illiquid, and trading on about $500K of daily volume.
History says this gap is exactly where the fireworks start. When BlackRock announced BUIDL in March 2024, $POLYX ripped 86% in a single day and 146% in a week. Then it gave back 47% the next month. RWA tokens are narrative leverage — they move violently on headlines and bleed slowly in between. In the August 2024 crash, $ONDO fell 45% in four days, then bounced 37% the next day and led the whole market's recovery.
So watch the levels. $0.0251 is the line in the sand — the all-time low. Lose it and there's no chart below, just air. Hold it, and the first test is $0.0263, then $0.030, where the token closed on upgrade day. Check $POLYX on the chart — that $0.0251 line is the whole trade right now.
The risks are real, and I'm not hiding them. BlackRock's BUIDL has bled $320 million in ten days. Tokenized Treasuries have cooled from their $15.9 billion summer peak. $LINK is the infrastructure name everyone actually watches here, and even it can't save a token with uncapped supply and thin liquidity. A tokenized bond can be frozen by its issuer. It isn't the same as owning the bill.
But the direction is one-way. DTCC is live. Nasdaq goes nearly 24/7 in weeks. Tokenized stocks are at record highs while crypto panics. The rails are being laid — the only question is whether the market notices the tokens that run on them before the next headline does.
Not financial advice. DYOR.
2
Article
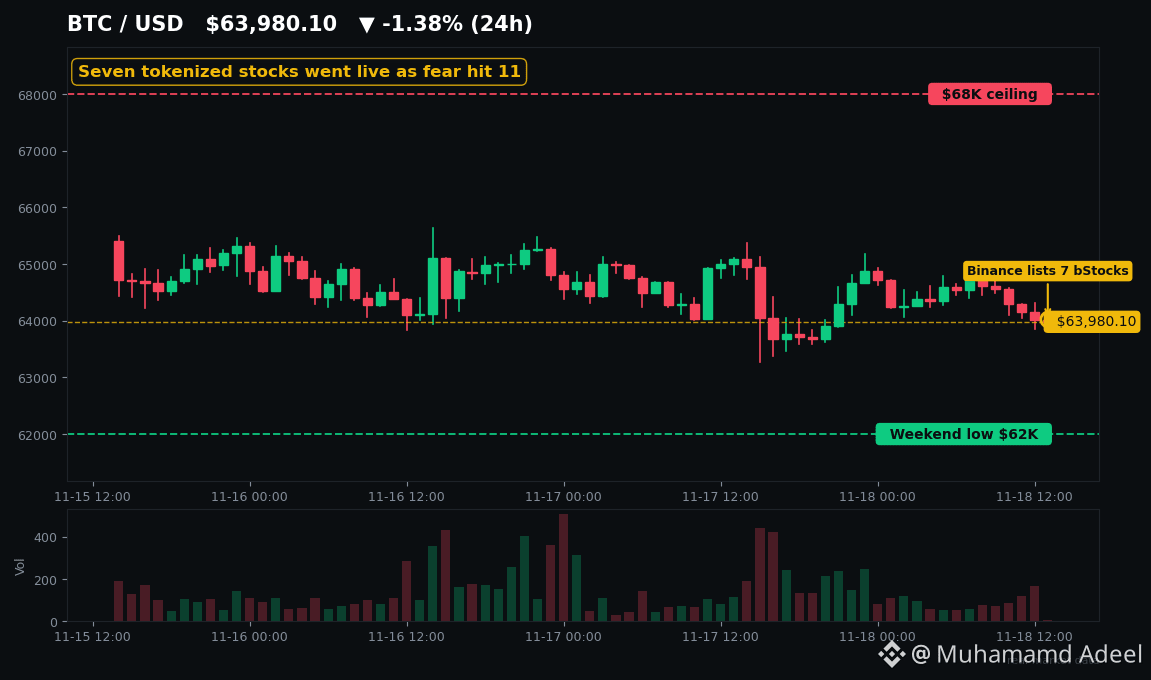
Binance vient de coter 7 actions tokenisées — et personne n’en parlePendant que tout le monde regardait le Bitcoin dégringoler, Binance a discrètement ajouté aujourd’hui sept actions du monde réel au marché Spot.
Japon. Taïwan. Brésil. Le Russell 2000. Et les deux plus grandes entreprises fintech d’Amérique latine — $MELIB (MercadoLibre) et NUB — sont désormais négociables 24 h/24 et 7 j/7 en USDT, juste à côté de vos cryptos.
Voici ce qui a réellement été lancé à 13 h 00 UTC : EWJB (iShares MSCI Japan), EWTB (MSCI Taiwan), EWZB et EWZSB (MSCI Brazil et Brazil Small-Cap), IWMB (Russell 2000), ainsi que MELIB et NUB. Frais maker nuls jusqu’au 30 novembre. Vous pouvez les échanger sur Convert contre du BTC ou de l’USDT sans frais, et les sept ont été ajoutés comme garanties de marge dans la même heure.
Binance vient de coter 7 actions tokenisées — et personne n’en parle
Pendant que tout le monde regardait le Bitcoin dégringoler, Binance a discrètement ajouté aujourd’hui sept actions du monde réel au marché Spot.
Japon. Taïwan. Brésil. Le Russell 2000. Et les deux plus grandes entreprises fintech d’Amérique latine — $MELIB (MercadoLibre) et NUB — sont désormais négociables 24 h/24 et 7 j/7 en USDT, juste à côté de vos cryptos.
Voici ce qui a réellement été lancé à 13 h 00 UTC : EWJB (iShares MSCI Japan), EWTB (MSCI Taiwan), EWZB et EWZSB (MSCI Brazil et Brazil Small-Cap), IWMB (Russell 2000), ainsi que MELIB et NUB. Frais maker nuls jusqu’au 30 novembre. Vous pouvez les échanger sur Convert contre du BTC ou de l’USDT sans frais, et les sept ont été ajoutés comme garanties de marge dans la même heure.
Japon. Taïwan. Brésil. Le Russell 2000. Et les deux plus grandes entreprises fintech d’Amérique latine — $MELIB (MercadoLibre) et NUB — sont désormais négociables 24 h/24 et 7 j/7 en USDT, juste à côté de vos cryptos.
Voici ce qui a réellement été lancé à 13 h 00 UTC : EWJB (iShares MSCI Japan), EWTB (MSCI Taiwan), EWZB et EWZSB (MSCI Brazil et Brazil Small-Cap), IWMB (Russell 2000), ainsi que MELIB et NUB. Frais maker nuls jusqu’au 30 novembre. Vous pouvez les échanger sur Convert contre du BTC ou de l’USDT sans frais, et les sept ont été ajoutés comme garanties de marge dans la même heure.
2
Article
Voir la traduction
ETFs Are Dumping ETH. BitMine Just Bought 6M of It. Someone's Wrong.ETFs have pulled $2.42B out of ETH since late September — seven straight weeks of outflows. Meanwhile one company now owns almost 5% of the entire supply.
Someone here is very wrong — and the clock is ticking on finding out who.
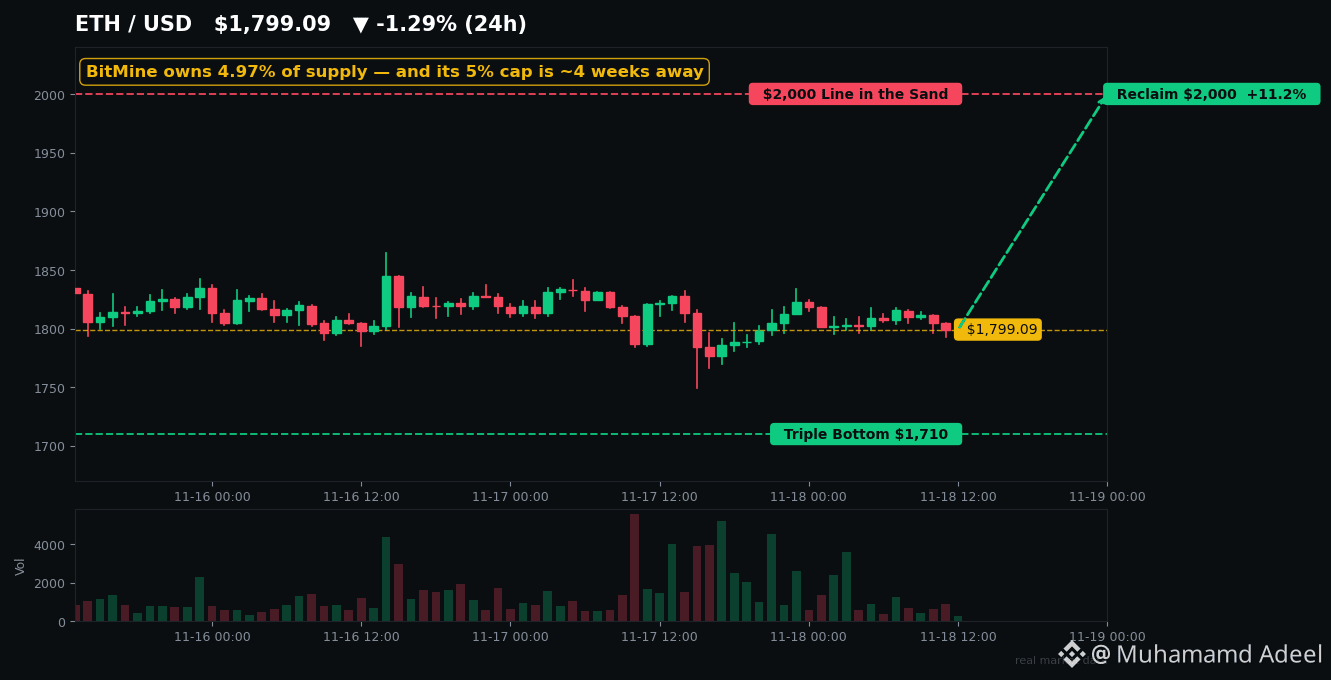
BitMine now holds 6,077,745 ETH — 4.97% of every ETH that exists. It bought another 7,653 ETH last week, into the crash, while its chairman Tom Lee called the slide a "waterfall decline" that "defies fundamentals."
But here's the twist nobody's talking about: BitMine is almost done buying. Lee set a hard 5% cap — and at the current slowed pace, the last ~32,000 ETH gets bought in about four weeks. Then ETH's steadiest corporate buyer switches off.
And the sellers? They aren't slowing down at all.
US spot ETH ETFs lost $398.9M in the week of 9–13 November — the seventh straight negative week, after October's record $1.61B outflow. They bled another $29M on Tuesday alone.
The price tells the same story. $ETH is hovering near $1,800 — down 26% since 5 November, 64% below its $4,946 all-time high. It bounced three times off $1,710–$1,750 last week, a triple bottom holding for now. Against $BTC, it's at 0.028 — near four-year lows.
So why is anyone still buying?
Because the quiet money isn't just BitMine. Whale wallets linked to Erik Voorhees bought 63,540 ETH (~$125M) into the drop. The 7 Siblings scooped 31,484 ETH. Binance's own ETH reserves just hit a five-year low of ~2.9M coins — holders are moving ETH off exchanges, not onto them. And a record 36.3% of all ETH — 44.5 million coins — is now locked in staking.
Even the network is busier than ever: Base alone processes ~9 million transactions a day, ten times mainnet. $ARB and the L2 crowd are doing record volume while the token bleeds.
Now the honest part — because this trade has real teeth.
BitMine's own shares trade at roughly 0.87x the value of the ETH it holds. The premium that funded its buying is gone. Its FY2026 accounts show a $6.31B net loss, mostly unrealised. Fourteen of fifteen ETH treasury companies are underwater at $1,800. And all that L2 activity? Blob fees are near zero — about a tenth of a cent — so it barely burns any ETH. Supply actually grew ~0.7% this year. Glamsterdam, the upgrade meant to change the story, has no mainnet date at all. And a December Fed hike is now ~95% priced.
History says ratio lows like this are where reversals have happened — in April 2025 the ratio bottomed near 0.018 and ETH ripped 200% in four months. History also says most of those gains got given back.
So here's the line in the sand: hold $1,710–$1,750 and the triple bottom stands. Reclaim $2,000 and the whole conversation flips. Lose $1,710, and the quiet buyers are catching a falling knife.
Check the $ETH chart — that $2,000 level is the one that decides everything.
Are the treasuries early — or just wrong?
Not financial advice. DYOR.
ETFs Are Dumping ETH. BitMine Just Bought 6M of It. Someone's Wrong.
ETFs have pulled $2.42B out of ETH since late September — seven straight weeks of outflows. Meanwhile one company now owns almost 5% of the entire supply.
Someone here is very wrong — and the clock is ticking on finding out who.
BitMine now holds 6,077,745 ETH — 4.97% of every ETH that exists. It bought another 7,653 ETH last week, into the crash, while its chairman Tom Lee called the slide a "waterfall decline" that "defies fundamentals."
But here's the twist nobody's talking about: BitMine is almost done buying. Lee set a hard 5% cap — and at the current slowed pace, the last ~32,000 ETH gets bought in about four weeks. Then ETH's steadiest corporate buyer switches off.
And the sellers? They aren't slowing down at all.
US spot ETH ETFs lost $398.9M in the week of 9–13 November — the seventh straight negative week, after October's record $1.61B outflow. They bled another $29M on Tuesday alone.
The price tells the same story. $ETH is hovering near $1,800 — down 26% since 5 November, 64% below its $4,946 all-time high. It bounced three times off $1,710–$1,750 last week, a triple bottom holding for now. Against $BTC , it's at 0.028 — near four-year lows.
So why is anyone still buying?
Because the quiet money isn't just BitMine. Whale wallets linked to Erik Voorhees bought 63,540 ETH (~$125M) into the drop. The 7 Siblings scooped 31,484 ETH. Binance's own ETH reserves just hit a five-year low of ~2.9M coins — holders are moving ETH off exchanges, not onto them. And a record 36.3% of all ETH — 44.5 million coins — is now locked in staking.
Even the network is busier than ever: Base alone processes ~9 million transactions a day, ten times mainnet. $ARB and the L2 crowd are doing record volume while the token bleeds.
Now the honest part — because this trade has real teeth.
BitMine's own shares trade at roughly 0.87x the value of the ETH it holds. The premium that funded its buying is gone. Its FY2026 accounts show a $6.31B net loss, mostly unrealised. Fourteen of fifteen ETH treasury companies are underwater at $1,800. And all that L2 activity? Blob fees are near zero — about a tenth of a cent — so it barely burns any ETH. Supply actually grew ~0.7% this year. Glamsterdam, the upgrade meant to change the story, has no mainnet date at all. And a December Fed hike is now ~95% priced.
History says ratio lows like this are where reversals have happened — in April 2025 the ratio bottomed near 0.018 and ETH ripped 200% in four months. History also says most of those gains got given back.
So here's the line in the sand: hold $1,710–$1,750 and the triple bottom stands. Reclaim $2,000 and the whole conversation flips. Lose $1,710, and the quiet buyers are catching a falling knife.
Check the $ETH chart — that $2,000 level is the one that decides everything.
Are the treasuries early — or just wrong?
Not financial advice. DYOR.
Someone here is very wrong — and the clock is ticking on finding out who.
BitMine now holds 6,077,745 ETH — 4.97% of every ETH that exists. It bought another 7,653 ETH last week, into the crash, while its chairman Tom Lee called the slide a "waterfall decline" that "defies fundamentals."
But here's the twist nobody's talking about: BitMine is almost done buying. Lee set a hard 5% cap — and at the current slowed pace, the last ~32,000 ETH gets bought in about four weeks. Then ETH's steadiest corporate buyer switches off.
And the sellers? They aren't slowing down at all.
US spot ETH ETFs lost $398.9M in the week of 9–13 November — the seventh straight negative week, after October's record $1.61B outflow. They bled another $29M on Tuesday alone.
The price tells the same story. $ETH is hovering near $1,800 — down 26% since 5 November, 64% below its $4,946 all-time high. It bounced three times off $1,710–$1,750 last week, a triple bottom holding for now. Against $BTC , it's at 0.028 — near four-year lows.
So why is anyone still buying?
Because the quiet money isn't just BitMine. Whale wallets linked to Erik Voorhees bought 63,540 ETH (~$125M) into the drop. The 7 Siblings scooped 31,484 ETH. Binance's own ETH reserves just hit a five-year low of ~2.9M coins — holders are moving ETH off exchanges, not onto them. And a record 36.3% of all ETH — 44.5 million coins — is now locked in staking.
Even the network is busier than ever: Base alone processes ~9 million transactions a day, ten times mainnet. $ARB and the L2 crowd are doing record volume while the token bleeds.
Now the honest part — because this trade has real teeth.
BitMine's own shares trade at roughly 0.87x the value of the ETH it holds. The premium that funded its buying is gone. Its FY2026 accounts show a $6.31B net loss, mostly unrealised. Fourteen of fifteen ETH treasury companies are underwater at $1,800. And all that L2 activity? Blob fees are near zero — about a tenth of a cent — so it barely burns any ETH. Supply actually grew ~0.7% this year. Glamsterdam, the upgrade meant to change the story, has no mainnet date at all. And a December Fed hike is now ~95% priced.
History says ratio lows like this are where reversals have happened — in April 2025 the ratio bottomed near 0.018 and ETH ripped 200% in four months. History also says most of those gains got given back.
So here's the line in the sand: hold $1,710–$1,750 and the triple bottom stands. Reclaim $2,000 and the whole conversation flips. Lose $1,710, and the quiet buyers are catching a falling knife.
Check the $ETH chart — that $2,000 level is the one that decides everything.
Are the treasuries early — or just wrong?
Not financial advice. DYOR.
5
Article
Voir la traduction
The $62K Flush Killed the Leverage. It Didn't Bring the Buyers$62,000. Roughly $2 billion in leveraged positions wiped out in a single day.
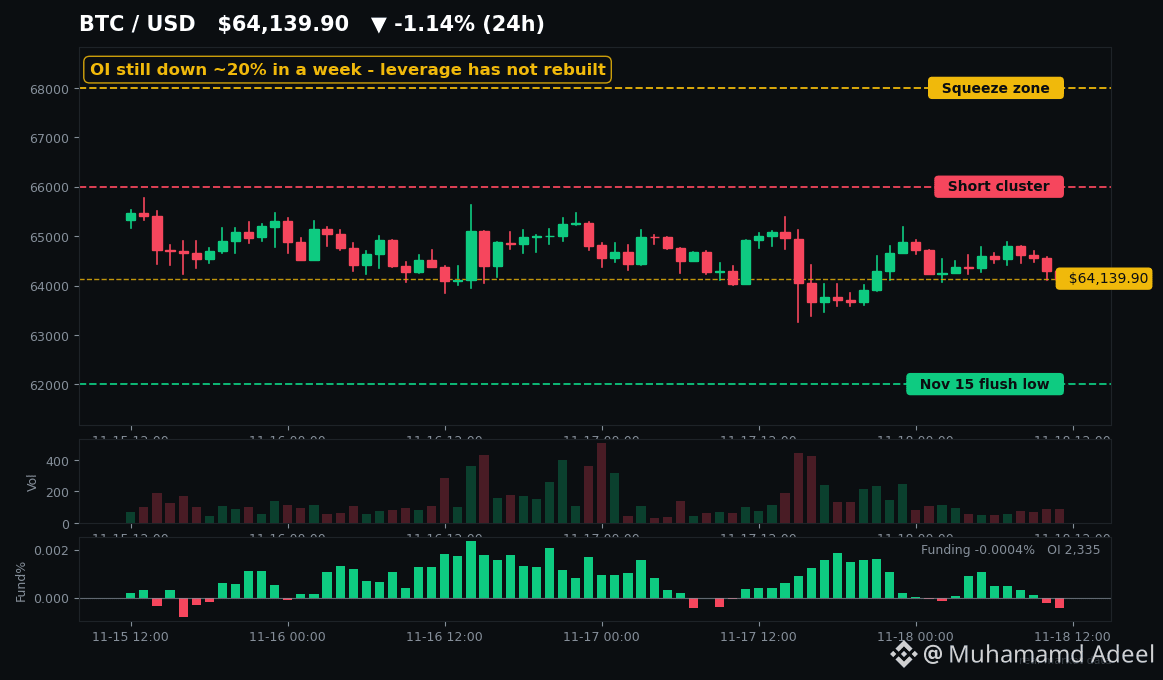
And here's the part nobody wants to say out loud: the leverage is gone — but the buyers haven't come back yet.
Sunday's flush was brutal. Bitcoin tagged $62,006, its lowest since July, down almost 49% from the $126,000 all-time high. Over 300,000 accounts got liquidated, roughly $2B in a day, and the vast majority of it was longs. Fear & Greed is sitting at 11 — Extreme Fear, six days running.
So the market is clean now, right? Not so fast.
**The leverage never came back**
Open interest is still down around 20% in a week. Binance's BTC perp OI sits near $5.95B, down 19.5% in seven days. Funding rates are hovering near zero — nobody is paying up to be long again. The flush cleared the sellers. It just didn't create buyers.
That's the trap most people are missing. A reset is not a reversal. History says the same thing: after the August 2024 flush, it took about three months of slow, spot-driven buying before Bitcoin made new highs. After the October 2025 $19B flush, leverage never rebuilt at all.
**Coiled between two magnets**
Glassnode's model puts the biggest remaining long-liquidation cluster at $59.5K–$62.2K — Sunday's low only dipped into its upper edge. Lose $62K on a daily close and the next stop is the June low near $58.5K.
Above, the shorts are stacked around $66K–$68K. A break through there forces short-covering, and that's the squeeze everyone is talking about. But heatmaps are models, not orders — they show where liquidations *could* cascade, not where price *will* go. And squeezes need spot buying to push price into the cluster. Right now spot demand is doing the opposite.
**The bid is still missing**
US spot ETFs saw another $239.9M outflow on Tuesday, taking November's total past $2.6B. Stablecoin supply just shrank $14.2B in 30 days — the fastest contraction since June 2022. That's the dry powder leaving the building. Even Nvidia's monster earnings beat on Tuesday couldn't lift $BTC — it stayed pinned near $64,000 while the stock popped.
And the macro backdrop just got harder, not easier: the market is now pricing a Fed *hike* in December, not a cut, with Fed minutes landing today.
So here's my take: this is a two-sided trap market, not a bottom call. Watch $62K below and $66K above. A daily close under $62K opens the door to $58.5K. A reclaim of $66K–$68K puts the shorts on the run. Until one of those breaks, the honest trade is patience — and if $BTC does break, watch $ETH next, it took $488M of the same flush. Even $SOL traders should be watching this range, because altcoin leverage follows Bitcoin's lead.
The leverage is gone. Now we find out if anyone actually wants to buy.
Not financial advice. DYOR.
The $62K Flush Killed the Leverage. It Didn't Bring the Buyers
$62,000. Roughly $2 billion in leveraged positions wiped out in a single day.
And here's the part nobody wants to say out loud: the leverage is gone — but the buyers haven't come back yet.
Sunday's flush was brutal. Bitcoin tagged $62,006, its lowest since July, down almost 49% from the $126,000 all-time high. Over 300,000 accounts got liquidated, roughly $2B in a day, and the vast majority of it was longs. Fear & Greed is sitting at 11 — Extreme Fear, six days running.
So the market is clean now, right? Not so fast.
**The leverage never came back**
Open interest is still down around 20% in a week. Binance's BTC perp OI sits near $5.95B, down 19.5% in seven days. Funding rates are hovering near zero — nobody is paying up to be long again. The flush cleared the sellers. It just didn't create buyers.
That's the trap most people are missing. A reset is not a reversal. History says the same thing: after the August 2024 flush, it took about three months of slow, spot-driven buying before Bitcoin made new highs. After the October 2025 $19B flush, leverage never rebuilt at all.
**Coiled between two magnets**
Glassnode's model puts the biggest remaining long-liquidation cluster at $59.5K–$62.2K — Sunday's low only dipped into its upper edge. Lose $62K on a daily close and the next stop is the June low near $58.5K.
Above, the shorts are stacked around $66K–$68K. A break through there forces short-covering, and that's the squeeze everyone is talking about. But heatmaps are models, not orders — they show where liquidations *could* cascade, not where price *will* go. And squeezes need spot buying to push price into the cluster. Right now spot demand is doing the opposite.
**The bid is still missing**
US spot ETFs saw another $239.9M outflow on Tuesday, taking November's total past $2.6B. Stablecoin supply just shrank $14.2B in 30 days — the fastest contraction since June 2022. That's the dry powder leaving the building. Even Nvidia's monster earnings beat on Tuesday couldn't lift $BTC — it stayed pinned near $64,000 while the stock popped.
And the macro backdrop just got harder, not easier: the market is now pricing a Fed *hike* in December, not a cut, with Fed minutes landing today.
So here's my take: this is a two-sided trap market, not a bottom call. Watch $62K below and $66K above. A daily close under $62K opens the door to $58.5K. A reclaim of $66K–$68K puts the shorts on the run. Until one of those breaks, the honest trade is patience — and if $BTC does break, watch $ETH next, it took $488M of the same flush. Even $SOL traders should be watching this range, because altcoin leverage follows Bitcoin's lead.
The leverage is gone. Now we find out if anyone actually wants to buy.
Not financial advice. DYOR.
And here's the part nobody wants to say out loud: the leverage is gone — but the buyers haven't come back yet.
Sunday's flush was brutal. Bitcoin tagged $62,006, its lowest since July, down almost 49% from the $126,000 all-time high. Over 300,000 accounts got liquidated, roughly $2B in a day, and the vast majority of it was longs. Fear & Greed is sitting at 11 — Extreme Fear, six days running.
So the market is clean now, right? Not so fast.
**The leverage never came back**
Open interest is still down around 20% in a week. Binance's BTC perp OI sits near $5.95B, down 19.5% in seven days. Funding rates are hovering near zero — nobody is paying up to be long again. The flush cleared the sellers. It just didn't create buyers.
That's the trap most people are missing. A reset is not a reversal. History says the same thing: after the August 2024 flush, it took about three months of slow, spot-driven buying before Bitcoin made new highs. After the October 2025 $19B flush, leverage never rebuilt at all.
**Coiled between two magnets**
Glassnode's model puts the biggest remaining long-liquidation cluster at $59.5K–$62.2K — Sunday's low only dipped into its upper edge. Lose $62K on a daily close and the next stop is the June low near $58.5K.
Above, the shorts are stacked around $66K–$68K. A break through there forces short-covering, and that's the squeeze everyone is talking about. But heatmaps are models, not orders — they show where liquidations *could* cascade, not where price *will* go. And squeezes need spot buying to push price into the cluster. Right now spot demand is doing the opposite.
**The bid is still missing**
US spot ETFs saw another $239.9M outflow on Tuesday, taking November's total past $2.6B. Stablecoin supply just shrank $14.2B in 30 days — the fastest contraction since June 2022. That's the dry powder leaving the building. Even Nvidia's monster earnings beat on Tuesday couldn't lift $BTC — it stayed pinned near $64,000 while the stock popped.
And the macro backdrop just got harder, not easier: the market is now pricing a Fed *hike* in December, not a cut, with Fed minutes landing today.
So here's my take: this is a two-sided trap market, not a bottom call. Watch $62K below and $66K above. A daily close under $62K opens the door to $58.5K. A reclaim of $66K–$68K puts the shorts on the run. Until one of those breaks, the honest trade is patience — and if $BTC does break, watch $ETH next, it took $488M of the same flush. Even $SOL traders should be watching this range, because altcoin leverage follows Bitcoin's lead.
The leverage is gone. Now we find out if anyone actually wants to buy.
Not financial advice. DYOR.
2
Article
Voir la traduction
BNB Is Down 57% — But the Chain Just Hit #1 in RWA HoldersBNB is 57% below its all-time high. The chain it runs on just became #1 in the world at something.
That's the divergence nobody is talking about — and $600 is the line that decides which side wins.
THE PRICE SAYS PANIC
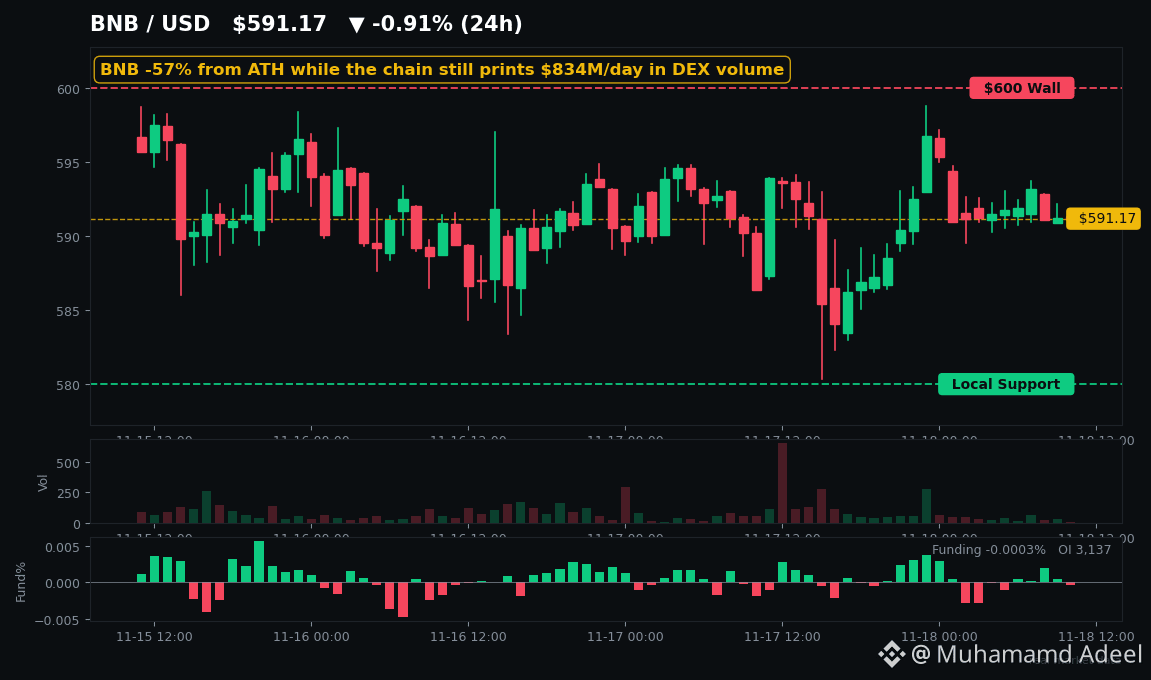
$BNB is trading around $591 — flat on the day, but down 13% this week and 18% this month. It crashed to $566 on 15 November, bounced, and has now been rejected just under $600 twice. RSI sits near 27 — deep oversold. The Fear & Greed Index reads 11. Extreme fear, six days running.
THE CHAIN SAYS SOMETHING ELSE
While the token bleeds, BNB Chain is still printing. DEX volume ran ~$834 million in the last 24 hours, and the chain logged ~17.7 million transactions a day. This morning brought a real milestone: BNB Chain now leads every network in real-world-asset holders — 2.17 million, up 6.4% in 30 days. PancakeSwap ($CAKE) is doing most of that volume. TVL has slipped to $4.52B from $5.3B two weeks ago — the chain is holding up, not collapsing.
And Binance isn't retreating. Three weeks after the $6.3B hack, its Asia-Pacific head told Reuters the exchange is in talks to enter five Asian markets. The REX-Osprey BNB staking ETF goes effective on 20 November. The Jenner hard fork lands on 8 December.
THE WARNING HISTORY GIVES YOU
Before you call this a bottom, remember July. BNB bounced 50% off its $538 low that month, ran to ~$805 by September... then gave it ALL back, round-tripping to $565. Oversold didn't save it in February either, when RSI hit 16 and price just went sideways for months.
And the hack chapter isn't closed. The US Senate wants Binance's records by 30 November, the SAFU emergency fund was roughly halved to cover the losses, and spot $BTC ETFs have bled $2.1 billion in November alone. $BTC itself is at ~$64,500, nearly 50% below its own record.
SO WHAT ACTUALLY MATTERS?
One level: $600. Reclaim it and hold it, and the bounce-watchers get their ladder — $610, then $630. Lose $580, and $566 gets retested, with the deeper bear counts pointing far lower.
The chain is healthy. The price is not. Which one is lying? Check the $BNB chart — $600 gives you the answer first.
Not financial advice. DYOR.
BNB Is Down 57% — But the Chain Just Hit #1 in RWA Holders
BNB is 57% below its all-time high. The chain it runs on just became #1 in the world at something.
That's the divergence nobody is talking about — and $600 is the line that decides which side wins.
THE PRICE SAYS PANIC
$BNB is trading around $591 — flat on the day, but down 13% this week and 18% this month. It crashed to $566 on 15 November, bounced, and has now been rejected just under $600 twice. RSI sits near 27 — deep oversold. The Fear & Greed Index reads 11. Extreme fear, six days running.
THE CHAIN SAYS SOMETHING ELSE
While the token bleeds, BNB Chain is still printing. DEX volume ran ~$834 million in the last 24 hours, and the chain logged ~17.7 million transactions a day. This morning brought a real milestone: BNB Chain now leads every network in real-world-asset holders — 2.17 million, up 6.4% in 30 days. PancakeSwap ($CAKE ) is doing most of that volume. TVL has slipped to $4.52B from $5.3B two weeks ago — the chain is holding up, not collapsing.
And Binance isn't retreating. Three weeks after the $6.3B hack, its Asia-Pacific head told Reuters the exchange is in talks to enter five Asian markets. The REX-Osprey BNB staking ETF goes effective on 20 November. The Jenner hard fork lands on 8 December.
THE WARNING HISTORY GIVES YOU
Before you call this a bottom, remember July. BNB bounced 50% off its $538 low that month, ran to ~$805 by September... then gave it ALL back, round-tripping to $565. Oversold didn't save it in February either, when RSI hit 16 and price just went sideways for months.
And the hack chapter isn't closed. The US Senate wants Binance's records by 30 November, the SAFU emergency fund was roughly halved to cover the losses, and spot $BTC ETFs have bled $2.1 billion in November alone. $BTC itself is at ~$64,500, nearly 50% below its own record.
SO WHAT ACTUALLY MATTERS?
One level: $600. Reclaim it and hold it, and the bounce-watchers get their ladder — $610, then $630. Lose $580, and $566 gets retested, with the deeper bear counts pointing far lower.
The chain is healthy. The price is not. Which one is lying? Check the $BNB chart — $600 gives you the answer first.
Not financial advice. DYOR.
That's the divergence nobody is talking about — and $600 is the line that decides which side wins.
THE PRICE SAYS PANIC
$BNB is trading around $591 — flat on the day, but down 13% this week and 18% this month. It crashed to $566 on 15 November, bounced, and has now been rejected just under $600 twice. RSI sits near 27 — deep oversold. The Fear & Greed Index reads 11. Extreme fear, six days running.
THE CHAIN SAYS SOMETHING ELSE
While the token bleeds, BNB Chain is still printing. DEX volume ran ~$834 million in the last 24 hours, and the chain logged ~17.7 million transactions a day. This morning brought a real milestone: BNB Chain now leads every network in real-world-asset holders — 2.17 million, up 6.4% in 30 days. PancakeSwap ($CAKE ) is doing most of that volume. TVL has slipped to $4.52B from $5.3B two weeks ago — the chain is holding up, not collapsing.
And Binance isn't retreating. Three weeks after the $6.3B hack, its Asia-Pacific head told Reuters the exchange is in talks to enter five Asian markets. The REX-Osprey BNB staking ETF goes effective on 20 November. The Jenner hard fork lands on 8 December.
THE WARNING HISTORY GIVES YOU
Before you call this a bottom, remember July. BNB bounced 50% off its $538 low that month, ran to ~$805 by September... then gave it ALL back, round-tripping to $565. Oversold didn't save it in February either, when RSI hit 16 and price just went sideways for months.
And the hack chapter isn't closed. The US Senate wants Binance's records by 30 November, the SAFU emergency fund was roughly halved to cover the losses, and spot $BTC ETFs have bled $2.1 billion in November alone. $BTC itself is at ~$64,500, nearly 50% below its own record.
SO WHAT ACTUALLY MATTERS?
One level: $600. Reclaim it and hold it, and the bounce-watchers get their ladder — $610, then $630. Lose $580, and $566 gets retested, with the deeper bear counts pointing far lower.
The chain is healthy. The price is not. Which one is lying? Check the $BNB chart — $600 gives you the answer first.
Not financial advice. DYOR.
Article
Voir la traduction
TAO Bounced 3% While Crypto Panicked — Here's Why AI Tokens MovedNvidia just posted the biggest quarter in AI history. And $TAO — the token that supposedly rides AI's coattails — is still 74% below its all-time high.
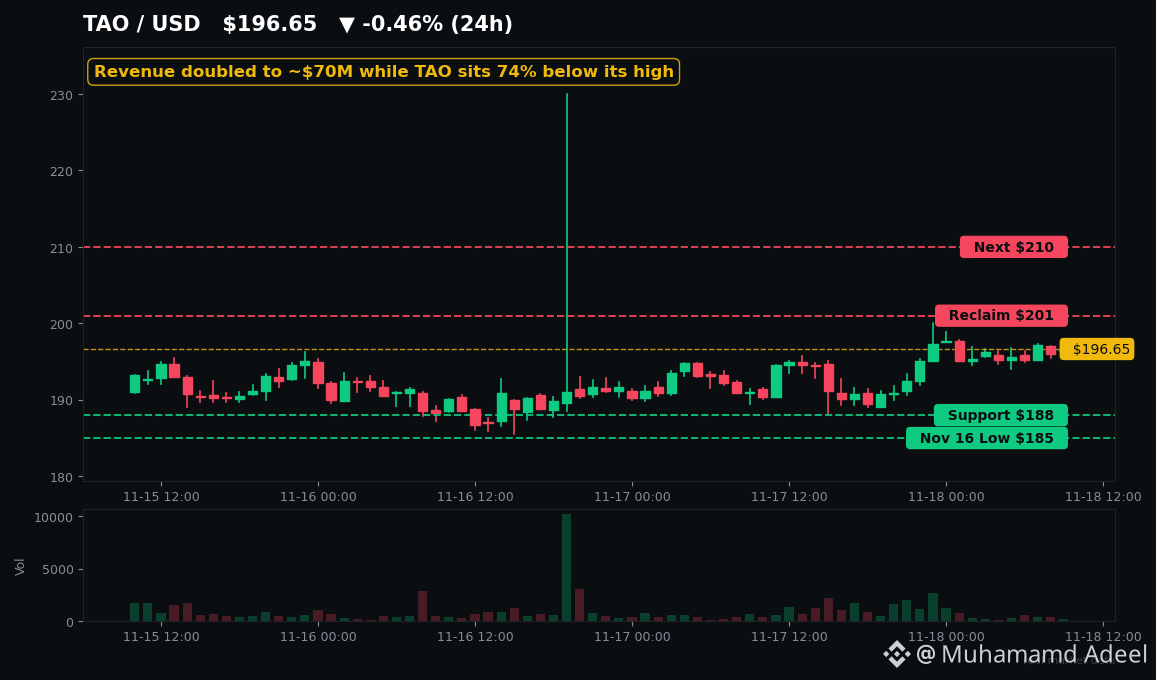
So what just happened? TAO climbed back to ~$197 after closing at $183.76 on 14 November, testing the $185–$188 zone twice and holding it. Not a breakout. Not a reversal. But in a market where Fear & Greed is pinned at 10 — Extreme Fear — even a held support line is a story.
Here's the setup. Nvidia reported $115.8 billion in Q3 revenue on 17 November, beating the ~$109.5 billion consensus, with Q4 guidance of ~$130 billion. Anthropic is pricing its Nasdaq IPO today at $70–$78 a share. The AI machine in the real world is printing money — and AI tokens finally twitched: $NEAR rose ~3.4%, $RENDER ~2.7%, TAO a few percent off its weekend lows.
But notice what didn't happen. Crypto barely reacted. Bitcoin is still hovering around $64–65K after crashing to $62,006 over the weekend, spot BTC ETFs have bled $1.91 billion across seven straight sessions, and a December Fed rate hike is now ~90% priced. As Nansen's Nicolai Sondergaard put it, AI and crypto draw on the same pool of risk capital — when Nvidia sells off, the money goes to cash, not into Bitcoin.
So why is TAO the one to watch? Because the crowd is doing something strange. LunarCrush has TAO at AltRank #2 with engagements up 5,231% in a week — 60.1 million in a day — while its sentiment gauge sits at 28%, near a one-year low. New attention is flooding in. Old holders are cautious. That split is exactly what the last two TAO bottoms looked like.
Look at the levels. Support is the $185–$188 zone TAO defended on 15–16 November; lose it on a daily close and $180, then $150, come into play. Resistance is $201, the first daily-close trigger; above that sits $210, then $226. A close above $201 changes the conversation. Below $185, the bounce was just a bounce.
And here's the tension underneath the price. Bittensor's subnets now generate roughly $70 million in annualised revenue, double the ~$35 million of September — one GPU-rental subnet alone did $2.7 million of customer spend in 31 days. Yet the network still emits ~3,600 TAO a day, roughly $256 million a year at current prices. Revenue covers maybe a tenth of that. The story is real. The subsidy is bigger.
History says this zone matters. In August 2024 TAO bottomed near $164–$180, ripped 75% in a week, failed at $300, then ran 174% to $605 by the end of September. In April 2025 it fell below $200, then gained 58% in a month. The first bounce usually fails — the durable move comes after a higher low, and only when the macro cooperates. This time the macro is a Fed hike and a $62K Bitcoin.
Grayscale's spot TAO ETF filing is still pending — a filing, not an approval. The honest read: TAO is the AI token with a real network, real revenue growth, and a price crushed 27% in a month and 41% in a year. Tap $TAO to watch the $201 line — a daily close above it, or a loss of $185, tells you which story wins.
Are you watching the revenue, or the price?
Not financial advice. DYOR.
TAO Bounced 3% While Crypto Panicked — Here's Why AI Tokens Moved
Nvidia just posted the biggest quarter in AI history. And $TAO — the token that supposedly rides AI's coattails — is still 74% below its all-time high.
So what just happened? TAO climbed back to ~$197 after closing at $183.76 on 14 November, testing the $185–$188 zone twice and holding it. Not a breakout. Not a reversal. But in a market where Fear & Greed is pinned at 10 — Extreme Fear — even a held support line is a story.
Here's the setup. Nvidia reported $115.8 billion in Q3 revenue on 17 November, beating the ~$109.5 billion consensus, with Q4 guidance of ~$130 billion. Anthropic is pricing its Nasdaq IPO today at $70–$78 a share. The AI machine in the real world is printing money — and AI tokens finally twitched: $NEAR rose ~3.4%, $RENDER ~2.7%, TAO a few percent off its weekend lows.
But notice what didn't happen. Crypto barely reacted. Bitcoin is still hovering around $64–65K after crashing to $62,006 over the weekend, spot BTC ETFs have bled $1.91 billion across seven straight sessions, and a December Fed rate hike is now ~90% priced. As Nansen's Nicolai Sondergaard put it, AI and crypto draw on the same pool of risk capital — when Nvidia sells off, the money goes to cash, not into Bitcoin.
So why is TAO the one to watch? Because the crowd is doing something strange. LunarCrush has TAO at AltRank #2 with engagements up 5,231% in a week — 60.1 million in a day — while its sentiment gauge sits at 28%, near a one-year low. New attention is flooding in. Old holders are cautious. That split is exactly what the last two TAO bottoms looked like.
Look at the levels. Support is the $185–$188 zone TAO defended on 15–16 November; lose it on a daily close and $180, then $150, come into play. Resistance is $201, the first daily-close trigger; above that sits $210, then $226. A close above $201 changes the conversation. Below $185, the bounce was just a bounce.
And here's the tension underneath the price. Bittensor's subnets now generate roughly $70 million in annualised revenue, double the ~$35 million of September — one GPU-rental subnet alone did $2.7 million of customer spend in 31 days. Yet the network still emits ~3,600 TAO a day, roughly $256 million a year at current prices. Revenue covers maybe a tenth of that. The story is real. The subsidy is bigger.
History says this zone matters. In August 2024 TAO bottomed near $164–$180, ripped 75% in a week, failed at $300, then ran 174% to $605 by the end of September. In April 2025 it fell below $200, then gained 58% in a month. The first bounce usually fails — the durable move comes after a higher low, and only when the macro cooperates. This time the macro is a Fed hike and a $62K Bitcoin.
Grayscale's spot TAO ETF filing is still pending — a filing, not an approval. The honest read: TAO is the AI token with a real network, real revenue growth, and a price crushed 27% in a month and 41% in a year. Tap $TAO to watch the $201 line — a daily close above it, or a loss of $185, tells you which story wins.
Are you watching the revenue, or the price?
Not financial advice. DYOR.
So what just happened? TAO climbed back to ~$197 after closing at $183.76 on 14 November, testing the $185–$188 zone twice and holding it. Not a breakout. Not a reversal. But in a market where Fear & Greed is pinned at 10 — Extreme Fear — even a held support line is a story.
Here's the setup. Nvidia reported $115.8 billion in Q3 revenue on 17 November, beating the ~$109.5 billion consensus, with Q4 guidance of ~$130 billion. Anthropic is pricing its Nasdaq IPO today at $70–$78 a share. The AI machine in the real world is printing money — and AI tokens finally twitched: $NEAR rose ~3.4%, $RENDER ~2.7%, TAO a few percent off its weekend lows.
But notice what didn't happen. Crypto barely reacted. Bitcoin is still hovering around $64–65K after crashing to $62,006 over the weekend, spot BTC ETFs have bled $1.91 billion across seven straight sessions, and a December Fed rate hike is now ~90% priced. As Nansen's Nicolai Sondergaard put it, AI and crypto draw on the same pool of risk capital — when Nvidia sells off, the money goes to cash, not into Bitcoin.
So why is TAO the one to watch? Because the crowd is doing something strange. LunarCrush has TAO at AltRank #2 with engagements up 5,231% in a week — 60.1 million in a day — while its sentiment gauge sits at 28%, near a one-year low. New attention is flooding in. Old holders are cautious. That split is exactly what the last two TAO bottoms looked like.
Look at the levels. Support is the $185–$188 zone TAO defended on 15–16 November; lose it on a daily close and $180, then $150, come into play. Resistance is $201, the first daily-close trigger; above that sits $210, then $226. A close above $201 changes the conversation. Below $185, the bounce was just a bounce.
And here's the tension underneath the price. Bittensor's subnets now generate roughly $70 million in annualised revenue, double the ~$35 million of September — one GPU-rental subnet alone did $2.7 million of customer spend in 31 days. Yet the network still emits ~3,600 TAO a day, roughly $256 million a year at current prices. Revenue covers maybe a tenth of that. The story is real. The subsidy is bigger.
History says this zone matters. In August 2024 TAO bottomed near $164–$180, ripped 75% in a week, failed at $300, then ran 174% to $605 by the end of September. In April 2025 it fell below $200, then gained 58% in a month. The first bounce usually fails — the durable move comes after a higher low, and only when the macro cooperates. This time the macro is a Fed hike and a $62K Bitcoin.
Grayscale's spot TAO ETF filing is still pending — a filing, not an approval. The honest read: TAO is the AI token with a real network, real revenue growth, and a price crushed 27% in a month and 41% in a year. Tap $TAO to watch the $201 line — a daily close above it, or a loss of $185, tells you which story wins.
Are you watching the revenue, or the price?
Not financial advice. DYOR.
2
Article
Voir la traduction
Fear Is at 11. ETFs Flipped Red Again. The Fed Decides NextFear is at 11. The ETF bleed is back. And in a few hours, the Fed gets its say.
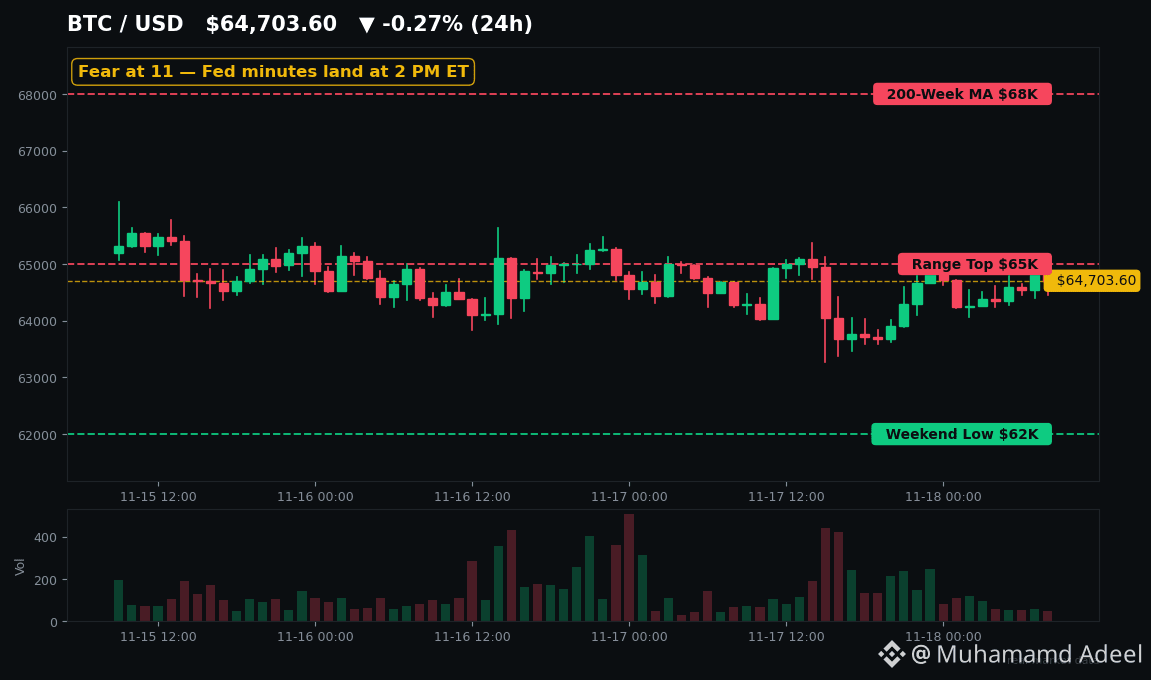
$BTC is coiled under $65K — and today decides whether this is a bottom, or just a pause before the next leg down.
1. THE FED MINUTES LAND AT 2 PM ET
The minutes from the Fed's October meeting drop today at 2:00 PM ET, and traders are treating it like a rate decision. The October vote was a split 10–2 — two officials dissented, arguing for a hike. Markets now price a ~97% chance of a 25bp hike on December 9.
Here's what this really means: the hike is priced in, the path is not. Galaxy's Mike Novogratz said this week he expects two or three more hikes — and called a $BTC return to $90K by year-end "unlikely now." Watch January hike odds — that's the number that moves Bitcoin.
2. ETF WHIPLASH: ONE GREEN DAY, THEN $240M OUT
Monday gave the bulls exactly one day of hope: spot BTC ETFs took in +$7.9M, the first inflow in eight sessions. Tuesday took it straight back — -$239.9M in net outflows, with BlackRock's IBIT alone shedding -$209.5M. $ETH ETFs lost -$29.1M the same day.
November is now -$2.58B for BTC ETFs. One green print is not a flip — it's a breather. Until inflows string together, the institutional bid is still missing.
3. ON-CHAIN SAYS CAPITULATION — WITHOUT THE PANIC
CryptoQuant just called it: Bitcoin is back in a bearish phase. Short-term holders sold at an average 4.5% loss — STH-SOPR hit 0.955, its lowest since February — and one day saw $1.65B in realized losses, the heaviest since July. Only 52% of supply is still in profit, and futures open interest is at its lowest since late 2024.
But here's the twist: exchanges saw net BTC outflows of ~9,000 BTC in the last 24 hours. Coins are leaving exchanges, not flooding in — exhausted holders and ETF redemptions, not a leveraged cascade.
4. THE SELLERS NOBODY TALKS ABOUT: MINERS AND STRATEGY
Miner MARA sold another 1,714 BTC (~$121M) in eight days — 14 listed firms have now sold ~108,000 BTC in 2026 to fund their AI pivot. And Strategy just closed under $100, down ~24% in a month. MSCI drops it from its indexes after November 30, which could force ~$1.6B of index selling, and its premium to NAV has compressed to ~1.08x. Strategy's 850,364 BTC are now worth less than what it paid for them — the biggest corporate buyer is underwater and losing its passive bid.
SO WHAT NOW?
The levels are simple: $62K is the floor that held over the weekend. $65K is the ceiling that keeps rejecting every bounce. Above that sits the 200-week average near $68K. History is blunt: the last three times BTC broke its 200-week average this hard, price fell another 10–17% first.
Oversold is not bottomed. $SOL is the one bright spot, up ~3–5% while BTC went flat — but one altcoin doesn't change the tape.
Check $BTC's chart before the minutes land. Today decides the next $5K move.
Not financial advice. DYOR.
Fear Is at 11. ETFs Flipped Red Again. The Fed Decides Next
Fear is at 11. The ETF bleed is back. And in a few hours, the Fed gets its say.
$BTC is coiled under $65K — and today decides whether this is a bottom, or just a pause before the next leg down.
1. THE FED MINUTES LAND AT 2 PM ET
The minutes from the Fed's October meeting drop today at 2:00 PM ET, and traders are treating it like a rate decision. The October vote was a split 10–2 — two officials dissented, arguing for a hike. Markets now price a ~97% chance of a 25bp hike on December 9.
Here's what this really means: the hike is priced in, the path is not. Galaxy's Mike Novogratz said this week he expects two or three more hikes — and called a $BTC return to $90K by year-end "unlikely now." Watch January hike odds — that's the number that moves Bitcoin.
2. ETF WHIPLASH: ONE GREEN DAY, THEN $240M OUT
Monday gave the bulls exactly one day of hope: spot BTC ETFs took in +$7.9M, the first inflow in eight sessions. Tuesday took it straight back — -$239.9M in net outflows, with BlackRock's IBIT alone shedding -$209.5M. $ETH ETFs lost -$29.1M the same day.
November is now -$2.58B for BTC ETFs. One green print is not a flip — it's a breather. Until inflows string together, the institutional bid is still missing.
3. ON-CHAIN SAYS CAPITULATION — WITHOUT THE PANIC
CryptoQuant just called it: Bitcoin is back in a bearish phase. Short-term holders sold at an average 4.5% loss — STH-SOPR hit 0.955, its lowest since February — and one day saw $1.65B in realized losses, the heaviest since July. Only 52% of supply is still in profit, and futures open interest is at its lowest since late 2024.
But here's the twist: exchanges saw net BTC outflows of ~9,000 BTC in the last 24 hours. Coins are leaving exchanges, not flooding in — exhausted holders and ETF redemptions, not a leveraged cascade.
4. THE SELLERS NOBODY TALKS ABOUT: MINERS AND STRATEGY
Miner MARA sold another 1,714 BTC (~$121M) in eight days — 14 listed firms have now sold ~108,000 BTC in 2026 to fund their AI pivot. And Strategy just closed under $100, down ~24% in a month. MSCI drops it from its indexes after November 30, which could force ~$1.6B of index selling, and its premium to NAV has compressed to ~1.08x. Strategy's 850,364 BTC are now worth less than what it paid for them — the biggest corporate buyer is underwater and losing its passive bid.
SO WHAT NOW?
The levels are simple: $62K is the floor that held over the weekend. $65K is the ceiling that keeps rejecting every bounce. Above that sits the 200-week average near $68K. History is blunt: the last three times BTC broke its 200-week average this hard, price fell another 10–17% first.
Oversold is not bottomed. $SOL is the one bright spot, up ~3–5% while BTC went flat — but one altcoin doesn't change the tape.
Check $BTC 's chart before the minutes land. Today decides the next $5K move.
Not financial advice. DYOR.
$BTC is coiled under $65K — and today decides whether this is a bottom, or just a pause before the next leg down.
1. THE FED MINUTES LAND AT 2 PM ET
The minutes from the Fed's October meeting drop today at 2:00 PM ET, and traders are treating it like a rate decision. The October vote was a split 10–2 — two officials dissented, arguing for a hike. Markets now price a ~97% chance of a 25bp hike on December 9.
Here's what this really means: the hike is priced in, the path is not. Galaxy's Mike Novogratz said this week he expects two or three more hikes — and called a $BTC return to $90K by year-end "unlikely now." Watch January hike odds — that's the number that moves Bitcoin.
2. ETF WHIPLASH: ONE GREEN DAY, THEN $240M OUT
Monday gave the bulls exactly one day of hope: spot BTC ETFs took in +$7.9M, the first inflow in eight sessions. Tuesday took it straight back — -$239.9M in net outflows, with BlackRock's IBIT alone shedding -$209.5M. $ETH ETFs lost -$29.1M the same day.
November is now -$2.58B for BTC ETFs. One green print is not a flip — it's a breather. Until inflows string together, the institutional bid is still missing.
3. ON-CHAIN SAYS CAPITULATION — WITHOUT THE PANIC
CryptoQuant just called it: Bitcoin is back in a bearish phase. Short-term holders sold at an average 4.5% loss — STH-SOPR hit 0.955, its lowest since February — and one day saw $1.65B in realized losses, the heaviest since July. Only 52% of supply is still in profit, and futures open interest is at its lowest since late 2024.
But here's the twist: exchanges saw net BTC outflows of ~9,000 BTC in the last 24 hours. Coins are leaving exchanges, not flooding in — exhausted holders and ETF redemptions, not a leveraged cascade.
4. THE SELLERS NOBODY TALKS ABOUT: MINERS AND STRATEGY
Miner MARA sold another 1,714 BTC (~$121M) in eight days — 14 listed firms have now sold ~108,000 BTC in 2026 to fund their AI pivot. And Strategy just closed under $100, down ~24% in a month. MSCI drops it from its indexes after November 30, which could force ~$1.6B of index selling, and its premium to NAV has compressed to ~1.08x. Strategy's 850,364 BTC are now worth less than what it paid for them — the biggest corporate buyer is underwater and losing its passive bid.
SO WHAT NOW?
The levels are simple: $62K is the floor that held over the weekend. $65K is the ceiling that keeps rejecting every bounce. Above that sits the 200-week average near $68K. History is blunt: the last three times BTC broke its 200-week average this hard, price fell another 10–17% first.
Oversold is not bottomed. $SOL is the one bright spot, up ~3–5% while BTC went flat — but one altcoin doesn't change the tape.
Check $BTC 's chart before the minutes land. Today decides the next $5K move.
Not financial advice. DYOR.
1
Article
Voir la traduction
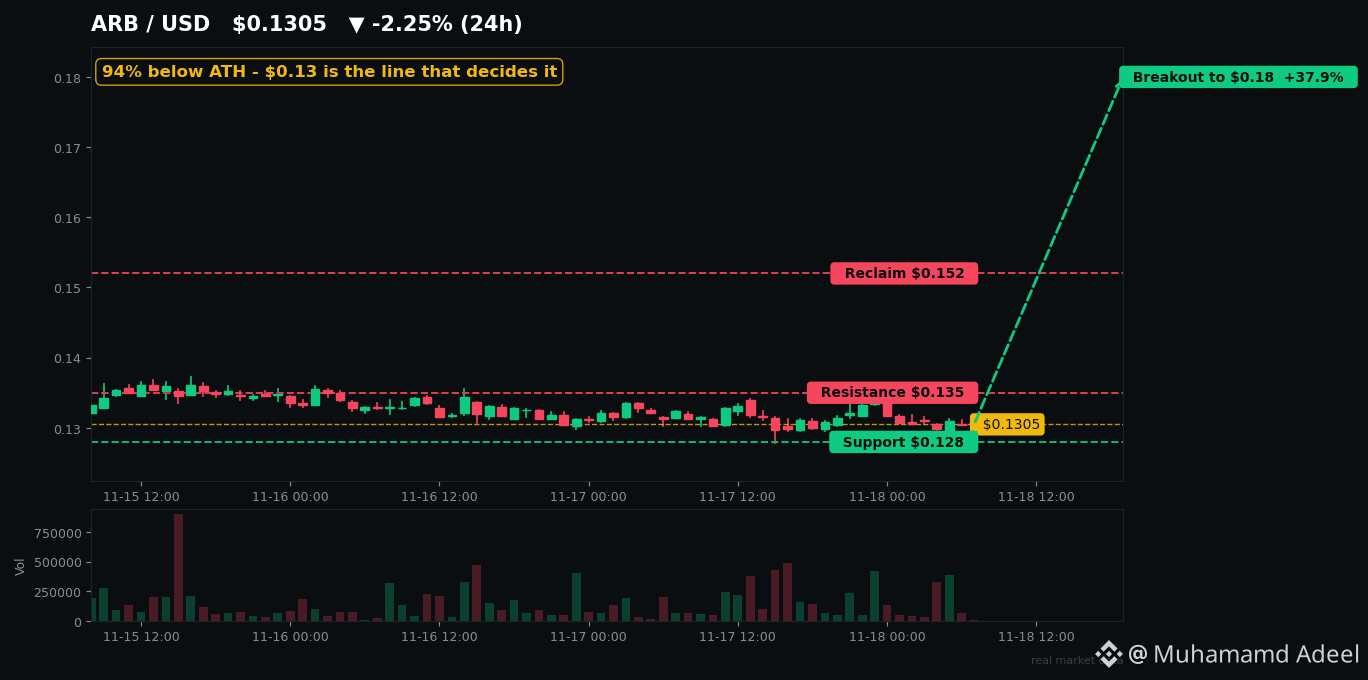
ARB Is 94% Below Its Peak — and a Major Bank Just Called $10Down 94% from its peak — and a major bank just called $10.
That's the contradiction staring at you with $ARB right now. Arbitrum trades at ~$0.13, down ~20% in a week and ~33% in a month. Fear & Greed is at 11 — Extreme Fear. And yet Standard Chartered still has ARB at $0.50 by year-end and $10 by 2030.
So who's wrong — the market, or the bank?
First, the pain is real — and here's exactly why. On 16 November, a reported 92.65M ARB unlocked to team and investors — roughly $12.5M of fresh supply into a market already in extreme fear. More of the same land monthly until March 2027, next on 16 December — the overhang on every bounce.
Here's the uncomfortable truth the bulls skip: ARB is a governance token. Gas on Arbitrum is paid in $ETH, not ARB. Holders get no cut of network revenue — no fee switch, no burn, no yield. The chain can boom while the token bleeds, and lately that's exactly what's happening.
Because the chain IS busy. Arbitrum One still holds ~$1.3B in DeFi TVL and $4.06B in stablecoins — and on 15 November it added $91.8M of stablecoins in one day, the biggest inflow of any major network that day. Cross River Bank and Harvest Finance joined as ecosystem partners on 17 November. The network is earning. The token is not following.
History says this disconnect doesn't last forever — in either direction. ARB bottomed at $0.071 in June 2026, then ran to $0.256 by September — a 260% move in under three months — then gave back half of it. In the October 2025 crash it wicked toward $0.10 and bounced ~3x within weeks. ARB's bottoms have been violent wicks, not slow grinds — but every bounce needed a real catalyst, and when it faded, so did the rally.
So watch the levels — this is where it gets decided. $ARB is sitting right on $0.13, the line a falling-wedge setup says must hold. Support sits at $0.128, then $0.123, then $0.11. Lose $0.13 and the setup breaks. Above, $0.135 is the first wall, then $0.152 — the level that used to be support — and $0.18, where a confirmed break opens the door toward $0.28. RSI sits near 31–35, close to oversold but not screaming capitulation yet.
Rival check: $OP is in the same boat — a fresh all-time low near $0.076 last week — while Base, with no token at all, keeps leading the L2 race on activity. It's not about who's biggest anymore. It's about whose token captures value.
Here's my take: ARB at $0.13 is a bet that the chain's activity eventually matters to the token — or that the unlock selling finally exhausts itself. Neither is guaranteed. But at 94% below its peak, with the chain still doing ~$2.4B a day in perps volume, this is the kind of setup that separates people who buy fear from people who buy headlines.
Keep your eyes on the $ARB chart at $0.13. That's the line that decides the next move.
Not financial advice. DYOR.
ARB Is 94% Below Its Peak — and a Major Bank Just Called $10
Down 94% from its peak — and a major bank just called $10.
That's the contradiction staring at you with $ARB right now. Arbitrum trades at ~$0.13, down ~20% in a week and ~33% in a month. Fear & Greed is at 11 — Extreme Fear. And yet Standard Chartered still has ARB at $0.50 by year-end and $10 by 2030.
So who's wrong — the market, or the bank?
First, the pain is real — and here's exactly why. On 16 November, a reported 92.65M ARB unlocked to team and investors — roughly $12.5M of fresh supply into a market already in extreme fear. More of the same land monthly until March 2027, next on 16 December — the overhang on every bounce.
Here's the uncomfortable truth the bulls skip: ARB is a governance token. Gas on Arbitrum is paid in $ETH , not ARB. Holders get no cut of network revenue — no fee switch, no burn, no yield. The chain can boom while the token bleeds, and lately that's exactly what's happening.
Because the chain IS busy. Arbitrum One still holds ~$1.3B in DeFi TVL and $4.06B in stablecoins — and on 15 November it added $91.8M of stablecoins in one day, the biggest inflow of any major network that day. Cross River Bank and Harvest Finance joined as ecosystem partners on 17 November. The network is earning. The token is not following.
History says this disconnect doesn't last forever — in either direction. ARB bottomed at $0.071 in June 2026, then ran to $0.256 by September — a 260% move in under three months — then gave back half of it. In the October 2025 crash it wicked toward $0.10 and bounced ~3x within weeks. ARB's bottoms have been violent wicks, not slow grinds — but every bounce needed a real catalyst, and when it faded, so did the rally.
So watch the levels — this is where it gets decided. $ARB is sitting right on $0.13, the line a falling-wedge setup says must hold. Support sits at $0.128, then $0.123, then $0.11. Lose $0.13 and the setup breaks. Above, $0.135 is the first wall, then $0.152 — the level that used to be support — and $0.18, where a confirmed break opens the door toward $0.28. RSI sits near 31–35, close to oversold but not screaming capitulation yet.
Rival check: $OP is in the same boat — a fresh all-time low near $0.076 last week — while Base, with no token at all, keeps leading the L2 race on activity. It's not about who's biggest anymore. It's about whose token captures value.
Here's my take: ARB at $0.13 is a bet that the chain's activity eventually matters to the token — or that the unlock selling finally exhausts itself. Neither is guaranteed. But at 94% below its peak, with the chain still doing ~$2.4B a day in perps volume, this is the kind of setup that separates people who buy fear from people who buy headlines.
Keep your eyes on the $ARB chart at $0.13. That's the line that decides the next move.
Not financial advice. DYOR.
That's the contradiction staring at you with $ARB right now. Arbitrum trades at ~$0.13, down ~20% in a week and ~33% in a month. Fear & Greed is at 11 — Extreme Fear. And yet Standard Chartered still has ARB at $0.50 by year-end and $10 by 2030.
So who's wrong — the market, or the bank?
First, the pain is real — and here's exactly why. On 16 November, a reported 92.65M ARB unlocked to team and investors — roughly $12.5M of fresh supply into a market already in extreme fear. More of the same land monthly until March 2027, next on 16 December — the overhang on every bounce.
Here's the uncomfortable truth the bulls skip: ARB is a governance token. Gas on Arbitrum is paid in $ETH , not ARB. Holders get no cut of network revenue — no fee switch, no burn, no yield. The chain can boom while the token bleeds, and lately that's exactly what's happening.
Because the chain IS busy. Arbitrum One still holds ~$1.3B in DeFi TVL and $4.06B in stablecoins — and on 15 November it added $91.8M of stablecoins in one day, the biggest inflow of any major network that day. Cross River Bank and Harvest Finance joined as ecosystem partners on 17 November. The network is earning. The token is not following.
History says this disconnect doesn't last forever — in either direction. ARB bottomed at $0.071 in June 2026, then ran to $0.256 by September — a 260% move in under three months — then gave back half of it. In the October 2025 crash it wicked toward $0.10 and bounced ~3x within weeks. ARB's bottoms have been violent wicks, not slow grinds — but every bounce needed a real catalyst, and when it faded, so did the rally.
So watch the levels — this is where it gets decided. $ARB is sitting right on $0.13, the line a falling-wedge setup says must hold. Support sits at $0.128, then $0.123, then $0.11. Lose $0.13 and the setup breaks. Above, $0.135 is the first wall, then $0.152 — the level that used to be support — and $0.18, where a confirmed break opens the door toward $0.28. RSI sits near 31–35, close to oversold but not screaming capitulation yet.
Rival check: $OP is in the same boat — a fresh all-time low near $0.076 last week — while Base, with no token at all, keeps leading the L2 race on activity. It's not about who's biggest anymore. It's about whose token captures value.
Here's my take: ARB at $0.13 is a bet that the chain's activity eventually matters to the token — or that the unlock selling finally exhausts itself. Neither is guaranteed. But at 94% below its peak, with the chain still doing ~$2.4B a day in perps volume, this is the kind of setup that separates people who buy fear from people who buy headlines.
Keep your eyes on the $ARB chart at $0.13. That's the line that decides the next move.
Not financial advice. DYOR.
9
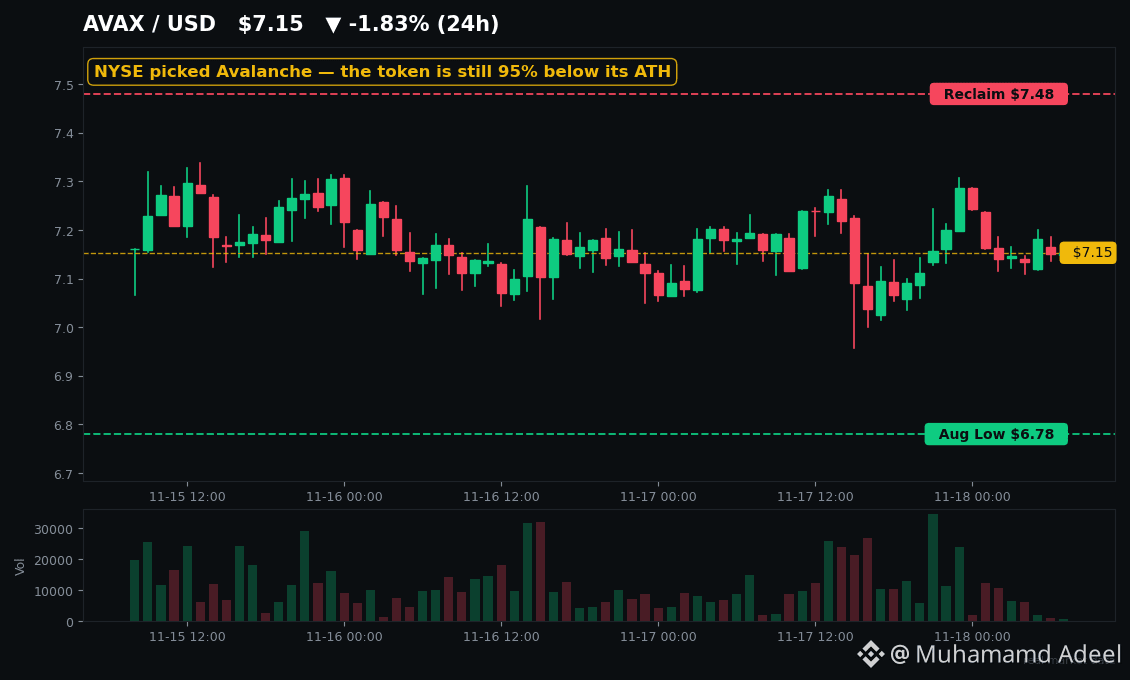
Article
Voir la traduction
NYSE Picked Avalanche — So Why Is AVAX Still at $7.15?The New York Stock Exchange just picked Avalanche to settle tokenized stocks.
So why is $AVAX still sitting at $7.15 — 95% below its all-time high?
That's the question nobody in the comments wants to answer honestly. So let's do it.
On 9 November, Ava Labs announced Avalanche will power the ledger for the clearing firm behind an NYSE-affiliated platform for 24/7 tokenized-stock trading. Wall Street's biggest name, choosing this chain. The market loved it for about a day — AVAX spiked roughly 9% toward $9.
Then reality showed up. By 14 November, AVAX had given the whole move back, crashing 13.8% in a single day to $7.08 — the worst fall among the top 25 coins that day. This morning it's $7.15, down 16% in a week and 25% in a month.
Here's the uncomfortable part: the NYSE deal doesn't actually use the AVAX token — at least not in anything disclosed so far. The venue runs on its own custom Avalanche chain, not the public network, trades settle in stablecoins, and it still needs regulatory approval. That's infrastructure praise, not a demand story for the token.
And the chart agrees with the skeptics. AVAX trades below every major moving average, daily RSI is hovering around 34, and $6.78 — the August swing low — is the line that has to hold. Lose it and the next reference point is the June low near $5.89. Reclaim $7.48 and the conversation changes. That's the whole setup, right there on $AVAX's chart.
But — and this is why you can't just write AVAX off — the network itself hasn't died. DEX volume reportedly jumped 31% last week, Aave V4 deposits on Avalanche are up roughly 295% since late October, and Avalanche ETFs were the only US spot crypto ETFs with positive flows on 13 November. Even the treasury companies are all-in: Nasdaq-listed AVAX One holds 14.17 million AVAX, almost all of it staked.
History says this zone matters. The last time AVAX sat near $9, in September 2023, it ran to almost $50 within three months — on institutional news plus an on-chain activity spike. The difference now? The activity spike hasn't shown up yet. The NYSE pop faded in five days because there was no second ingredient.
And $SOL is chasing the same prize — ICE is reportedly weighing becoming a Solana validator too. This race isn't won yet.
So here's the take: AVAX isn't a "Wall Street chose us" victory lap. It's a test. The validation is real, the token demand isn't — yet. $BTC sets the weather here, and with Bitcoin at roughly $64,500 and fear at 11 out of 100, nobody gets a free pass. Watch $6.78. If it holds while the network numbers keep creeping up, this is where the story flips. If it breaks, the NYSE headline won't save it.
Check $AVAX's chart — does $7.15 flip back to support, or does $6.78 give way first?
Not financial advice. DYOR.
NYSE Picked Avalanche — So Why Is AVAX Still at $7.15?
The New York Stock Exchange just picked Avalanche to settle tokenized stocks.
So why is $AVAX still sitting at $7.15 — 95% below its all-time high?
That's the question nobody in the comments wants to answer honestly. So let's do it.
On 9 November, Ava Labs announced Avalanche will power the ledger for the clearing firm behind an NYSE-affiliated platform for 24/7 tokenized-stock trading. Wall Street's biggest name, choosing this chain. The market loved it for about a day — AVAX spiked roughly 9% toward $9.
Then reality showed up. By 14 November, AVAX had given the whole move back, crashing 13.8% in a single day to $7.08 — the worst fall among the top 25 coins that day. This morning it's $7.15, down 16% in a week and 25% in a month.
Here's the uncomfortable part: the NYSE deal doesn't actually use the AVAX token — at least not in anything disclosed so far. The venue runs on its own custom Avalanche chain, not the public network, trades settle in stablecoins, and it still needs regulatory approval. That's infrastructure praise, not a demand story for the token.
And the chart agrees with the skeptics. AVAX trades below every major moving average, daily RSI is hovering around 34, and $6.78 — the August swing low — is the line that has to hold. Lose it and the next reference point is the June low near $5.89. Reclaim $7.48 and the conversation changes. That's the whole setup, right there on $AVAX 's chart.
But — and this is why you can't just write AVAX off — the network itself hasn't died. DEX volume reportedly jumped 31% last week, Aave V4 deposits on Avalanche are up roughly 295% since late October, and Avalanche ETFs were the only US spot crypto ETFs with positive flows on 13 November. Even the treasury companies are all-in: Nasdaq-listed AVAX One holds 14.17 million AVAX, almost all of it staked.
History says this zone matters. The last time AVAX sat near $9, in September 2023, it ran to almost $50 within three months — on institutional news plus an on-chain activity spike. The difference now? The activity spike hasn't shown up yet. The NYSE pop faded in five days because there was no second ingredient.
And $SOL is chasing the same prize — ICE is reportedly weighing becoming a Solana validator too. This race isn't won yet.
So here's the take: AVAX isn't a "Wall Street chose us" victory lap. It's a test. The validation is real, the token demand isn't — yet. $BTC sets the weather here, and with Bitcoin at roughly $64,500 and fear at 11 out of 100, nobody gets a free pass. Watch $6.78. If it holds while the network numbers keep creeping up, this is where the story flips. If it breaks, the NYSE headline won't save it.
Check $AVAX 's chart — does $7.15 flip back to support, or does $6.78 give way first?
Not financial advice. DYOR.
So why is $AVAX still sitting at $7.15 — 95% below its all-time high?
That's the question nobody in the comments wants to answer honestly. So let's do it.
On 9 November, Ava Labs announced Avalanche will power the ledger for the clearing firm behind an NYSE-affiliated platform for 24/7 tokenized-stock trading. Wall Street's biggest name, choosing this chain. The market loved it for about a day — AVAX spiked roughly 9% toward $9.
Then reality showed up. By 14 November, AVAX had given the whole move back, crashing 13.8% in a single day to $7.08 — the worst fall among the top 25 coins that day. This morning it's $7.15, down 16% in a week and 25% in a month.
Here's the uncomfortable part: the NYSE deal doesn't actually use the AVAX token — at least not in anything disclosed so far. The venue runs on its own custom Avalanche chain, not the public network, trades settle in stablecoins, and it still needs regulatory approval. That's infrastructure praise, not a demand story for the token.
And the chart agrees with the skeptics. AVAX trades below every major moving average, daily RSI is hovering around 34, and $6.78 — the August swing low — is the line that has to hold. Lose it and the next reference point is the June low near $5.89. Reclaim $7.48 and the conversation changes. That's the whole setup, right there on $AVAX 's chart.
But — and this is why you can't just write AVAX off — the network itself hasn't died. DEX volume reportedly jumped 31% last week, Aave V4 deposits on Avalanche are up roughly 295% since late October, and Avalanche ETFs were the only US spot crypto ETFs with positive flows on 13 November. Even the treasury companies are all-in: Nasdaq-listed AVAX One holds 14.17 million AVAX, almost all of it staked.
History says this zone matters. The last time AVAX sat near $9, in September 2023, it ran to almost $50 within three months — on institutional news plus an on-chain activity spike. The difference now? The activity spike hasn't shown up yet. The NYSE pop faded in five days because there was no second ingredient.
And $SOL is chasing the same prize — ICE is reportedly weighing becoming a Solana validator too. This race isn't won yet.
So here's the take: AVAX isn't a "Wall Street chose us" victory lap. It's a test. The validation is real, the token demand isn't — yet. $BTC sets the weather here, and with Bitcoin at roughly $64,500 and fear at 11 out of 100, nobody gets a free pass. Watch $6.78. If it holds while the network numbers keep creeping up, this is where the story flips. If it breaks, the NYSE headline won't save it.
Check $AVAX 's chart — does $7.15 flip back to support, or does $6.78 give way first?
Not financial advice. DYOR.
30
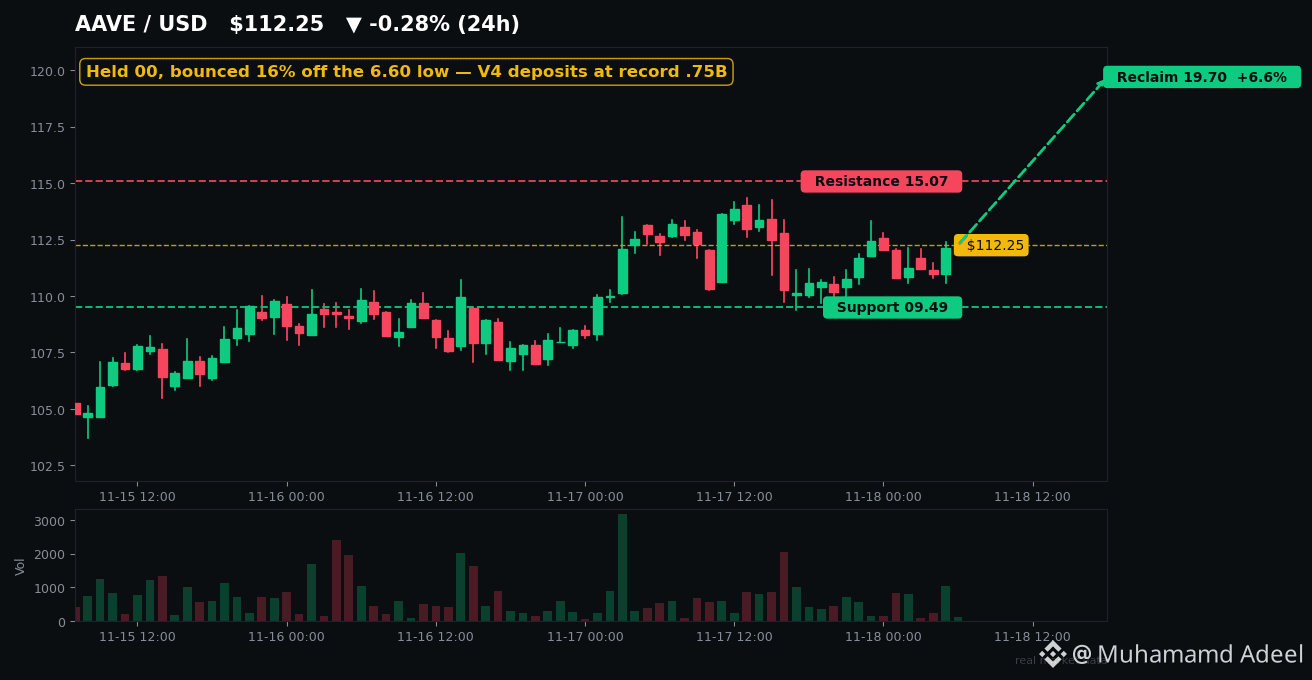
Article
Voir la traduction
AAVE Held $100 While BTC Crashed — and Just Launched on Sony's ChainBitcoin crashed to $62K. Fear & Greed is sitting at 11 — Extreme Fear.
And yet $AAVE just held $100, bounced 16% off its lows, and launched on Sony's blockchain today.
Let that sink in. The token is down 25% in a month. The protocol? It's printing.
Here's the divergence nobody's talking about.
Aave still holds ~$15.1B in TVL — the #1 lending protocol in DeFi, about a fifth of all DeFi TVL. In the last 30 days it collected $41.8M in fees. When the crash hit, $39M of borrowers got liquidated in two days — and the protocol absorbed every cent of it with zero bad debt. That's not luck. That's the machine working exactly as designed.
And the growth story hasn't paused for the panic. Aave V4 deposits just hit a record $1.75B — more than double where they were in late August. Today, Aave went live on Soneium, Sony's Ethereum L2, reaching a 7-million-user ecosystem with fresh liquidity incentives. Yesterday it brought USDT deposits to its mobile app on TRON.
So why is the token bleeding? Because the market isn't pricing the protocol. It's pricing fear.
$AAVE is sitting around $112, caught between two lines that decide everything. Support is $109.49 — lose it on a daily close and the $96.60 low from 15 November is back in play, with $88 below that. Resistance is $115.07, then $119.70. Reclaim $119.70 and the whole structure flips — that's the level every trader is watching. Check the $AAVE chart and you'll see it: a tight range, coiled, waiting for a trigger.
Now the honest part. This isn't a victory lap.
Q3 protocol revenue fell 36.6% quarter-on-quarter to $17.29M. A whale dumped $25.5M of AAVE onto exchanges over ten days in early November. And there's a live liquidation watch: Nasdaq-listed BTCS owes $64M on Aave, backed by ETH — its liquidation line sits near $1,717 per $ETH. If ETH cracks, that position gets sold into an already panicked market. Add December Fed hike odds near 90% and $BTC ETF outflows, and you can see why buyers are hesitant.
But history has a pattern here — and it's worth knowing.
The last time Aave got hit this hard was August 2024. $AAVE bottomed at $76.15 in the yen carry-trade unwind. It bounced 30% within days. By December it was at $399. Every crash since 2021 has followed the same script: token falls, liquidations spike, the protocol earns fees from the chaos, and the bounce off the bottom is violent.
Will this time be different? Nobody knows — and anyone who tells you otherwise is selling something.
Here's my take: the protocol is winning and the token is lagging. That gap has closed violently before. The trigger is $119.70. Until then, this is a range trade in Extreme Fear — not a victory, not a funeral.
Not financial advice. DYOR.
AAVE Held $100 While BTC Crashed — and Just Launched on Sony's Chain
Bitcoin crashed to $62K. Fear & Greed is sitting at 11 — Extreme Fear.
And yet $AAVE just held $100, bounced 16% off its lows, and launched on Sony's blockchain today.
Let that sink in. The token is down 25% in a month. The protocol? It's printing.
Here's the divergence nobody's talking about.
Aave still holds ~$15.1B in TVL — the #1 lending protocol in DeFi, about a fifth of all DeFi TVL. In the last 30 days it collected $41.8M in fees. When the crash hit, $39M of borrowers got liquidated in two days — and the protocol absorbed every cent of it with zero bad debt. That's not luck. That's the machine working exactly as designed.
And the growth story hasn't paused for the panic. Aave V4 deposits just hit a record $1.75B — more than double where they were in late August. Today, Aave went live on Soneium, Sony's Ethereum L2, reaching a 7-million-user ecosystem with fresh liquidity incentives. Yesterday it brought USDT deposits to its mobile app on TRON.
So why is the token bleeding? Because the market isn't pricing the protocol. It's pricing fear.
$AAVE is sitting around $112, caught between two lines that decide everything. Support is $109.49 — lose it on a daily close and the $96.60 low from 15 November is back in play, with $88 below that. Resistance is $115.07, then $119.70. Reclaim $119.70 and the whole structure flips — that's the level every trader is watching. Check the $AAVE chart and you'll see it: a tight range, coiled, waiting for a trigger.
Now the honest part. This isn't a victory lap.
Q3 protocol revenue fell 36.6% quarter-on-quarter to $17.29M. A whale dumped $25.5M of AAVE onto exchanges over ten days in early November. And there's a live liquidation watch: Nasdaq-listed BTCS owes $64M on Aave, backed by ETH — its liquidation line sits near $1,717 per $ETH . If ETH cracks, that position gets sold into an already panicked market. Add December Fed hike odds near 90% and $BTC ETF outflows, and you can see why buyers are hesitant.
But history has a pattern here — and it's worth knowing.
The last time Aave got hit this hard was August 2024. $AAVE bottomed at $76.15 in the yen carry-trade unwind. It bounced 30% within days. By December it was at $399. Every crash since 2021 has followed the same script: token falls, liquidations spike, the protocol earns fees from the chaos, and the bounce off the bottom is violent.
Will this time be different? Nobody knows — and anyone who tells you otherwise is selling something.
Here's my take: the protocol is winning and the token is lagging. That gap has closed violently before. The trigger is $119.70. Until then, this is a range trade in Extreme Fear — not a victory, not a funeral.
Not financial advice. DYOR.
And yet $AAVE just held $100, bounced 16% off its lows, and launched on Sony's blockchain today.
Let that sink in. The token is down 25% in a month. The protocol? It's printing.
Here's the divergence nobody's talking about.
Aave still holds ~$15.1B in TVL — the #1 lending protocol in DeFi, about a fifth of all DeFi TVL. In the last 30 days it collected $41.8M in fees. When the crash hit, $39M of borrowers got liquidated in two days — and the protocol absorbed every cent of it with zero bad debt. That's not luck. That's the machine working exactly as designed.
And the growth story hasn't paused for the panic. Aave V4 deposits just hit a record $1.75B — more than double where they were in late August. Today, Aave went live on Soneium, Sony's Ethereum L2, reaching a 7-million-user ecosystem with fresh liquidity incentives. Yesterday it brought USDT deposits to its mobile app on TRON.
So why is the token bleeding? Because the market isn't pricing the protocol. It's pricing fear.
$AAVE is sitting around $112, caught between two lines that decide everything. Support is $109.49 — lose it on a daily close and the $96.60 low from 15 November is back in play, with $88 below that. Resistance is $115.07, then $119.70. Reclaim $119.70 and the whole structure flips — that's the level every trader is watching. Check the $AAVE chart and you'll see it: a tight range, coiled, waiting for a trigger.
Now the honest part. This isn't a victory lap.
Q3 protocol revenue fell 36.6% quarter-on-quarter to $17.29M. A whale dumped $25.5M of AAVE onto exchanges over ten days in early November. And there's a live liquidation watch: Nasdaq-listed BTCS owes $64M on Aave, backed by ETH — its liquidation line sits near $1,717 per $ETH . If ETH cracks, that position gets sold into an already panicked market. Add December Fed hike odds near 90% and $BTC ETF outflows, and you can see why buyers are hesitant.
But history has a pattern here — and it's worth knowing.
The last time Aave got hit this hard was August 2024. $AAVE bottomed at $76.15 in the yen carry-trade unwind. It bounced 30% within days. By December it was at $399. Every crash since 2021 has followed the same script: token falls, liquidations spike, the protocol earns fees from the chaos, and the bounce off the bottom is violent.
Will this time be different? Nobody knows — and anyone who tells you otherwise is selling something.
Here's my take: the protocol is winning and the token is lagging. That gap has closed violently before. The trigger is $119.70. Until then, this is a range trade in Extreme Fear — not a victory, not a funeral.
Not financial advice. DYOR.
27
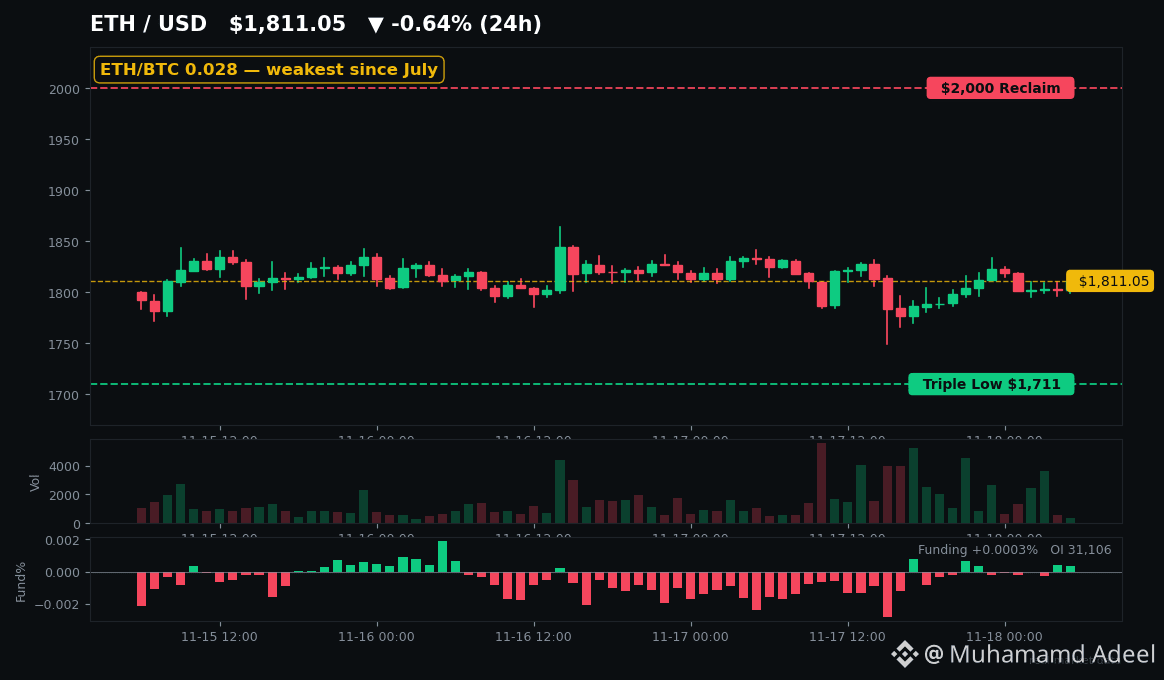
Article
Voir la traduction
ETH Is at Its Weakest vs BTC Since July — While SOL and XRP Split AwayOne ETH buys you 0.028 BTC.
That's the weakest Ethereum has looked against $BTC since July — down 67% from the ratio's 2021 peak. And while ETH fades, the majors just split in three directions.
Here's the number that matters. $ETH is trading around $1,810 — down 12% in a week, 24% in a month — after tagging $1,711 on Sunday, its lowest since July. The ETH/BTC ratio sits at 0.028. Traders watching the turn have a clear line: a daily close back above 0.0298 is the first sign the tide is turning. Below 0.0283, Bitcoin keeps winning the trade.
Now the split. Solana bounced 3% today and 5% yesterday, holding $75 while ETH slipped. XRP gained 2% and is pressing up against $1.00 — and its whales just pulled more than $127M of XRP off Binance in a week, into cold wallets, not onto exchanges. $SOL is the one major acting like it wants to lead. ETH is the one acting like it wants to sleep.
So why is ETH the laggard? Start with the flows. US spot Ether ETFs just logged their seventh straight week of outflows — $398.9M last week alone, $2.4B over the seven weeks. Monday brought another $8.3M out; Tuesday's $1.3M inflow was a trickle, not a turn.
Then the upgrade drama. Ethereum's Glamsterdam upgrade is in dispute after core devs warned the gas-limit hike could break 10,000–15,000 smart contracts. A decision lands Thursday. And derivatives traders have already voted with their feet: ETH futures open interest is $9.12B, the lowest since October 2024.
But here's the tension — the on-chain picture refuses to agree with the price. ETH on exchanges just hit a 10-year low of ~14.4M coins. A record 44.6M ETH is staked. BitMine bought another 7,653 ETH last week and now holds nearly 5% of all ETH. Whales are buying the dip while ETFs sell it. Someone is wrong.
History says this setup has paid before — slowly. The last time the ratio sat near the bottom of its range, in 2019, ETH gained 470% the next year and 399% the year after. April 2025's ratio low did the same trick in fast-forward: up 133% in four months, ETH to a $4,946 all-time high. But that rebound faded in four months too. A cheap ratio is a setup, not a promise.
The levels that decide it: $1,700–$1,750 is the floor — three lows held there since Friday, and a daily close below $1,711 breaks it. Below that, $1,500 is next. Above, $2,000 is the first real test, then $2,136. And keep one eye on the ratio itself: reclaim 0.0298 and the conversation changes overnight.
Fear is at 11 out of 100 — extreme fear for a sixth straight day. The median altcoin is down 65% from last October's top. Nobody is celebrating, and that's exactly when this chart has mattered most. Pull up the $ETH chart and watch $1,711. That's the line.
Not financial advice. DYOR.
ETH Is at Its Weakest vs BTC Since July — While SOL and XRP Split Away
One ETH buys you 0.028 BTC.
That's the weakest Ethereum has looked against $BTC since July — down 67% from the ratio's 2021 peak. And while ETH fades, the majors just split in three directions.
Here's the number that matters. $ETH is trading around $1,810 — down 12% in a week, 24% in a month — after tagging $1,711 on Sunday, its lowest since July. The ETH/BTC ratio sits at 0.028. Traders watching the turn have a clear line: a daily close back above 0.0298 is the first sign the tide is turning. Below 0.0283, Bitcoin keeps winning the trade.
Now the split. Solana bounced 3% today and 5% yesterday, holding $75 while ETH slipped. XRP gained 2% and is pressing up against $1.00 — and its whales just pulled more than $127M of XRP off Binance in a week, into cold wallets, not onto exchanges. $SOL is the one major acting like it wants to lead. ETH is the one acting like it wants to sleep.
So why is ETH the laggard? Start with the flows. US spot Ether ETFs just logged their seventh straight week of outflows — $398.9M last week alone, $2.4B over the seven weeks. Monday brought another $8.3M out; Tuesday's $1.3M inflow was a trickle, not a turn.
Then the upgrade drama. Ethereum's Glamsterdam upgrade is in dispute after core devs warned the gas-limit hike could break 10,000–15,000 smart contracts. A decision lands Thursday. And derivatives traders have already voted with their feet: ETH futures open interest is $9.12B, the lowest since October 2024.
But here's the tension — the on-chain picture refuses to agree with the price. ETH on exchanges just hit a 10-year low of ~14.4M coins. A record 44.6M ETH is staked. BitMine bought another 7,653 ETH last week and now holds nearly 5% of all ETH. Whales are buying the dip while ETFs sell it. Someone is wrong.
History says this setup has paid before — slowly. The last time the ratio sat near the bottom of its range, in 2019, ETH gained 470% the next year and 399% the year after. April 2025's ratio low did the same trick in fast-forward: up 133% in four months, ETH to a $4,946 all-time high. But that rebound faded in four months too. A cheap ratio is a setup, not a promise.
The levels that decide it: $1,700–$1,750 is the floor — three lows held there since Friday, and a daily close below $1,711 breaks it. Below that, $1,500 is next. Above, $2,000 is the first real test, then $2,136. And keep one eye on the ratio itself: reclaim 0.0298 and the conversation changes overnight.
Fear is at 11 out of 100 — extreme fear for a sixth straight day. The median altcoin is down 65% from last October's top. Nobody is celebrating, and that's exactly when this chart has mattered most. Pull up the $ETH chart and watch $1,711. That's the line.
Not financial advice. DYOR.
That's the weakest Ethereum has looked against $BTC since July — down 67% from the ratio's 2021 peak. And while ETH fades, the majors just split in three directions.
Here's the number that matters. $ETH is trading around $1,810 — down 12% in a week, 24% in a month — after tagging $1,711 on Sunday, its lowest since July. The ETH/BTC ratio sits at 0.028. Traders watching the turn have a clear line: a daily close back above 0.0298 is the first sign the tide is turning. Below 0.0283, Bitcoin keeps winning the trade.
Now the split. Solana bounced 3% today and 5% yesterday, holding $75 while ETH slipped. XRP gained 2% and is pressing up against $1.00 — and its whales just pulled more than $127M of XRP off Binance in a week, into cold wallets, not onto exchanges. $SOL is the one major acting like it wants to lead. ETH is the one acting like it wants to sleep.
So why is ETH the laggard? Start with the flows. US spot Ether ETFs just logged their seventh straight week of outflows — $398.9M last week alone, $2.4B over the seven weeks. Monday brought another $8.3M out; Tuesday's $1.3M inflow was a trickle, not a turn.
Then the upgrade drama. Ethereum's Glamsterdam upgrade is in dispute after core devs warned the gas-limit hike could break 10,000–15,000 smart contracts. A decision lands Thursday. And derivatives traders have already voted with their feet: ETH futures open interest is $9.12B, the lowest since October 2024.
But here's the tension — the on-chain picture refuses to agree with the price. ETH on exchanges just hit a 10-year low of ~14.4M coins. A record 44.6M ETH is staked. BitMine bought another 7,653 ETH last week and now holds nearly 5% of all ETH. Whales are buying the dip while ETFs sell it. Someone is wrong.
History says this setup has paid before — slowly. The last time the ratio sat near the bottom of its range, in 2019, ETH gained 470% the next year and 399% the year after. April 2025's ratio low did the same trick in fast-forward: up 133% in four months, ETH to a $4,946 all-time high. But that rebound faded in four months too. A cheap ratio is a setup, not a promise.
The levels that decide it: $1,700–$1,750 is the floor — three lows held there since Friday, and a daily close below $1,711 breaks it. Below that, $1,500 is next. Above, $2,000 is the first real test, then $2,136. And keep one eye on the ratio itself: reclaim 0.0298 and the conversation changes overnight.
Fear is at 11 out of 100 — extreme fear for a sixth straight day. The median altcoin is down 65% from last October's top. Nobody is celebrating, and that's exactly when this chart has mattered most. Pull up the $ETH chart and watch $1,711. That's the line.
Not financial advice. DYOR.
42
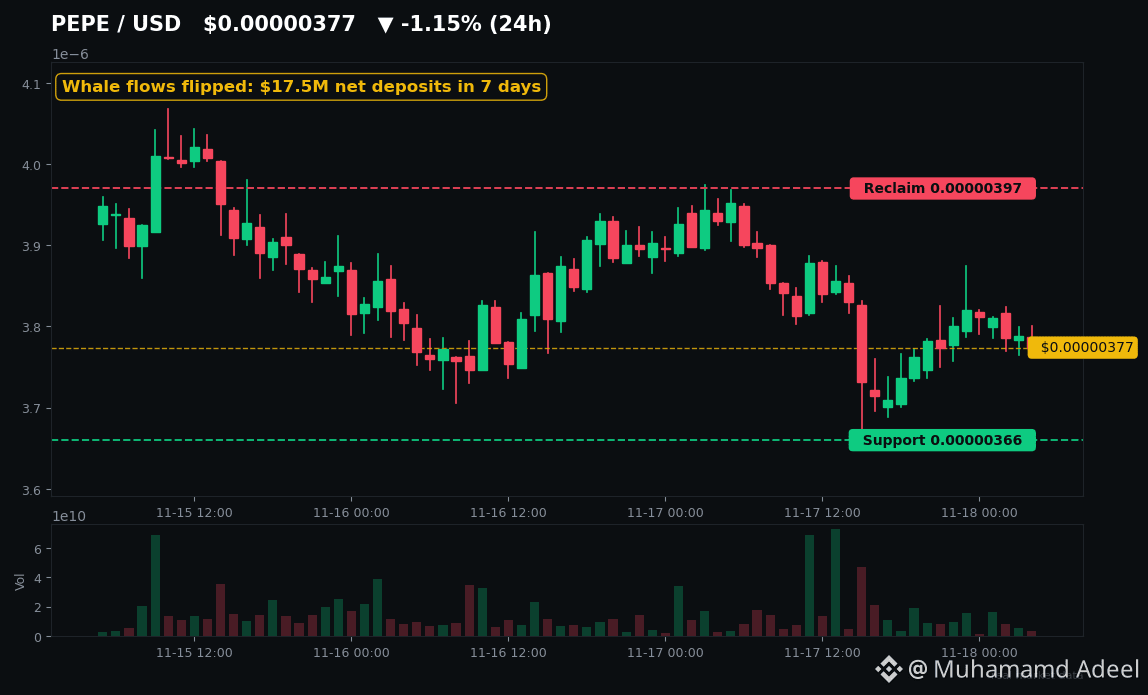
Article
Voir la traduction
PEPE Held Up Longest, Then Fell Hardest — Whales Just FlippedPEPE was the memecoin that refused to die.
For a month it held up better than every rival — down just 6.5% in 30 days while $DOGE, SHIB and BONK bled 19–26%. Then, in one week, it fell 30%. The worst performer in the entire top 100.
And here's the part nobody's talking about: the whales flipped first.
On 10 November PEPE closed at $0.000005364 — its highest close since January. The next day it dropped 15.6%. By 14 November it hit $0.00000369. Today it's sitting near $0.00000378, 86.5% below its December 2024 all-time high of $0.00002803.
So what changed? The flows.
Into 12 November, tracked whale wallets were net withdrawing PEPE from exchanges — $16.9M in a week. Classic accumulation signal. But the price fell anyway. And within two days, the flows flipped hard: $17.5M net deposited to exchanges over the last 7 days, $5.6M in the last 24 hours alone, including a single ~$4M deposit to Bybit. On decentralised exchanges, whales have net-sold $30.2M of PEPE so far in November. That's distribution, not accumulation.
One wallet did withdraw 450 billion PEPE in the last 8 hours, taking its stash to 805 billion (~$3.07M). Real, but one wallet — and ignore the viral "$788M of PEPE moved overnight" posts. That was internal wallet shuffling, not selling.
Now the tape. PEPE is fighting to hold $0.00000366–$0.00000370, its 24-hour low. Lose that and $0.00000354 — the 200-day average — is next, then $0.00000320. Reclaim $0.00000397 and the picture changes fast: above that sits $0.00000408, and the bulls get room to breathe. RSI is around 37 — beaten down, but not yet oversold. If you want the live picture, pull up the chart on $PEPE and watch that $0.00000397 line.
The bigger picture is just as telling. Memecoins bounced 7.2% in the last day — FLOKI +33%, BONK +16% — yet PEPE is still the week's worst performer by a mile. Fear & Greed sits at 11, extreme fear, yet 75% of CoinGecko voters still call themselves bullish. That gap is exactly where memecoins make or break people.
And two things PEPE does not have: a catalyst and an excuse. The Canary spot PEPE ETF is a real filing — but it has sat unapproved since April, and no, it is not "imminent". There are no unlocks to blame either: 100% of the 420.69 trillion supply is already circulating. The risk is pure demand — and the top 10 wallets still hold roughly 38% of supply.
So here's the take. PEPE held up longest, then fell hardest — and the whale flows flipped before the price did. If $0.00000366 holds and $0.00000397 gets reclaimed, this is the washout everyone will wish they bought. If it breaks, $0.00000320 is waiting. Watch the flows, watch the level, and watch $ETH — PEPE has always been a leveraged bet on Ethereum's mood, and it won't move without it. The next 48 hours decide which story this is.
Not financial advice. DYOR.
PEPE Held Up Longest, Then Fell Hardest — Whales Just Flipped
PEPE was the memecoin that refused to die.
For a month it held up better than every rival — down just 6.5% in 30 days while $DOGE , SHIB and BONK bled 19–26%. Then, in one week, it fell 30%. The worst performer in the entire top 100.
And here's the part nobody's talking about: the whales flipped first.
On 10 November PEPE closed at $0.000005364 — its highest close since January. The next day it dropped 15.6%. By 14 November it hit $0.00000369. Today it's sitting near $0.00000378, 86.5% below its December 2024 all-time high of $0.00002803.
So what changed? The flows.
Into 12 November, tracked whale wallets were net withdrawing PEPE from exchanges — $16.9M in a week. Classic accumulation signal. But the price fell anyway. And within two days, the flows flipped hard: $17.5M net deposited to exchanges over the last 7 days, $5.6M in the last 24 hours alone, including a single ~$4M deposit to Bybit. On decentralised exchanges, whales have net-sold $30.2M of PEPE so far in November. That's distribution, not accumulation.
One wallet did withdraw 450 billion PEPE in the last 8 hours, taking its stash to 805 billion (~$3.07M). Real, but one wallet — and ignore the viral "$788M of PEPE moved overnight" posts. That was internal wallet shuffling, not selling.
Now the tape. PEPE is fighting to hold $0.00000366–$0.00000370, its 24-hour low. Lose that and $0.00000354 — the 200-day average — is next, then $0.00000320. Reclaim $0.00000397 and the picture changes fast: above that sits $0.00000408, and the bulls get room to breathe. RSI is around 37 — beaten down, but not yet oversold. If you want the live picture, pull up the chart on $PEPE and watch that $0.00000397 line.
The bigger picture is just as telling. Memecoins bounced 7.2% in the last day — FLOKI +33%, BONK +16% — yet PEPE is still the week's worst performer by a mile. Fear & Greed sits at 11, extreme fear, yet 75% of CoinGecko voters still call themselves bullish. That gap is exactly where memecoins make or break people.
And two things PEPE does not have: a catalyst and an excuse. The Canary spot PEPE ETF is a real filing — but it has sat unapproved since April, and no, it is not "imminent". There are no unlocks to blame either: 100% of the 420.69 trillion supply is already circulating. The risk is pure demand — and the top 10 wallets still hold roughly 38% of supply.
So here's the take. PEPE held up longest, then fell hardest — and the whale flows flipped before the price did. If $0.00000366 holds and $0.00000397 gets reclaimed, this is the washout everyone will wish they bought. If it breaks, $0.00000320 is waiting. Watch the flows, watch the level, and watch $ETH — PEPE has always been a leveraged bet on Ethereum's mood, and it won't move without it. The next 48 hours decide which story this is.
Not financial advice. DYOR.
For a month it held up better than every rival — down just 6.5% in 30 days while $DOGE , SHIB and BONK bled 19–26%. Then, in one week, it fell 30%. The worst performer in the entire top 100.
And here's the part nobody's talking about: the whales flipped first.
On 10 November PEPE closed at $0.000005364 — its highest close since January. The next day it dropped 15.6%. By 14 November it hit $0.00000369. Today it's sitting near $0.00000378, 86.5% below its December 2024 all-time high of $0.00002803.
So what changed? The flows.
Into 12 November, tracked whale wallets were net withdrawing PEPE from exchanges — $16.9M in a week. Classic accumulation signal. But the price fell anyway. And within two days, the flows flipped hard: $17.5M net deposited to exchanges over the last 7 days, $5.6M in the last 24 hours alone, including a single ~$4M deposit to Bybit. On decentralised exchanges, whales have net-sold $30.2M of PEPE so far in November. That's distribution, not accumulation.
One wallet did withdraw 450 billion PEPE in the last 8 hours, taking its stash to 805 billion (~$3.07M). Real, but one wallet — and ignore the viral "$788M of PEPE moved overnight" posts. That was internal wallet shuffling, not selling.
Now the tape. PEPE is fighting to hold $0.00000366–$0.00000370, its 24-hour low. Lose that and $0.00000354 — the 200-day average — is next, then $0.00000320. Reclaim $0.00000397 and the picture changes fast: above that sits $0.00000408, and the bulls get room to breathe. RSI is around 37 — beaten down, but not yet oversold. If you want the live picture, pull up the chart on $PEPE and watch that $0.00000397 line.
The bigger picture is just as telling. Memecoins bounced 7.2% in the last day — FLOKI +33%, BONK +16% — yet PEPE is still the week's worst performer by a mile. Fear & Greed sits at 11, extreme fear, yet 75% of CoinGecko voters still call themselves bullish. That gap is exactly where memecoins make or break people.
And two things PEPE does not have: a catalyst and an excuse. The Canary spot PEPE ETF is a real filing — but it has sat unapproved since April, and no, it is not "imminent". There are no unlocks to blame either: 100% of the 420.69 trillion supply is already circulating. The risk is pure demand — and the top 10 wallets still hold roughly 38% of supply.
So here's the take. PEPE held up longest, then fell hardest — and the whale flows flipped before the price did. If $0.00000366 holds and $0.00000397 gets reclaimed, this is the washout everyone will wish they bought. If it breaks, $0.00000320 is waiting. Watch the flows, watch the level, and watch $ETH — PEPE has always been a leveraged bet on Ethereum's mood, and it won't move without it. The next 48 hours decide which story this is.
Not financial advice. DYOR.
55
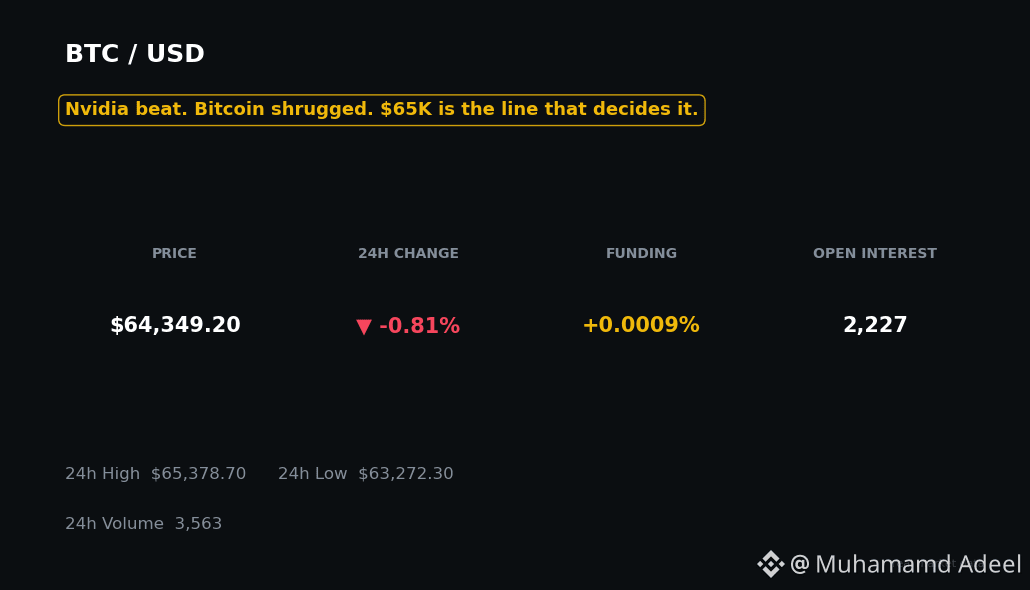
Article
Voir la traduction
Nvidia Just Beat. Bitcoin Didn't Care. Here's Why.Nvidia just posted one of the biggest beats in its history — $115.8B in revenue, up 103% year over year — and $BTC barely blinked.
Bitcoin nudged about $600 higher, then gave it straight back. This morning it's near $64,300, still pinned under $65K after two days of rejections.
So is this bounce real — or just a pause before the next leg down?
**The $65K wall is the whole story right now.**
Bitcoin washed out to $62,006 over the weekend, its lowest since July. The bounce peaked at $65,633 on Monday and $65,379 on Tuesday — both days closed lower. Three straight days touching $65K, three straight rejections.
Zoom out and it's worse: Bitcoin is down 49% from its $126,080 all-time high, and it's been trading below its 200-week moving average near $68,000 since November 14. Wintermute says that line is the key — reclaim it with a daily close plus fresh ETF inflows, or pressure builds toward the $50Ks.
**The ETF "comeback" lasted exactly one day.**
BlackRock's IBIT bled $2.35B over 11 straight sessions. Monday it finally took in $76.5M, and US spot ETFs netted +$7.9M. Then Tuesday flipped straight back to a $30.4M outflow.
That's not a reversal. That's 3% of the bleed recovered — then the tap turned off again.
**And yet — the whales refuse to sell.**
Short-term-holder whales sit on roughly $8B in unrealised losses — a record, per CryptoQuant analyst Darkfost. In September the same group held $9.07B in gains. A $17B swing in two months, and still no mass capitulation.
Only about 35% of short-term-holder supply is still in profit. Their average cost basis is around $75,600. So why aren't they dumping?
They mostly aren't — yet. Whales are net-depositing about $55M a day of Bitcoin onto exchanges, and on November 10 they sent 47,025 BTC to exchanges at a loss. Holding — but standing right by the exit.
**Today's macro test: the Fed minutes.**
The minutes from the October FOMC meeting land at 2pm ET today, with markets pricing roughly 92% odds of a December rate hike and the 10-year yield at 5.15%. Wintermute's blunt read: this sell-off is a rates shock hitting a non-yielding asset, not a crypto-native failure.
History gives you both sides. Today's drawdown — just over 50% peak to trough — sits in the same league as the May–July 2021 crash (-53.1%), which recovered to a new high in 189 days. But fear is at 11, its sixth straight day in extreme fear, and of the 12 times it has printed 13 or lower since 2018, Bitcoin made a lower low first in 11 of them.
**Levels that decide it:**
Reclaim $65K, then $68K, and the bounce gets real. Lose $62K and $60K is next, then $58.5K. Watch $BTC on the chart — the $65K line is the whole story right now. If Bitcoin reclaims it, $ETH is where the rotation shows first. And if $BNB holds firm while Bitcoin stalls, that's your breadth check.
Are you buying the $62K dip, or waiting for $65K to break?
Not financial advice. DYOR.
Nvidia Just Beat. Bitcoin Didn't Care. Here's Why.
Nvidia just posted one of the biggest beats in its history — $115.8B in revenue, up 103% year over year — and $BTC barely blinked.
Bitcoin nudged about $600 higher, then gave it straight back. This morning it's near $64,300, still pinned under $65K after two days of rejections.
So is this bounce real — or just a pause before the next leg down?
**The $65K wall is the whole story right now.**
Bitcoin washed out to $62,006 over the weekend, its lowest since July. The bounce peaked at $65,633 on Monday and $65,379 on Tuesday — both days closed lower. Three straight days touching $65K, three straight rejections.
Zoom out and it's worse: Bitcoin is down 49% from its $126,080 all-time high, and it's been trading below its 200-week moving average near $68,000 since November 14. Wintermute says that line is the key — reclaim it with a daily close plus fresh ETF inflows, or pressure builds toward the $50Ks.
**The ETF "comeback" lasted exactly one day.**
BlackRock's IBIT bled $2.35B over 11 straight sessions. Monday it finally took in $76.5M, and US spot ETFs netted +$7.9M. Then Tuesday flipped straight back to a $30.4M outflow.
That's not a reversal. That's 3% of the bleed recovered — then the tap turned off again.
**And yet — the whales refuse to sell.**
Short-term-holder whales sit on roughly $8B in unrealised losses — a record, per CryptoQuant analyst Darkfost. In September the same group held $9.07B in gains. A $17B swing in two months, and still no mass capitulation.
Only about 35% of short-term-holder supply is still in profit. Their average cost basis is around $75,600. So why aren't they dumping?
They mostly aren't — yet. Whales are net-depositing about $55M a day of Bitcoin onto exchanges, and on November 10 they sent 47,025 BTC to exchanges at a loss. Holding — but standing right by the exit.
**Today's macro test: the Fed minutes.**
The minutes from the October FOMC meeting land at 2pm ET today, with markets pricing roughly 92% odds of a December rate hike and the 10-year yield at 5.15%. Wintermute's blunt read: this sell-off is a rates shock hitting a non-yielding asset, not a crypto-native failure.
History gives you both sides. Today's drawdown — just over 50% peak to trough — sits in the same league as the May–July 2021 crash (-53.1%), which recovered to a new high in 189 days. But fear is at 11, its sixth straight day in extreme fear, and of the 12 times it has printed 13 or lower since 2018, Bitcoin made a lower low first in 11 of them.
**Levels that decide it:**
Reclaim $65K, then $68K, and the bounce gets real. Lose $62K and $60K is next, then $58.5K. Watch $BTC on the chart — the $65K line is the whole story right now. If Bitcoin reclaims it, $ETH is where the rotation shows first. And if $BNB holds firm while Bitcoin stalls, that's your breadth check.
Are you buying the $62K dip, or waiting for $65K to break?
Not financial advice. DYOR.
Bitcoin nudged about $600 higher, then gave it straight back. This morning it's near $64,300, still pinned under $65K after two days of rejections.
So is this bounce real — or just a pause before the next leg down?
**The $65K wall is the whole story right now.**
Bitcoin washed out to $62,006 over the weekend, its lowest since July. The bounce peaked at $65,633 on Monday and $65,379 on Tuesday — both days closed lower. Three straight days touching $65K, three straight rejections.
Zoom out and it's worse: Bitcoin is down 49% from its $126,080 all-time high, and it's been trading below its 200-week moving average near $68,000 since November 14. Wintermute says that line is the key — reclaim it with a daily close plus fresh ETF inflows, or pressure builds toward the $50Ks.
**The ETF "comeback" lasted exactly one day.**
BlackRock's IBIT bled $2.35B over 11 straight sessions. Monday it finally took in $76.5M, and US spot ETFs netted +$7.9M. Then Tuesday flipped straight back to a $30.4M outflow.
That's not a reversal. That's 3% of the bleed recovered — then the tap turned off again.
**And yet — the whales refuse to sell.**
Short-term-holder whales sit on roughly $8B in unrealised losses — a record, per CryptoQuant analyst Darkfost. In September the same group held $9.07B in gains. A $17B swing in two months, and still no mass capitulation.
Only about 35% of short-term-holder supply is still in profit. Their average cost basis is around $75,600. So why aren't they dumping?
They mostly aren't — yet. Whales are net-depositing about $55M a day of Bitcoin onto exchanges, and on November 10 they sent 47,025 BTC to exchanges at a loss. Holding — but standing right by the exit.
**Today's macro test: the Fed minutes.**
The minutes from the October FOMC meeting land at 2pm ET today, with markets pricing roughly 92% odds of a December rate hike and the 10-year yield at 5.15%. Wintermute's blunt read: this sell-off is a rates shock hitting a non-yielding asset, not a crypto-native failure.
History gives you both sides. Today's drawdown — just over 50% peak to trough — sits in the same league as the May–July 2021 crash (-53.1%), which recovered to a new high in 189 days. But fear is at 11, its sixth straight day in extreme fear, and of the 12 times it has printed 13 or lower since 2018, Bitcoin made a lower low first in 11 of them.
**Levels that decide it:**
Reclaim $65K, then $68K, and the bounce gets real. Lose $62K and $60K is next, then $58.5K. Watch $BTC on the chart — the $65K line is the whole story right now. If Bitcoin reclaims it, $ETH is where the rotation shows first. And if $BNB holds firm while Bitcoin stalls, that's your breadth check.
Are you buying the $62K dip, or waiting for $65K to break?
Not financial advice. DYOR.
68
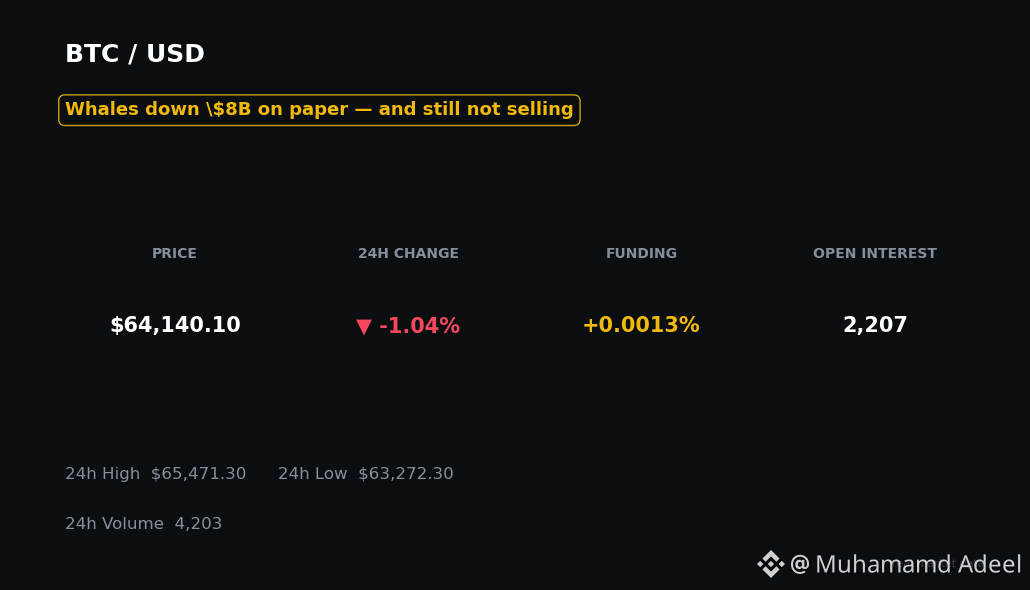
Article
Les baleines affichent 8 milliards de dollars de pertes — et refusent de vendreLe Bitcoin se maintient à 65 000 $, la peur est au plus bas, à 12 — et les plus gros détenteurs de $BTC affichent 8 milliards de dollars de pertes latentes.
Et pourtant… ils ne vendent pas. Voici ce que révèle vraiment la blockchain.
**La saignée dont personne ne parle**
Les baleines détentrices à court terme — des portefeuilles qui ont acheté au cours des 155 derniers jours — affichent désormais environ 8 milliards de dollars de pertes latentes, un record pour cette catégorie, selon Darkfost de CryptoQuant.
Mais elles ne se sont pas précipitées vers la sortie. Les entrées de baleines sur Binance ont augmenté — la moyenne mensuelle est passée d’environ 1 200 à 2 100 BTC par jour — mais elles restent inférieures aux niveaux de février et de juin, malgré des pertes latentes bien plus importantes. Aucune capitulation. Elles conservent simplement leurs positions, à perte.
Les baleines affichent 8 milliards de dollars de pertes — et refusent de vendre
Le Bitcoin se maintient à 65 000 $, la peur est au plus bas, à 12 — et les plus gros détenteurs de $BTC affichent 8 milliards de dollars de pertes latentes.
Et pourtant… ils ne vendent pas. Voici ce que révèle vraiment la blockchain.
**La saignée dont personne ne parle**
Les baleines détentrices à court terme — des portefeuilles qui ont acheté au cours des 155 derniers jours — affichent désormais environ 8 milliards de dollars de pertes latentes, un record pour cette catégorie, selon Darkfost de CryptoQuant.
Mais elles ne se sont pas précipitées vers la sortie. Les entrées de baleines sur Binance ont augmenté — la moyenne mensuelle est passée d’environ 1 200 à 2 100 BTC par jour — mais elles restent inférieures aux niveaux de février et de juin, malgré des pertes latentes bien plus importantes. Aucune capitulation. Elles conservent simplement leurs positions, à perte.
Et pourtant… ils ne vendent pas. Voici ce que révèle vraiment la blockchain.
**La saignée dont personne ne parle**
Les baleines détentrices à court terme — des portefeuilles qui ont acheté au cours des 155 derniers jours — affichent désormais environ 8 milliards de dollars de pertes latentes, un record pour cette catégorie, selon Darkfost de CryptoQuant.
Mais elles ne se sont pas précipitées vers la sortie. Les entrées de baleines sur Binance ont augmenté — la moyenne mensuelle est passée d’environ 1 200 à 2 100 BTC par jour — mais elles restent inférieures aux niveaux de février et de juin, malgré des pertes latentes bien plus importantes. Aucune capitulation. Elles conservent simplement leurs positions, à perte.
1
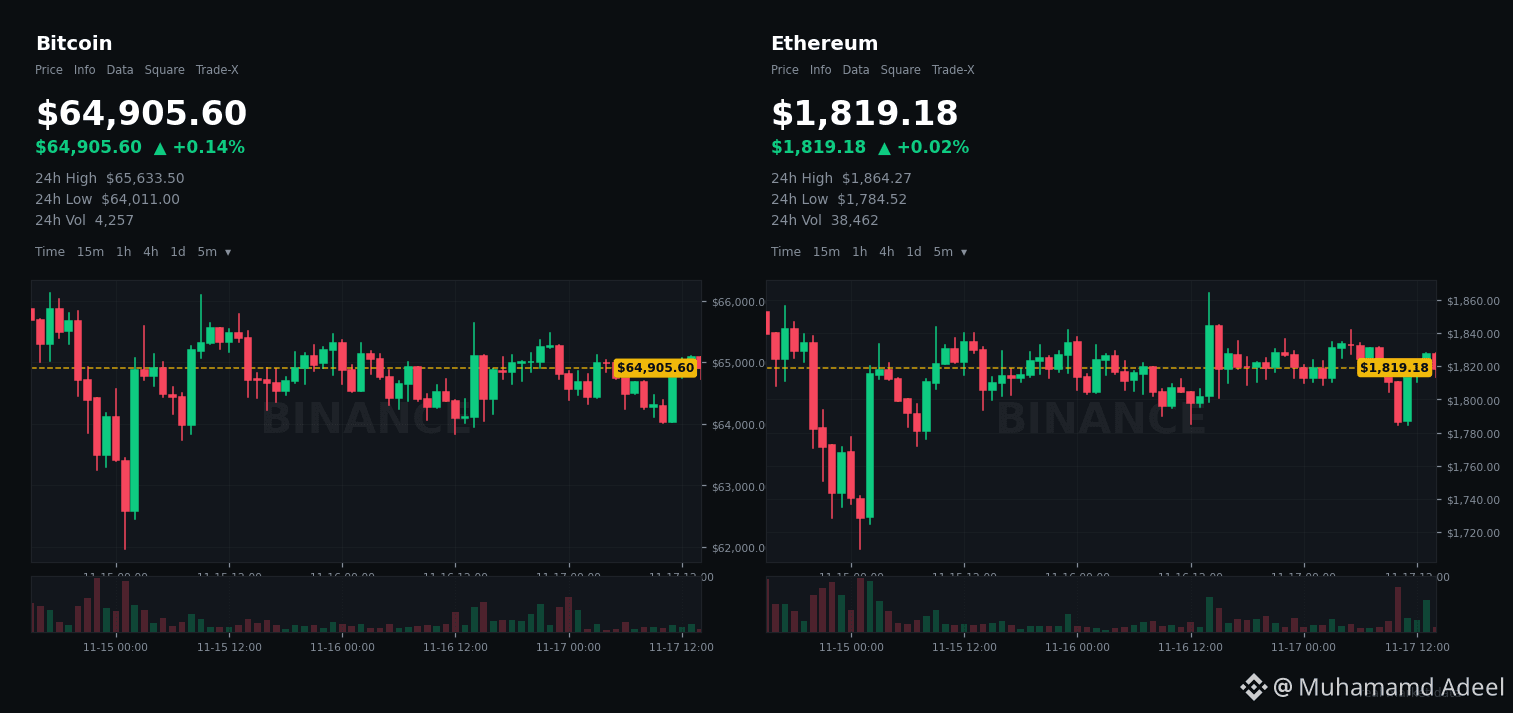
Article
Voir la traduction
Wintermute Says $50K BTC Is Coming — and the Fed Just Made It WorseA $900M bet says Bitcoin is headed to $60K.
Wintermute — one of the biggest market makers in crypto — says it doesn't stop there. The $50Ks are next.
Here's the setup. $BTC is sitting around $64,900, down nearly 13% in a week and 15% in November. It just lost its 200-week moving average near $68,000 — the line traders call crypto's long-term floor. The weekend low was $62,000.
And the macro tape is brutal. Markets now price a December Fed hike at ~92% for a 25bp move — a hike of some size is nearly certain. The 10-year Treasury yield is back above 5%. Core inflation printed 0.3% for a third straight month, which is exactly the number Fed Governor Christopher Waller said would force him to consider a 50bp hike. Waller speaks today. The Fed minutes land tomorrow.
The options market has already picked its side. The $60,000 put on Deribit — over $900M in open interest — is now the biggest single bet on the exchange, overtaking the $100K call. The crowd isn't betting on the moon anymore. It's buying insurance against the floor breaking.
But — and this is the part nobody's talking about — the bearish flow story just cracked. Spot Bitcoin ETFs bled for seven straight sessions, nearly $1.9B out. Then Monday happened: a small $7.9M inflow, with BlackRock's IBIT taking in money for the first time in 11 sessions. One day doesn't make a trend. But the bleeding stopped the same week Wintermute called for the $50Ks.
History says both sides have a point. The last time Bitcoin lost its 200-week line, in 2022, it stayed under it for 30 weeks and fell more than 30% below it. But the last time the Fed actually hiked — September — Bitcoin ripped 13.7% in five days. When a hike is this priced in, the surprise isn't the hike. It's what comes after it.
So here are the levels that decide everything. Lose $62K and the $60K put magnet takes over — that's where the biggest options bet in crypto lives. Reclaim $68K with ETF inflows on the same day and Wintermute itself says it turns less cautious. The January hike — only ~62% priced — is the real battleground, and tomorrow's Fed minutes are the first clue.
$ETH is watching the same tape — down nearly 25% in a month — and if $BTC breaks $60K, high-beta alts like $SOL bleed first.
Are you buying the $60K dip, or waiting for the $50Ks?
Not financial advice. DYOR.
Wintermute Says $50K BTC Is Coming — and the Fed Just Made It Worse
A $900M bet says Bitcoin is headed to $60K.
Wintermute — one of the biggest market makers in crypto — says it doesn't stop there. The $50Ks are next.
Here's the setup. $BTC is sitting around $64,900, down nearly 13% in a week and 15% in November. It just lost its 200-week moving average near $68,000 — the line traders call crypto's long-term floor. The weekend low was $62,000.
And the macro tape is brutal. Markets now price a December Fed hike at ~92% for a 25bp move — a hike of some size is nearly certain. The 10-year Treasury yield is back above 5%. Core inflation printed 0.3% for a third straight month, which is exactly the number Fed Governor Christopher Waller said would force him to consider a 50bp hike. Waller speaks today. The Fed minutes land tomorrow.
The options market has already picked its side. The $60,000 put on Deribit — over $900M in open interest — is now the biggest single bet on the exchange, overtaking the $100K call. The crowd isn't betting on the moon anymore. It's buying insurance against the floor breaking.
But — and this is the part nobody's talking about — the bearish flow story just cracked. Spot Bitcoin ETFs bled for seven straight sessions, nearly $1.9B out. Then Monday happened: a small $7.9M inflow, with BlackRock's IBIT taking in money for the first time in 11 sessions. One day doesn't make a trend. But the bleeding stopped the same week Wintermute called for the $50Ks.
History says both sides have a point. The last time Bitcoin lost its 200-week line, in 2022, it stayed under it for 30 weeks and fell more than 30% below it. But the last time the Fed actually hiked — September — Bitcoin ripped 13.7% in five days. When a hike is this priced in, the surprise isn't the hike. It's what comes after it.
So here are the levels that decide everything. Lose $62K and the $60K put magnet takes over — that's where the biggest options bet in crypto lives. Reclaim $68K with ETF inflows on the same day and Wintermute itself says it turns less cautious. The January hike — only ~62% priced — is the real battleground, and tomorrow's Fed minutes are the first clue.
$ETH is watching the same tape — down nearly 25% in a month — and if $BTC breaks $60K, high-beta alts like $SOL bleed first.
Are you buying the $60K dip, or waiting for the $50Ks?
Not financial advice. DYOR.
Wintermute — one of the biggest market makers in crypto — says it doesn't stop there. The $50Ks are next.
Here's the setup. $BTC is sitting around $64,900, down nearly 13% in a week and 15% in November. It just lost its 200-week moving average near $68,000 — the line traders call crypto's long-term floor. The weekend low was $62,000.
And the macro tape is brutal. Markets now price a December Fed hike at ~92% for a 25bp move — a hike of some size is nearly certain. The 10-year Treasury yield is back above 5%. Core inflation printed 0.3% for a third straight month, which is exactly the number Fed Governor Christopher Waller said would force him to consider a 50bp hike. Waller speaks today. The Fed minutes land tomorrow.
The options market has already picked its side. The $60,000 put on Deribit — over $900M in open interest — is now the biggest single bet on the exchange, overtaking the $100K call. The crowd isn't betting on the moon anymore. It's buying insurance against the floor breaking.
But — and this is the part nobody's talking about — the bearish flow story just cracked. Spot Bitcoin ETFs bled for seven straight sessions, nearly $1.9B out. Then Monday happened: a small $7.9M inflow, with BlackRock's IBIT taking in money for the first time in 11 sessions. One day doesn't make a trend. But the bleeding stopped the same week Wintermute called for the $50Ks.
History says both sides have a point. The last time Bitcoin lost its 200-week line, in 2022, it stayed under it for 30 weeks and fell more than 30% below it. But the last time the Fed actually hiked — September — Bitcoin ripped 13.7% in five days. When a hike is this priced in, the surprise isn't the hike. It's what comes after it.
So here are the levels that decide everything. Lose $62K and the $60K put magnet takes over — that's where the biggest options bet in crypto lives. Reclaim $68K with ETF inflows on the same day and Wintermute itself says it turns less cautious. The January hike — only ~62% priced — is the real battleground, and tomorrow's Fed minutes are the first clue.
$ETH is watching the same tape — down nearly 25% in a month — and if $BTC breaks $60K, high-beta alts like $SOL bleed first.
Are you buying the $60K dip, or waiting for the $50Ks?
Not financial advice. DYOR.
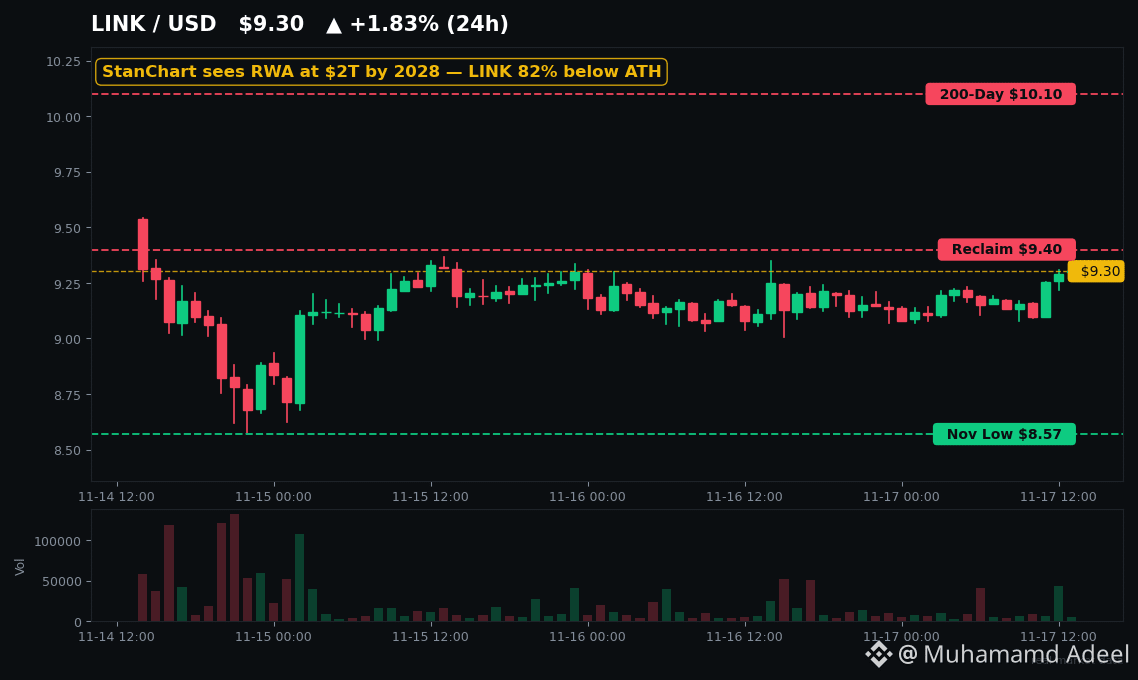
Article
Voir la traduction
Wall Street Just Bet $2T on Tokenization — $LINK Is the PlumbingWhile you were watching Bitcoin bleed, Wall Street quietly placed its biggest bet yet on tokenization.
Standard Chartered just said the tokenized real-world asset market goes from roughly $45 billion today to $2 trillion by 2028. Japan's government-bond market — the third largest on earth — is now studying tokenization. And $LINK is the plumbing underneath almost all of it.
Here's what this really means.
The pipes are being laid in public. Today, Talos, Marex and Broadridge teamed up to finance tokenized US Treasuries through the DTCC's tokenization service, which went live on 28 October. DTCC already ran the first production trades of tokenized securities in July with 30+ institutions, including BlackRock and JPMorgan. Chainlink's tokenized-equity feeds catalogue was updated today, and its always-on 24/7 pricing — built for tokenized stocks — is already live with Aave as the first integrator.
The numbers back the noise. Tokenized real-world assets sit at about $39.5 billion on-chain (excluding stablecoins), held by 5.7 million wallets. Tokenized stocks are the fastest-growing slice: roughly $3.7 billion, up 13.4% in the last 30 days alone, and nearly six times where they started the year. Franklin Templeton's crypto chief put it in perspective this week: only 0.1% of the roughly $160 trillion equity market is tokenized so far.
So why is the plumbing token on sale?
$LINK trades around $9.30 — down about 24% in 30 days and still roughly 82% below its $52.88 all-time high from May 2021. That is the disconnect the whole market is arguing about right now: adoption is landing, but it hasn't paid the network yet.
But look at what the big wallets are doing. Whale trackers show one whale pulled 238,380 LINK — about $2.2 million — off Binance over 15–16 November, and another stacked roughly 145,000 LINK in a single day. They are accumulating into weakness, not chasing strength.
The levels that decide the next move: $8.57 is the line in the sand — the 14 November low. Hold it and the bounce has a base. Reclaim $9.40 and the short-term trend turns. A daily close above $10.10, the 200-day average, flips the whole setup. Lose $8.57 and the downtrend resumes, whatever the headlines say. Pull up the $LINK chart and watch those three lines — that is where this story gets decided. The same tape is pressing $ONDO and the wider RWA basket too, so keep $POLYX on the same watchlist.
Now the honest part: tokenization headlines pop LINK 7–20% in a day — then fade. CCIP 2.0 did exactly that in September. Chainlink also releases roughly 80 million LINK a year while its Reserve buys back only a fraction of that, and tokenized stocks are still a beta product — no voting rights, thin liquidity, 3% round-trip costs on some names. With Bitcoin around $64,700 and Fear & Greed at 12, even a great RWA story is fighting the tape.
But here is the take: the market prices LINK like tokenization is a fad, while Wall Street builds like it is infrastructure. One of them is wrong — and the whales just told you which side they are on.
Not financial advice. DYOR.
Wall Street Just Bet $2T on Tokenization — $LINK Is the Plumbing
While you were watching Bitcoin bleed, Wall Street quietly placed its biggest bet yet on tokenization.
Standard Chartered just said the tokenized real-world asset market goes from roughly $45 billion today to $2 trillion by 2028. Japan's government-bond market — the third largest on earth — is now studying tokenization. And $LINK is the plumbing underneath almost all of it.
Here's what this really means.
The pipes are being laid in public. Today, Talos, Marex and Broadridge teamed up to finance tokenized US Treasuries through the DTCC's tokenization service, which went live on 28 October. DTCC already ran the first production trades of tokenized securities in July with 30+ institutions, including BlackRock and JPMorgan. Chainlink's tokenized-equity feeds catalogue was updated today, and its always-on 24/7 pricing — built for tokenized stocks — is already live with Aave as the first integrator.
The numbers back the noise. Tokenized real-world assets sit at about $39.5 billion on-chain (excluding stablecoins), held by 5.7 million wallets. Tokenized stocks are the fastest-growing slice: roughly $3.7 billion, up 13.4% in the last 30 days alone, and nearly six times where they started the year. Franklin Templeton's crypto chief put it in perspective this week: only 0.1% of the roughly $160 trillion equity market is tokenized so far.
So why is the plumbing token on sale?
$LINK trades around $9.30 — down about 24% in 30 days and still roughly 82% below its $52.88 all-time high from May 2021. That is the disconnect the whole market is arguing about right now: adoption is landing, but it hasn't paid the network yet.
But look at what the big wallets are doing. Whale trackers show one whale pulled 238,380 LINK — about $2.2 million — off Binance over 15–16 November, and another stacked roughly 145,000 LINK in a single day. They are accumulating into weakness, not chasing strength.
The levels that decide the next move: $8.57 is the line in the sand — the 14 November low. Hold it and the bounce has a base. Reclaim $9.40 and the short-term trend turns. A daily close above $10.10, the 200-day average, flips the whole setup. Lose $8.57 and the downtrend resumes, whatever the headlines say. Pull up the $LINK chart and watch those three lines — that is where this story gets decided. The same tape is pressing $ONDO and the wider RWA basket too, so keep $POLYX on the same watchlist.
Now the honest part: tokenization headlines pop LINK 7–20% in a day — then fade. CCIP 2.0 did exactly that in September. Chainlink also releases roughly 80 million LINK a year while its Reserve buys back only a fraction of that, and tokenized stocks are still a beta product — no voting rights, thin liquidity, 3% round-trip costs on some names. With Bitcoin around $64,700 and Fear & Greed at 12, even a great RWA story is fighting the tape.
But here is the take: the market prices LINK like tokenization is a fad, while Wall Street builds like it is infrastructure. One of them is wrong — and the whales just told you which side they are on.
Not financial advice. DYOR.
Standard Chartered just said the tokenized real-world asset market goes from roughly $45 billion today to $2 trillion by 2028. Japan's government-bond market — the third largest on earth — is now studying tokenization. And $LINK is the plumbing underneath almost all of it.
Here's what this really means.
The pipes are being laid in public. Today, Talos, Marex and Broadridge teamed up to finance tokenized US Treasuries through the DTCC's tokenization service, which went live on 28 October. DTCC already ran the first production trades of tokenized securities in July with 30+ institutions, including BlackRock and JPMorgan. Chainlink's tokenized-equity feeds catalogue was updated today, and its always-on 24/7 pricing — built for tokenized stocks — is already live with Aave as the first integrator.
The numbers back the noise. Tokenized real-world assets sit at about $39.5 billion on-chain (excluding stablecoins), held by 5.7 million wallets. Tokenized stocks are the fastest-growing slice: roughly $3.7 billion, up 13.4% in the last 30 days alone, and nearly six times where they started the year. Franklin Templeton's crypto chief put it in perspective this week: only 0.1% of the roughly $160 trillion equity market is tokenized so far.
So why is the plumbing token on sale?
$LINK trades around $9.30 — down about 24% in 30 days and still roughly 82% below its $52.88 all-time high from May 2021. That is the disconnect the whole market is arguing about right now: adoption is landing, but it hasn't paid the network yet.
But look at what the big wallets are doing. Whale trackers show one whale pulled 238,380 LINK — about $2.2 million — off Binance over 15–16 November, and another stacked roughly 145,000 LINK in a single day. They are accumulating into weakness, not chasing strength.
The levels that decide the next move: $8.57 is the line in the sand — the 14 November low. Hold it and the bounce has a base. Reclaim $9.40 and the short-term trend turns. A daily close above $10.10, the 200-day average, flips the whole setup. Lose $8.57 and the downtrend resumes, whatever the headlines say. Pull up the $LINK chart and watch those three lines — that is where this story gets decided. The same tape is pressing $ONDO and the wider RWA basket too, so keep $POLYX on the same watchlist.
Now the honest part: tokenization headlines pop LINK 7–20% in a day — then fade. CCIP 2.0 did exactly that in September. Chainlink also releases roughly 80 million LINK a year while its Reserve buys back only a fraction of that, and tokenized stocks are still a beta product — no voting rights, thin liquidity, 3% round-trip costs on some names. With Bitcoin around $64,700 and Fear & Greed at 12, even a great RWA story is fighting the tape.
But here is the take: the market prices LINK like tokenization is a fad, while Wall Street builds like it is infrastructure. One of them is wrong — and the whales just told you which side they are on.
Not financial advice. DYOR.
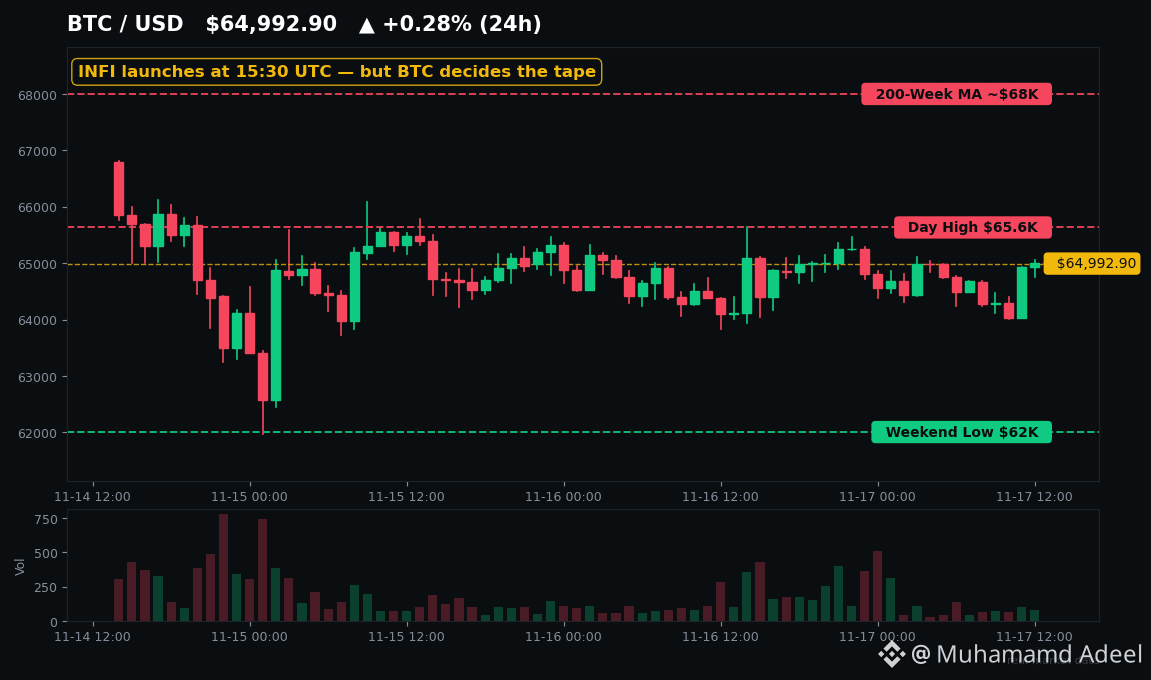
Article
INFI est lancé ce soir — et la foule de l'airdrop décide de son sortCe soir à 15 h 30 UTC, un tout nouveau token sera lancé — et personne ne sait combien il vaut.
$INFI n'a aucun historique de prix. Pas de graphique, pas de plancher, pas de plus haut historique. Juste une armée de bénéficiaires de l'airdrop qui détient des tokens gelés, en attendant qu'une seule transaction de déblocage les libère. Voilà toute la mise de ce soir.
Alors, qu'est-ce que c'est, au juste ?
InfiniFi est un protocole DeFi qui tente de recréer une banque on-chain. Vous déposez des stablecoins, vous recevez des iUSD, et le protocole génère des rendements à l'ancienne — emprunter à court terme, prêter à long terme — sur Aave, Pendle et Ethena. Sans effet de levier, affirme l'équipe. Le fondateur Rob Montgomery assure que le protocole a survécu à quatre ou cinq paniques bancaires, dont des retraits de 60 M$ en 48 heures, sans suspendre les rachats.
INFI est lancé ce soir — et la foule de l'airdrop décide de son sort
Ce soir à 15 h 30 UTC, un tout nouveau token sera lancé — et personne ne sait combien il vaut.
$INFI n'a aucun historique de prix. Pas de graphique, pas de plancher, pas de plus haut historique. Juste une armée de bénéficiaires de l'airdrop qui détient des tokens gelés, en attendant qu'une seule transaction de déblocage les libère. Voilà toute la mise de ce soir.
Alors, qu'est-ce que c'est, au juste ?
InfiniFi est un protocole DeFi qui tente de recréer une banque on-chain. Vous déposez des stablecoins, vous recevez des iUSD, et le protocole génère des rendements à l'ancienne — emprunter à court terme, prêter à long terme — sur Aave, Pendle et Ethena. Sans effet de levier, affirme l'équipe. Le fondateur Rob Montgomery assure que le protocole a survécu à quatre ou cinq paniques bancaires, dont des retraits de 60 M$ en 48 heures, sans suspendre les rachats.
$INFI n'a aucun historique de prix. Pas de graphique, pas de plancher, pas de plus haut historique. Juste une armée de bénéficiaires de l'airdrop qui détient des tokens gelés, en attendant qu'une seule transaction de déblocage les libère. Voilà toute la mise de ce soir.
Alors, qu'est-ce que c'est, au juste ?
InfiniFi est un protocole DeFi qui tente de recréer une banque on-chain. Vous déposez des stablecoins, vous recevez des iUSD, et le protocole génère des rendements à l'ancienne — emprunter à court terme, prêter à long terme — sur Aave, Pendle et Ethena. Sans effet de levier, affirme l'équipe. Le fondateur Rob Montgomery assure que le protocole a survécu à quatre ou cinq paniques bancaires, dont des retraits de 60 M$ en 48 heures, sans suspendre les rachats.
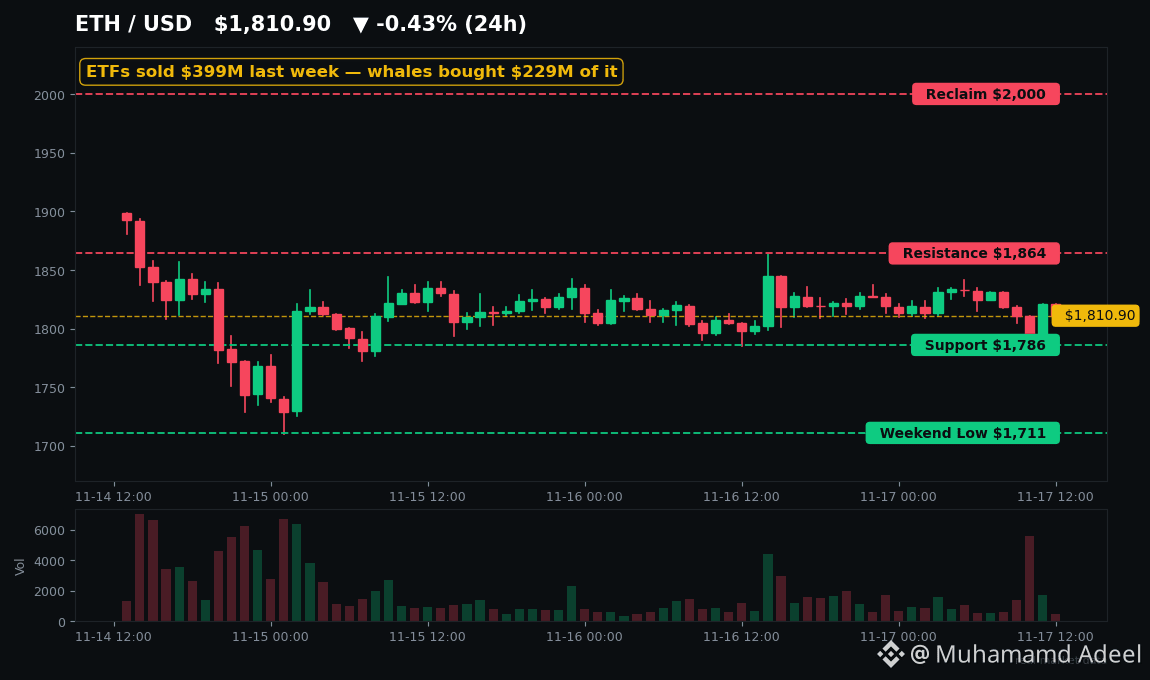
Article
Les ETF ont vendu pour 399 M$ d’ETH la semaine dernière. Les baleines en ont acheté pour 229 M$Les ETF ont vendu pour 399 M$ d’ETH la semaine dernière. Les baleines en ont acheté pour 229 M$ en une seule journée.
Même marché. Même semaine. Deux paris complètement opposés. Et en ce moment, l’un des deux est en train de gagner discrètement.
Voici ce qui s’est réellement passé. Les ETF américains au comptant sur l’ETH ont enregistré 398,9 M$ de sorties nettes durant la semaine du 9 au 13 novembre — leur septième semaine négative consécutive. Rien qu’en novembre, les sorties atteignent 764 M$, et octobre a été le pire mois depuis leur lancement, avec -1,61 Md$. Oui, le vendredi 13 a enregistré une petite entrée nette de 2,3 M$, mettant fin à six jours consécutifs de sorties. Puis, lundi, 8,4 M$ sont repartis aussitôt. Une seule journée dans le vert ne signifie pas un retournement de tendance. Ne laissez personne vous faire croire le contraire.
Les ETF ont vendu pour 399 M$ d’ETH la semaine dernière. Les baleines en ont acheté pour 229 M$
Les ETF ont vendu pour 399 M$ d’ETH la semaine dernière. Les baleines en ont acheté pour 229 M$ en une seule journée.
Même marché. Même semaine. Deux paris complètement opposés. Et en ce moment, l’un des deux est en train de gagner discrètement.
Voici ce qui s’est réellement passé. Les ETF américains au comptant sur l’ETH ont enregistré 398,9 M$ de sorties nettes durant la semaine du 9 au 13 novembre — leur septième semaine négative consécutive. Rien qu’en novembre, les sorties atteignent 764 M$, et octobre a été le pire mois depuis leur lancement, avec -1,61 Md$. Oui, le vendredi 13 a enregistré une petite entrée nette de 2,3 M$, mettant fin à six jours consécutifs de sorties. Puis, lundi, 8,4 M$ sont repartis aussitôt. Une seule journée dans le vert ne signifie pas un retournement de tendance. Ne laissez personne vous faire croire le contraire.
Même marché. Même semaine. Deux paris complètement opposés. Et en ce moment, l’un des deux est en train de gagner discrètement.
Voici ce qui s’est réellement passé. Les ETF américains au comptant sur l’ETH ont enregistré 398,9 M$ de sorties nettes durant la semaine du 9 au 13 novembre — leur septième semaine négative consécutive. Rien qu’en novembre, les sorties atteignent 764 M$, et octobre a été le pire mois depuis leur lancement, avec -1,61 Md$. Oui, le vendredi 13 a enregistré une petite entrée nette de 2,3 M$, mettant fin à six jours consécutifs de sorties. Puis, lundi, 8,4 M$ sont repartis aussitôt. Une seule journée dans le vert ne signifie pas un retournement de tendance. Ne laissez personne vous faire croire le contraire.
1
Connectez-vous pour découvrir plus de contenu
Rejoignez la communauté mondiale des adeptes de cryptomonnaies sur Binance Square
⚡️ Suviez les dernières informations importantes sur les cryptomonnaies.
💬 Jugé digne de confiance par la plus grande plateforme d’échange de cryptomonnaies au monde.
👍 Découvrez les connaissances que partagent les créateurs vérifiés.
Adresse e-mail/Nº de téléphone
Sujets d’actualité
NvidiaBeatsEstimatesWith$130BQ4Outlook
42,199 vues
256 mentions
Nvidia dépasse les attentes avec un chiffre d’affaires de 115,8 milliards de dollars, prévoit 130 milliards et ajoute 150 milliards de dollars à son programme de rachats d’actions
Binance News
·71 mentions J’aime
·48.2k vues
AnthropicIPOPriceCouldExceed$80
45,038 vues
224 mentions
RussiaCentralBankAddsAlfaBankToCryptoExchangeRegister
1,958 vues
35 mentions