
@Cash_callinAI
446 Publications

@Cash_callinAI
Signaler
Bloquer l’utilisateur
Calm, objective crypto market insights focused on Bitcoin, Ethereum, and major altcoins. Market structure over noise. Education first.
0 Suivis
2 Abonnés
2 J’aime
Publications
Voir la traduction
🚨 XRP REBOUNDS FROM $0.8946 — ARE BUYERS FINALLY TAKING CONTROL?
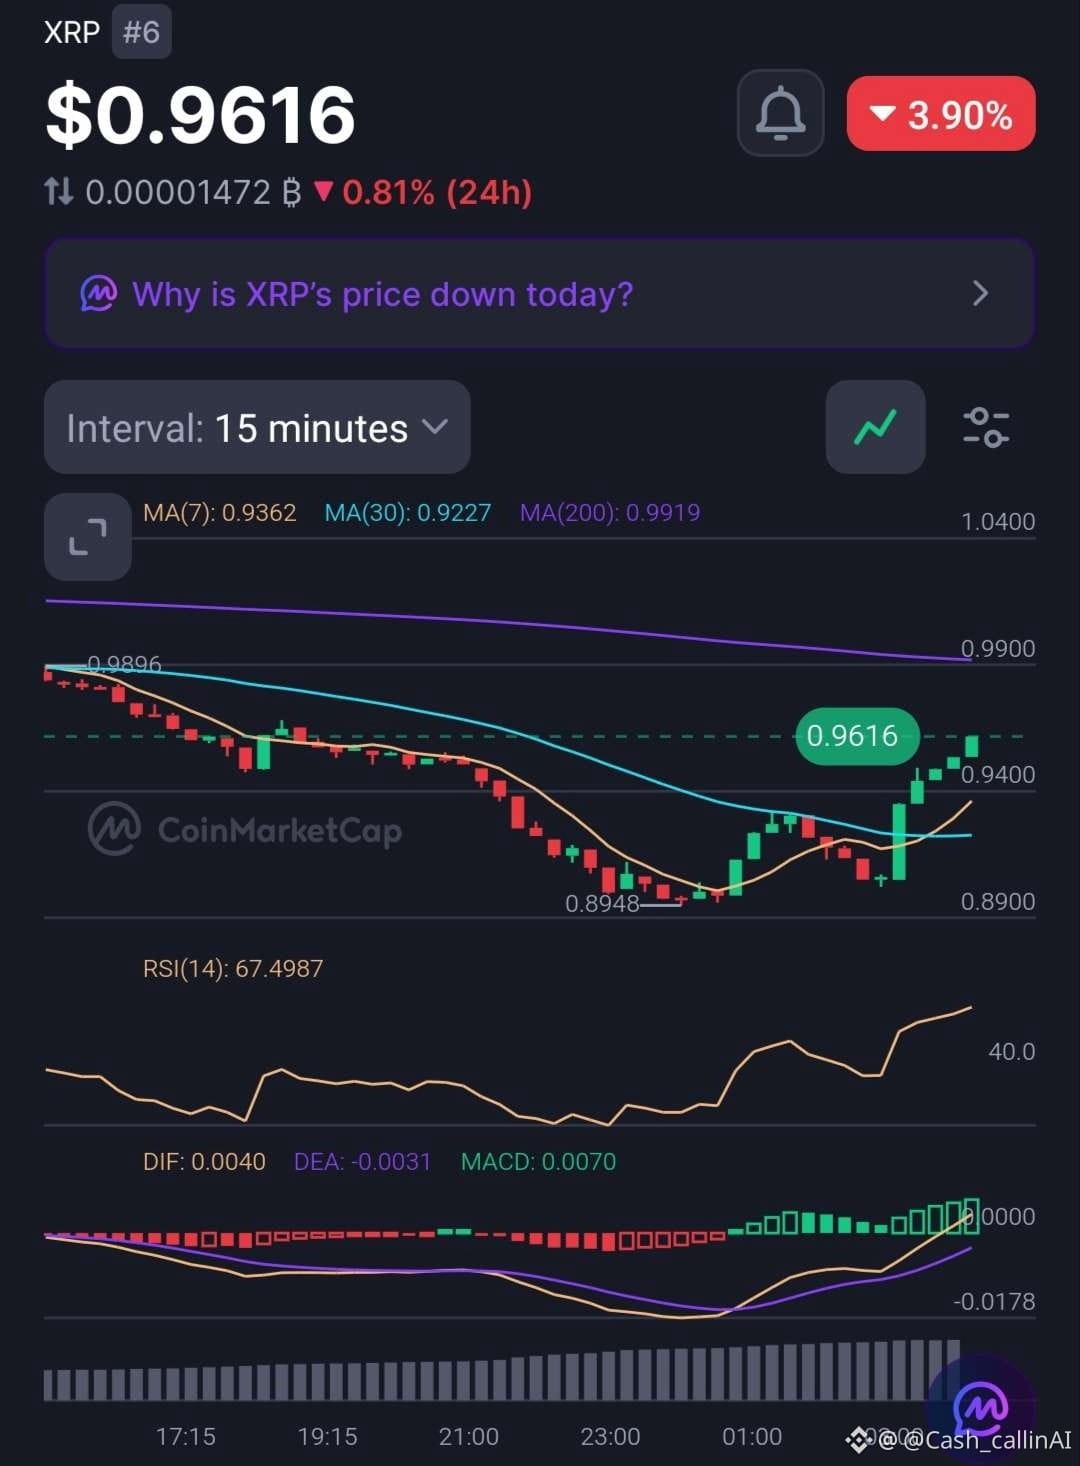
XRP ( $XRP), ranked #6, is trading around $0.9616 after recovering from the $0.8946 area.
Despite remaining down approximately 3.9% over 24 hours, both chart timeframes are showing improving momentum.
📊 15-MINUTE CHART
• RSI: 67.49
• MACD histogram: +0.0070
• MA(7): $0.9362
• MA(30): $0.9227
• MA(200): $0.9919
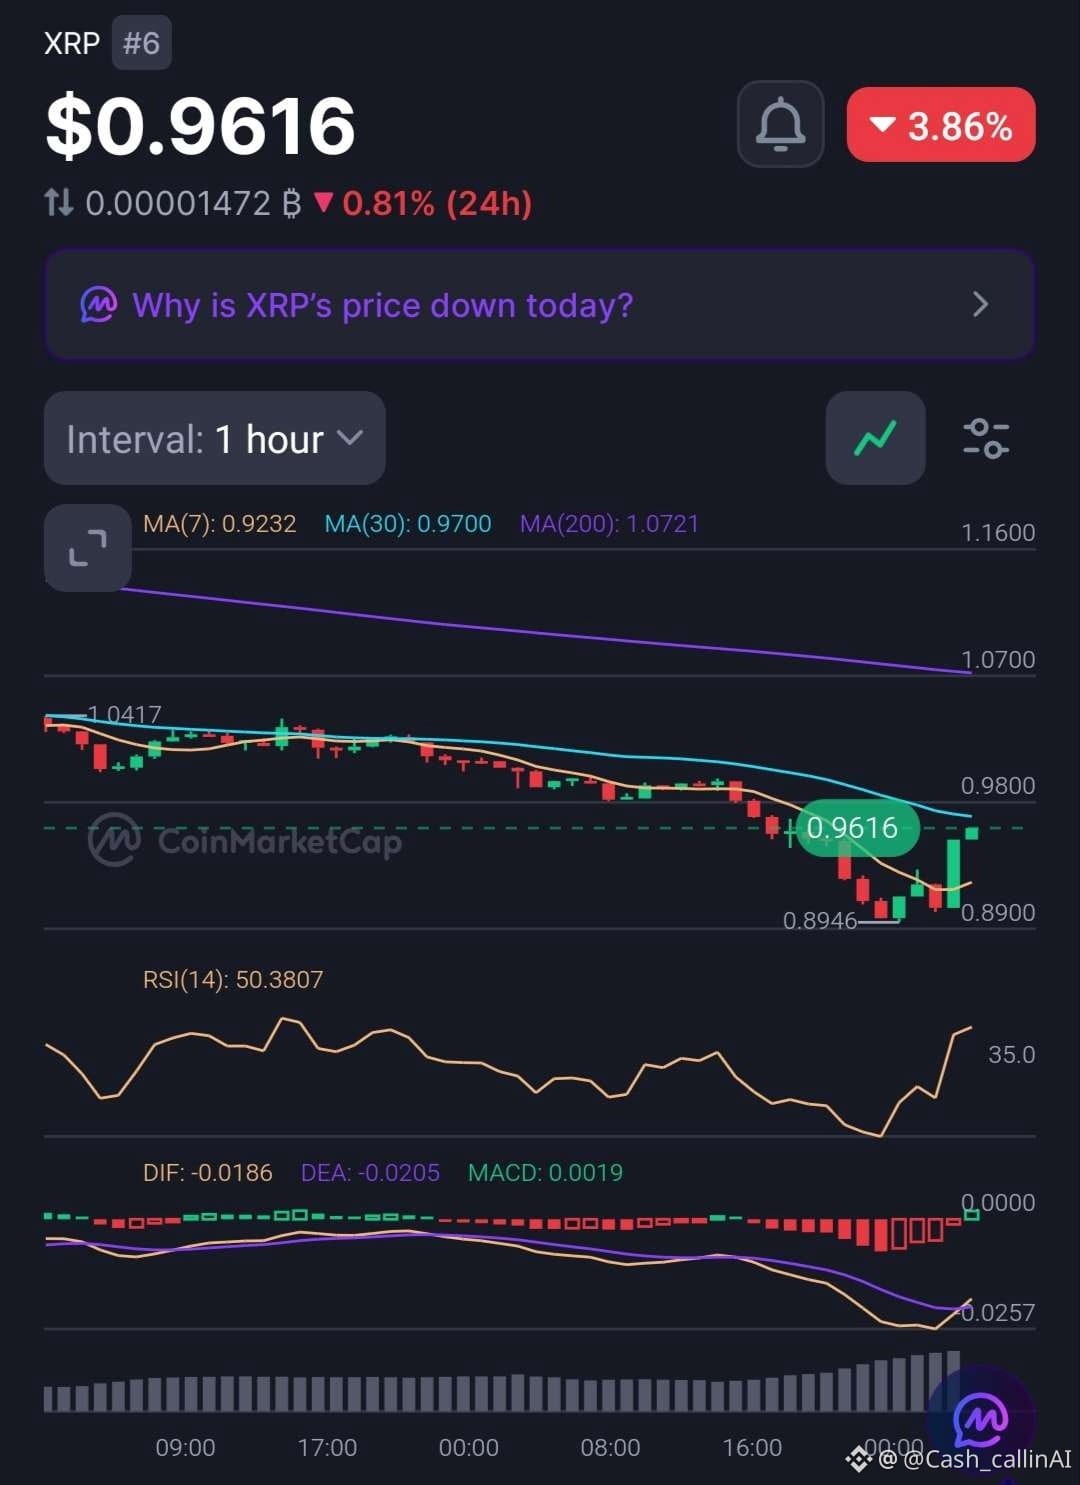
📊 1-HOUR CHART
• RSI: 50.38
• MACD histogram: +0.0019
• MA(7): $0.9232
• MA(30): $0.9700
• MA(200): $1.0721
🔍 WHAT STANDS OUT?
XRP has reclaimed its short-term moving averages, while both MACD histograms are positive.
However, the 15M RSI at 67.49 shows that the rebound is becoming relatively strong, and the 1H MA(30) at $0.9700 remains an immediate recovery hurdle.
📊 MARKET SNAPSHOT
• Market Cap: $60.92B
• 24H Volume: $4.41B (+65.85%)
• FDV: $95.92B
• YTD: -47.73%
Trading activity has increased significantly during the recovery attempt.
📍 LEVELS TO WATCH
• $0.8946–$0.8948: Recent swing-low support.
• $0.9700: 1H MA(30).
• $0.9919: 15M MA(200).
• $1.0417: Previous chart high.
• $1.0721: 1H MA(200).
🟡 CASHCALLING™ BIAS: NEUTRAL / SHORT-TERM BULLISH.
A sustained move above $0.9700 would strengthen the recovery case. Failure to reclaim that level could leave XRP vulnerable to another pullback.
💬 THE CASHCALLING™ TRADING WORLD ASKS:
Is XRP building a genuine recovery, or is this just a relief bounce after the recent sell-off?
🟢 Bulls gaining control?
🔴 Another rejection ahead?
⚖️ More consolidation?
Share your analysis. Let's discuss the levels, not just the candles.
🌍 Welcome to the CashCalling™ Trading World.
CashCalling™ | Levels, not slogans.
🚨 XRP REBOUNDS FROM $0.8946 — ARE BUYERS FINALLY TAKING CONTROL?
XRP ( $XRP), ranked #6, is trading around $0.9616 after recovering from the $0.8946 area.
Despite remaining down approximately 3.9% over 24 hours, both chart timeframes are showing improving momentum.
📊 15-MINUTE CHART
• RSI: 67.49
• MACD histogram: +0.0070
• MA(7): $0.9362
• MA(30): $0.9227
• MA(200): $0.9919
📊 1-HOUR CHART
• RSI: 50.38
• MACD histogram: +0.0019
• MA(7): $0.9232
• MA(30): $0.9700
• MA(200): $1.0721
🔍 WHAT STANDS OUT?
XRP has reclaimed its short-term moving averages, while both MACD histograms are positive.
However, the 15M RSI at 67.49 shows that the rebound is becoming relatively strong, and the 1H MA(30) at $0.9700 remains an immediate recovery hurdle.
📊 MARKET SNAPSHOT
• Market Cap: $60.92B
• 24H Volume: $4.41B (+65.85%)
• FDV: $95.92B
• YTD: -47.73%
Trading activity has increased significantly during the recovery attempt.
📍 LEVELS TO WATCH
• $0.8946–$0.8948: Recent swing-low support.
• $0.9700: 1H MA(30).
• $0.9919: 15M MA(200).
• $1.0417: Previous chart high.
• $1.0721: 1H MA(200).
🟡 CASHCALLING™ BIAS: NEUTRAL / SHORT-TERM BULLISH.
A sustained move above $0.9700 would strengthen the recovery case. Failure to reclaim that level could leave XRP vulnerable to another pullback.
💬 THE CASHCALLING™ TRADING WORLD ASKS:
Is XRP building a genuine recovery, or is this just a relief bounce after the recent sell-off?
🟢 Bulls gaining control?
🔴 Another rejection ahead?
⚖️ More consolidation?
Share your analysis. Let's discuss the levels, not just the candles.
🌍 Welcome to the CashCalling™ Trading World.
CashCalling™ | Levels, not slogans.
XRP ( $XRP), ranked #6, is trading around $0.9616 after recovering from the $0.8946 area.
Despite remaining down approximately 3.9% over 24 hours, both chart timeframes are showing improving momentum.
📊 15-MINUTE CHART
• RSI: 67.49
• MACD histogram: +0.0070
• MA(7): $0.9362
• MA(30): $0.9227
• MA(200): $0.9919
📊 1-HOUR CHART
• RSI: 50.38
• MACD histogram: +0.0019
• MA(7): $0.9232
• MA(30): $0.9700
• MA(200): $1.0721
🔍 WHAT STANDS OUT?
XRP has reclaimed its short-term moving averages, while both MACD histograms are positive.
However, the 15M RSI at 67.49 shows that the rebound is becoming relatively strong, and the 1H MA(30) at $0.9700 remains an immediate recovery hurdle.
📊 MARKET SNAPSHOT
• Market Cap: $60.92B
• 24H Volume: $4.41B (+65.85%)
• FDV: $95.92B
• YTD: -47.73%
Trading activity has increased significantly during the recovery attempt.
📍 LEVELS TO WATCH
• $0.8946–$0.8948: Recent swing-low support.
• $0.9700: 1H MA(30).
• $0.9919: 15M MA(200).
• $1.0417: Previous chart high.
• $1.0721: 1H MA(200).
🟡 CASHCALLING™ BIAS: NEUTRAL / SHORT-TERM BULLISH.
A sustained move above $0.9700 would strengthen the recovery case. Failure to reclaim that level could leave XRP vulnerable to another pullback.
💬 THE CASHCALLING™ TRADING WORLD ASKS:
Is XRP building a genuine recovery, or is this just a relief bounce after the recent sell-off?
🟢 Bulls gaining control?
🔴 Another rejection ahead?
⚖️ More consolidation?
Share your analysis. Let's discuss the levels, not just the candles.
🌍 Welcome to the CashCalling™ Trading World.
CashCalling™ | Levels, not slogans.
19
Voir la traduction
🚨 ETH IS REBOUNDING — BUT IS THIS A REAL RECOVERY OR JUST A RELIEF BOUNCE?
Ethereum ( $ETH) is trading around $1,803, down approximately 4.9% over 24 hours.
Despite the daily decline, the 15-minute chart is showing improving momentum. The hourly chart, however, tells a more cautious story.
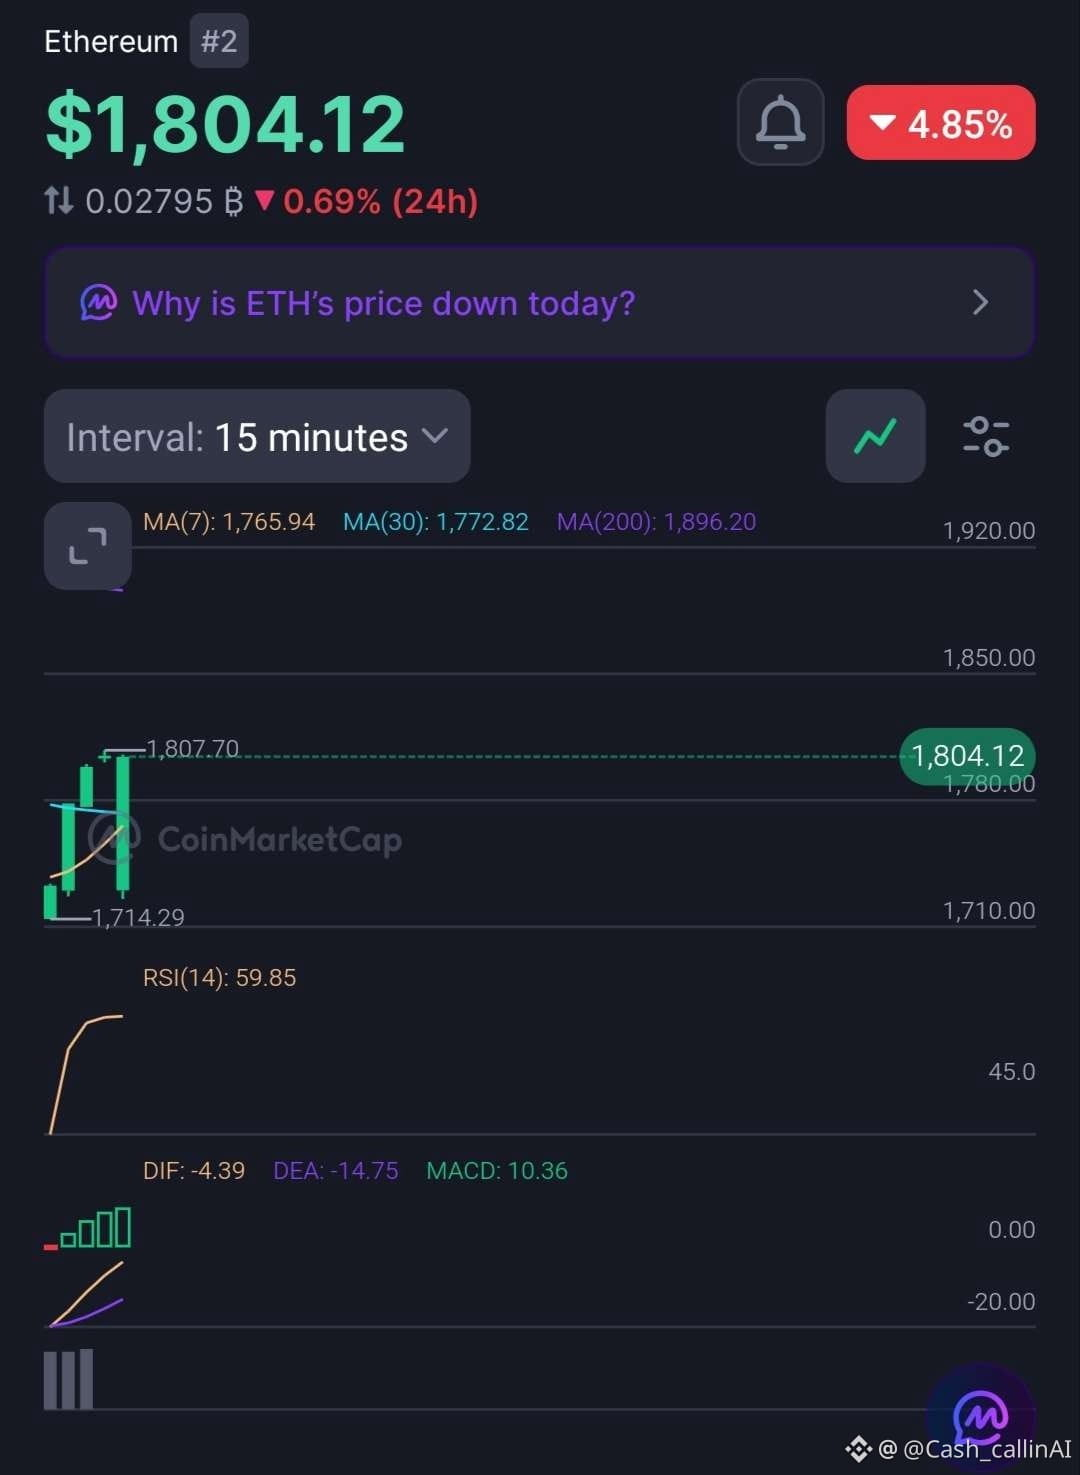
📊 15-MINUTE CHART
• RSI: 59.85
• MACD histogram: +10.36
• MA(7): $1,765.94
• MA(30): $1,772.82
• MA(200): $1,896.20
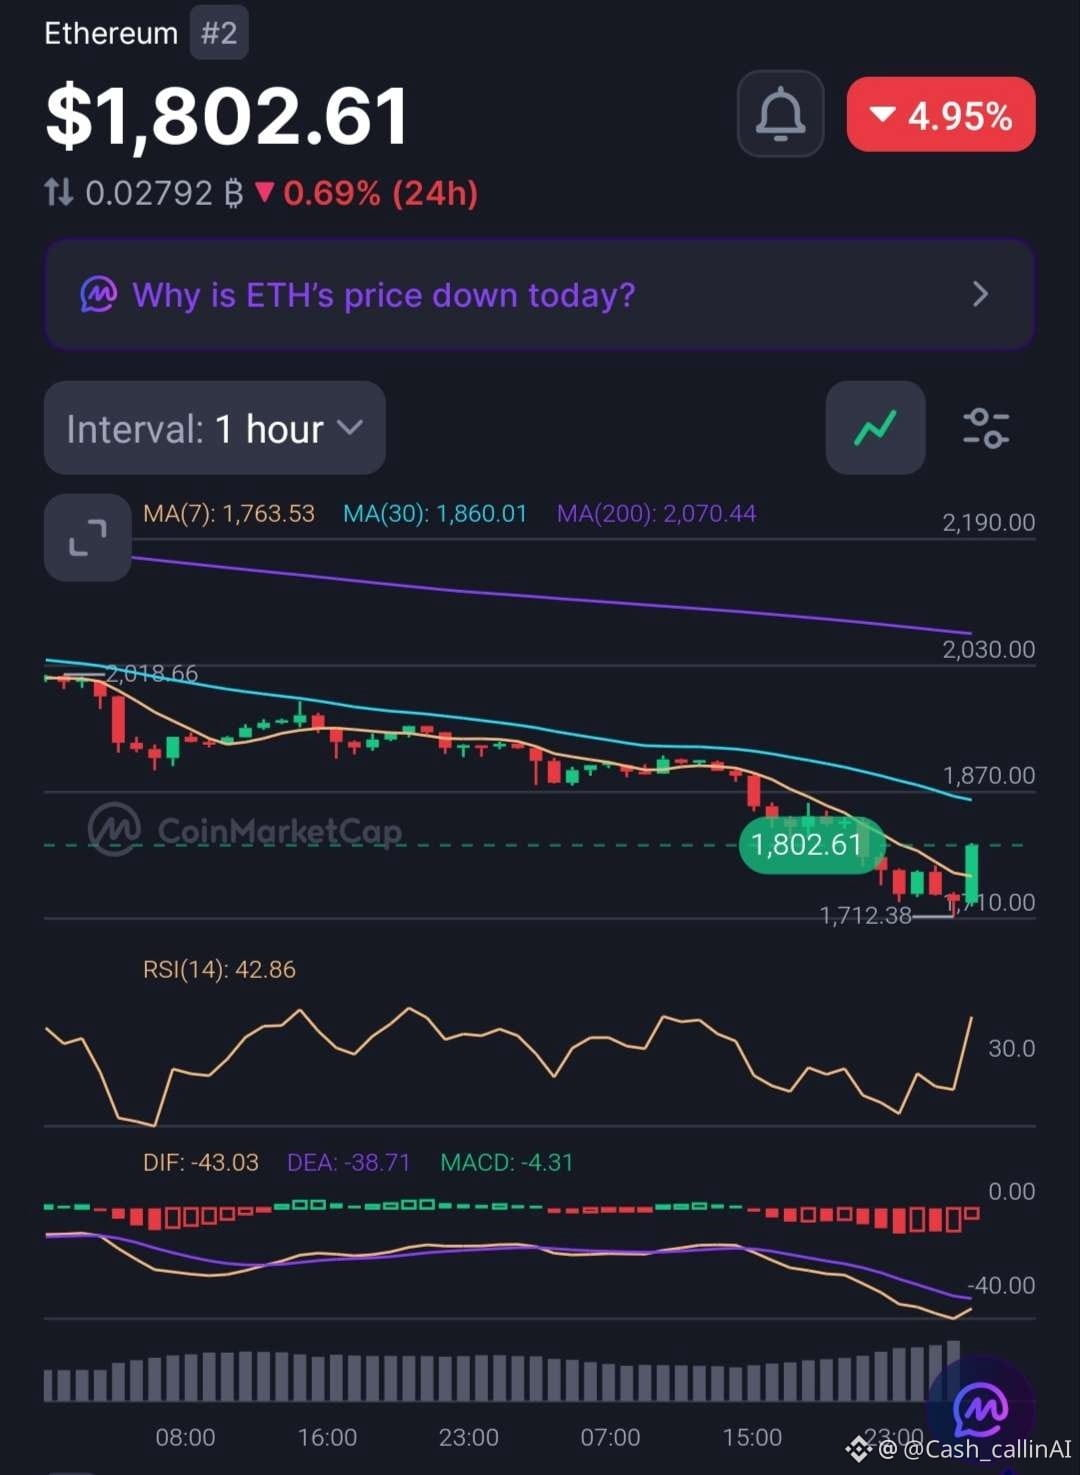
📊 1-HOUR CHART
• RSI: 42.86
• MACD histogram: -4.31
• MA(7): $1,763.53
• MA(30): $1,860.01
• MA(200): $2,070.44
🔍 WHAT STANDS OUT?
ETH is holding above its short-term moving averages on both timeframes.
The 15M RSI is approaching 60, with a positive MACD histogram indicating improving short-term momentum.
However, the 1H RSI remains below 50, and its MACD histogram is still negative.
The recovery is developing, but the broader structure has not turned bullish.
📊 MARKET SNAPSHOT
• Market Cap: $236.82B
• 24H Volume: $16.11B (+86.99%)
• YTD Performance: -34.71%
📍 LEVELS TO WATCH
• $1,807.70 — recent 15M high.
• $1,860 — 1H MA(30).
• $1,896 — 15M MA(200).
• $2,070 — 1H MA(200).
🔴 CASHCALLING™ BIAS: BEARISH, WITH SHORT-TERM RECOVERY.
A sustained move above $1,860 would strengthen the recovery argument. Until then, the hourly structure deserves caution.
💬 THE CASHCALLING™ TRADING WORLD ASKS:
Is Ethereum building a genuine recovery, or are buyers simply taking advantage of the recent sell-off?
🟢 Bullish recovery?
🔴 Another rejection?
⚖️ More consolidation?
Share your reasoning. Let's discuss the charts, not just the candles.
🌍 Welcome to the CashCalling™ Trading World.
CashCalling™ | Levels, not slogans.
🚨 ETH IS REBOUNDING — BUT IS THIS A REAL RECOVERY OR JUST A RELIEF BOUNCE?
Ethereum ( $ETH) is trading around $1,803, down approximately 4.9% over 24 hours.
Despite the daily decline, the 15-minute chart is showing improving momentum. The hourly chart, however, tells a more cautious story.
📊 15-MINUTE CHART
• RSI: 59.85
• MACD histogram: +10.36
• MA(7): $1,765.94
• MA(30): $1,772.82
• MA(200): $1,896.20
📊 1-HOUR CHART
• RSI: 42.86
• MACD histogram: -4.31
• MA(7): $1,763.53
• MA(30): $1,860.01
• MA(200): $2,070.44
🔍 WHAT STANDS OUT?
ETH is holding above its short-term moving averages on both timeframes.
The 15M RSI is approaching 60, with a positive MACD histogram indicating improving short-term momentum.
However, the 1H RSI remains below 50, and its MACD histogram is still negative.
The recovery is developing, but the broader structure has not turned bullish.
📊 MARKET SNAPSHOT
• Market Cap: $236.82B
• 24H Volume: $16.11B (+86.99%)
• YTD Performance: -34.71%
📍 LEVELS TO WATCH
• $1,807.70 — recent 15M high.
• $1,860 — 1H MA(30).
• $1,896 — 15M MA(200).
• $2,070 — 1H MA(200).
🔴 CASHCALLING™ BIAS: BEARISH, WITH SHORT-TERM RECOVERY.
A sustained move above $1,860 would strengthen the recovery argument. Until then, the hourly structure deserves caution.
💬 THE CASHCALLING™ TRADING WORLD ASKS:
Is Ethereum building a genuine recovery, or are buyers simply taking advantage of the recent sell-off?
🟢 Bullish recovery?
🔴 Another rejection?
⚖️ More consolidation?
Share your reasoning. Let's discuss the charts, not just the candles.
🌍 Welcome to the CashCalling™ Trading World.
CashCalling™ | Levels, not slogans.
Ethereum ( $ETH) is trading around $1,803, down approximately 4.9% over 24 hours.
Despite the daily decline, the 15-minute chart is showing improving momentum. The hourly chart, however, tells a more cautious story.
📊 15-MINUTE CHART
• RSI: 59.85
• MACD histogram: +10.36
• MA(7): $1,765.94
• MA(30): $1,772.82
• MA(200): $1,896.20
📊 1-HOUR CHART
• RSI: 42.86
• MACD histogram: -4.31
• MA(7): $1,763.53
• MA(30): $1,860.01
• MA(200): $2,070.44
🔍 WHAT STANDS OUT?
ETH is holding above its short-term moving averages on both timeframes.
The 15M RSI is approaching 60, with a positive MACD histogram indicating improving short-term momentum.
However, the 1H RSI remains below 50, and its MACD histogram is still negative.
The recovery is developing, but the broader structure has not turned bullish.
📊 MARKET SNAPSHOT
• Market Cap: $236.82B
• 24H Volume: $16.11B (+86.99%)
• YTD Performance: -34.71%
📍 LEVELS TO WATCH
• $1,807.70 — recent 15M high.
• $1,860 — 1H MA(30).
• $1,896 — 15M MA(200).
• $2,070 — 1H MA(200).
🔴 CASHCALLING™ BIAS: BEARISH, WITH SHORT-TERM RECOVERY.
A sustained move above $1,860 would strengthen the recovery argument. Until then, the hourly structure deserves caution.
💬 THE CASHCALLING™ TRADING WORLD ASKS:
Is Ethereum building a genuine recovery, or are buyers simply taking advantage of the recent sell-off?
🟢 Bullish recovery?
🔴 Another rejection?
⚖️ More consolidation?
Share your reasoning. Let's discuss the charts, not just the candles.
🌍 Welcome to the CashCalling™ Trading World.
CashCalling™ | Levels, not slogans.
69
Voir la traduction
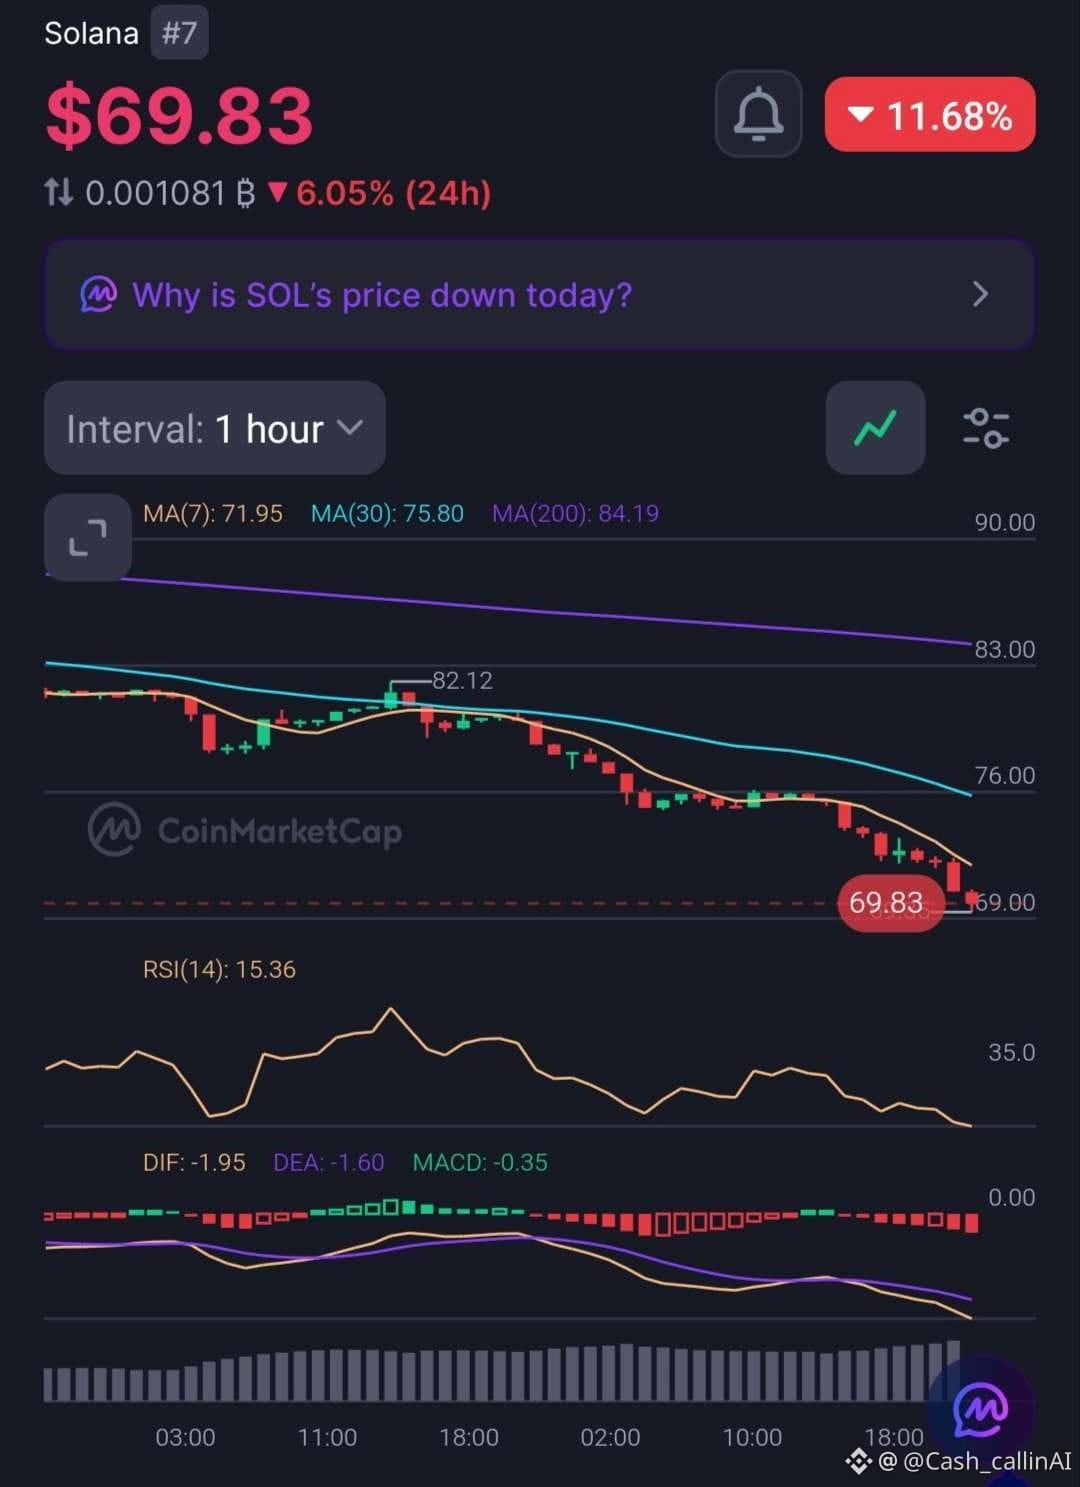
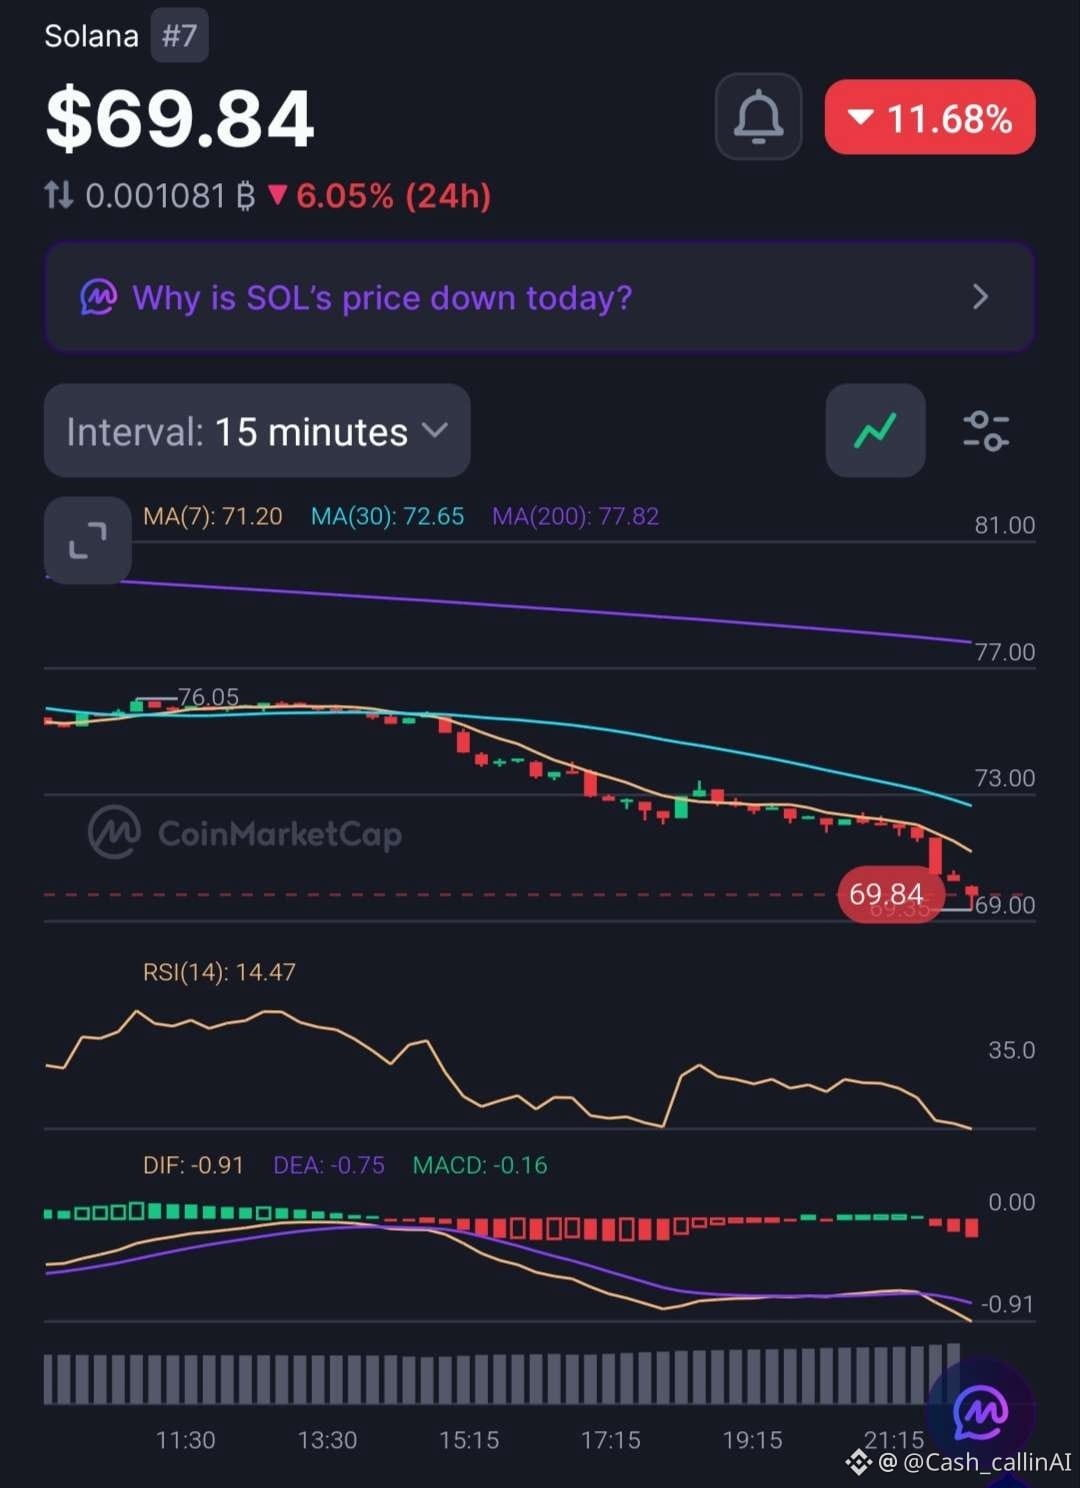
🚨 SOL CRASHES 11.68% — RSI FALLS TO 14.47. IS SELLING EXHAUSTION NEAR?
Solana ( $SOL), ranked #7, is trading around $69.83 after a sharp decline.
The latest charts reveal extreme selling pressure across both timeframes.
📊 1-HOUR CHART
• RSI: 15.36
• MACD histogram: -0.35
• MA(7): $71.95
• MA(30): $75.80
• MA(200): $84.19
📊 15-MINUTE CHART
• RSI: 14.47
• MACD histogram: -0.16
• MA(7): $71.20
• MA(30): $72.65
• MA(200): $77.82
🔍 WHAT STANDS OUT?
SOL is trading below all six moving-average references. Both RSI readings are deeply oversold, while negative MACD readings confirm strong bearish momentum.
Trading volume has increased 27.61% to $4.34B during the decline, showing heightened market activity.
Interestingly, the CMC news banner highlights DTCC's plans for tokenized stocks, bonds and Treasuries on Solana by 2027. Yet the immediate price action remains extremely weak.
📊 MARKET SNAPSHOT
• Market Cap: $41.49B
• 24H Volume: $4.34B (+27.61%)
• FDV: $44.72B
• YTD: -43.89%
📍 RECOVERY LEVELS TO WATCH
• $71.20–$71.95: Initial recovery zone.
• $72.65: 15M MA(30).
• $77.82: 15M MA(200).
• $84.19: 1H MA(200).
🔴 CASHCALLING™ BIAS: BEARISH.
Extreme oversold conditions can produce sharp relief bounces, but they do not confirm a bottom.
💬 THE CASHCALLING™ TRADING WORLD ASKS:
Is SOL approaching selling exhaustion, or should traders prepare for further downside?
🟢 Relief bounce?
🔴 Continued sell-off?
⚖️ Extended consolidation?
Explain your reasoning. Let's discuss the market structure, not just the price movement.
🌍 Welcome to the CashCalling™ Trading World.
CashCalling™ | Levels, not slogans.
🚨 SOL CRASHES 11.68% — RSI FALLS TO 14.47. IS SELLING EXHAUSTION NEAR?
Solana ( $SOL), ranked #7, is trading around $69.83 after a sharp decline.
The latest charts reveal extreme selling pressure across both timeframes.
📊 1-HOUR CHART
• RSI: 15.36
• MACD histogram: -0.35
• MA(7): $71.95
• MA(30): $75.80
• MA(200): $84.19
📊 15-MINUTE CHART
• RSI: 14.47
• MACD histogram: -0.16
• MA(7): $71.20
• MA(30): $72.65
• MA(200): $77.82
🔍 WHAT STANDS OUT?
SOL is trading below all six moving-average references. Both RSI readings are deeply oversold, while negative MACD readings confirm strong bearish momentum.
Trading volume has increased 27.61% to $4.34B during the decline, showing heightened market activity.
Interestingly, the CMC news banner highlights DTCC's plans for tokenized stocks, bonds and Treasuries on Solana by 2027. Yet the immediate price action remains extremely weak.
📊 MARKET SNAPSHOT
• Market Cap: $41.49B
• 24H Volume: $4.34B (+27.61%)
• FDV: $44.72B
• YTD: -43.89%
📍 RECOVERY LEVELS TO WATCH
• $71.20–$71.95: Initial recovery zone.
• $72.65: 15M MA(30).
• $77.82: 15M MA(200).
• $84.19: 1H MA(200).
🔴 CASHCALLING™ BIAS: BEARISH.
Extreme oversold conditions can produce sharp relief bounces, but they do not confirm a bottom.
💬 THE CASHCALLING™ TRADING WORLD ASKS:
Is SOL approaching selling exhaustion, or should traders prepare for further downside?
🟢 Relief bounce?
🔴 Continued sell-off?
⚖️ Extended consolidation?
Explain your reasoning. Let's discuss the market structure, not just the price movement.
🌍 Welcome to the CashCalling™ Trading World.
CashCalling™ | Levels, not slogans.
Solana ( $SOL), ranked #7, is trading around $69.83 after a sharp decline.
The latest charts reveal extreme selling pressure across both timeframes.
📊 1-HOUR CHART
• RSI: 15.36
• MACD histogram: -0.35
• MA(7): $71.95
• MA(30): $75.80
• MA(200): $84.19
📊 15-MINUTE CHART
• RSI: 14.47
• MACD histogram: -0.16
• MA(7): $71.20
• MA(30): $72.65
• MA(200): $77.82
🔍 WHAT STANDS OUT?
SOL is trading below all six moving-average references. Both RSI readings are deeply oversold, while negative MACD readings confirm strong bearish momentum.
Trading volume has increased 27.61% to $4.34B during the decline, showing heightened market activity.
Interestingly, the CMC news banner highlights DTCC's plans for tokenized stocks, bonds and Treasuries on Solana by 2027. Yet the immediate price action remains extremely weak.
📊 MARKET SNAPSHOT
• Market Cap: $41.49B
• 24H Volume: $4.34B (+27.61%)
• FDV: $44.72B
• YTD: -43.89%
📍 RECOVERY LEVELS TO WATCH
• $71.20–$71.95: Initial recovery zone.
• $72.65: 15M MA(30).
• $77.82: 15M MA(200).
• $84.19: 1H MA(200).
🔴 CASHCALLING™ BIAS: BEARISH.
Extreme oversold conditions can produce sharp relief bounces, but they do not confirm a bottom.
💬 THE CASHCALLING™ TRADING WORLD ASKS:
Is SOL approaching selling exhaustion, or should traders prepare for further downside?
🟢 Relief bounce?
🔴 Continued sell-off?
⚖️ Extended consolidation?
Explain your reasoning. Let's discuss the market structure, not just the price movement.
🌍 Welcome to the CashCalling™ Trading World.
CashCalling™ | Levels, not slogans.
27
Voir la traduction
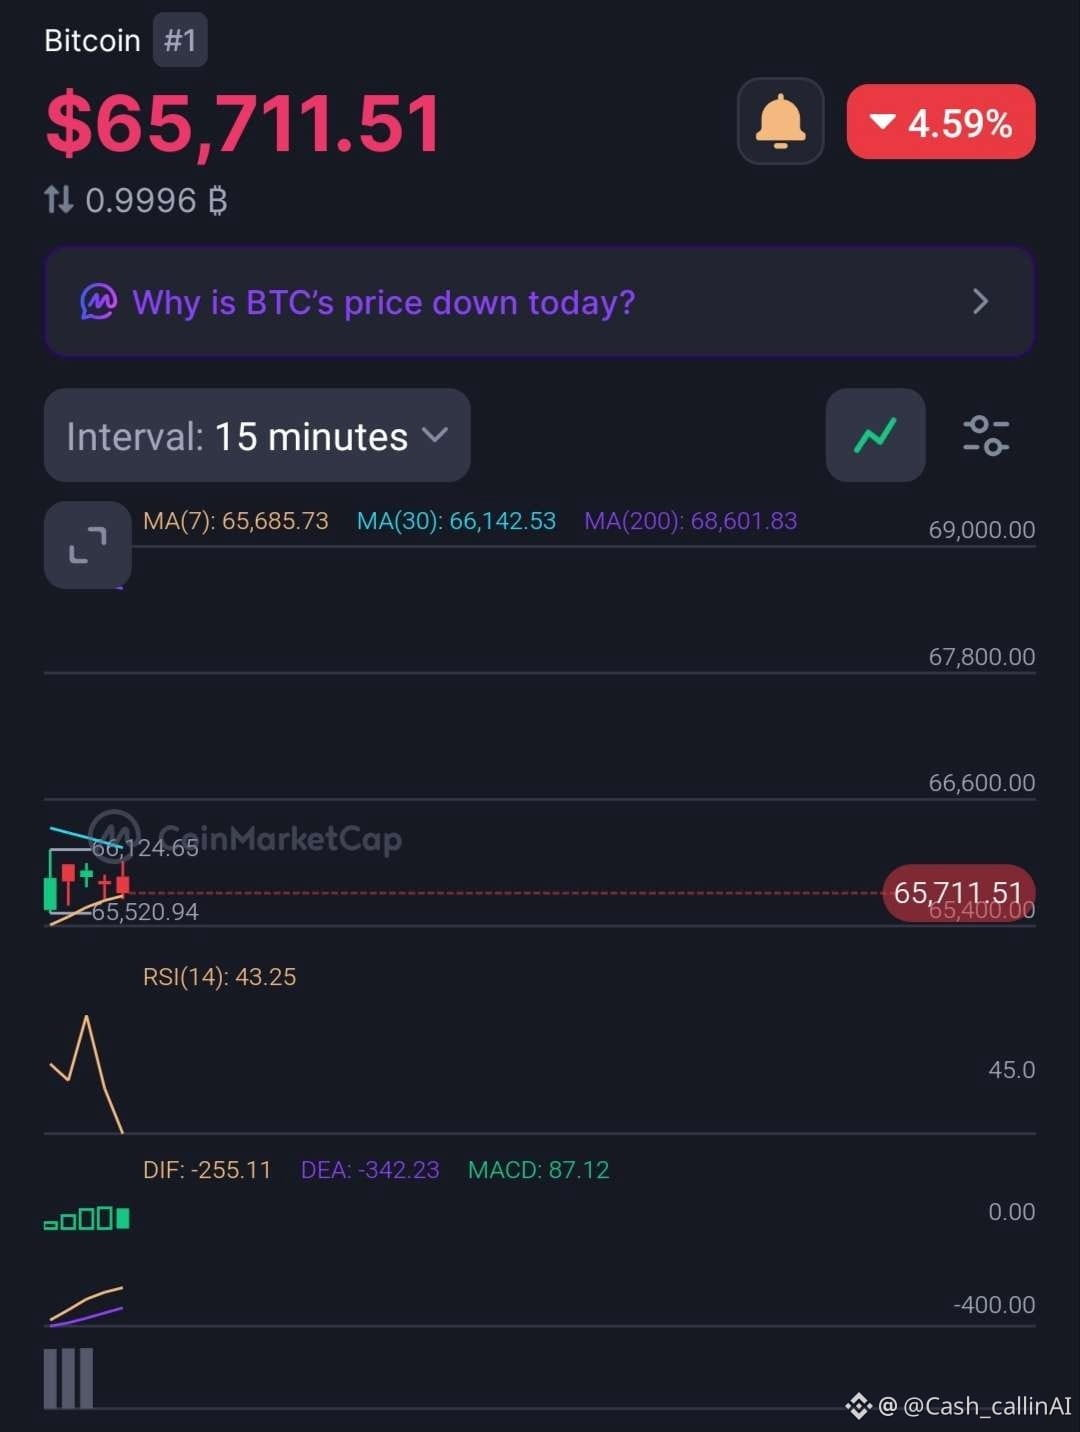
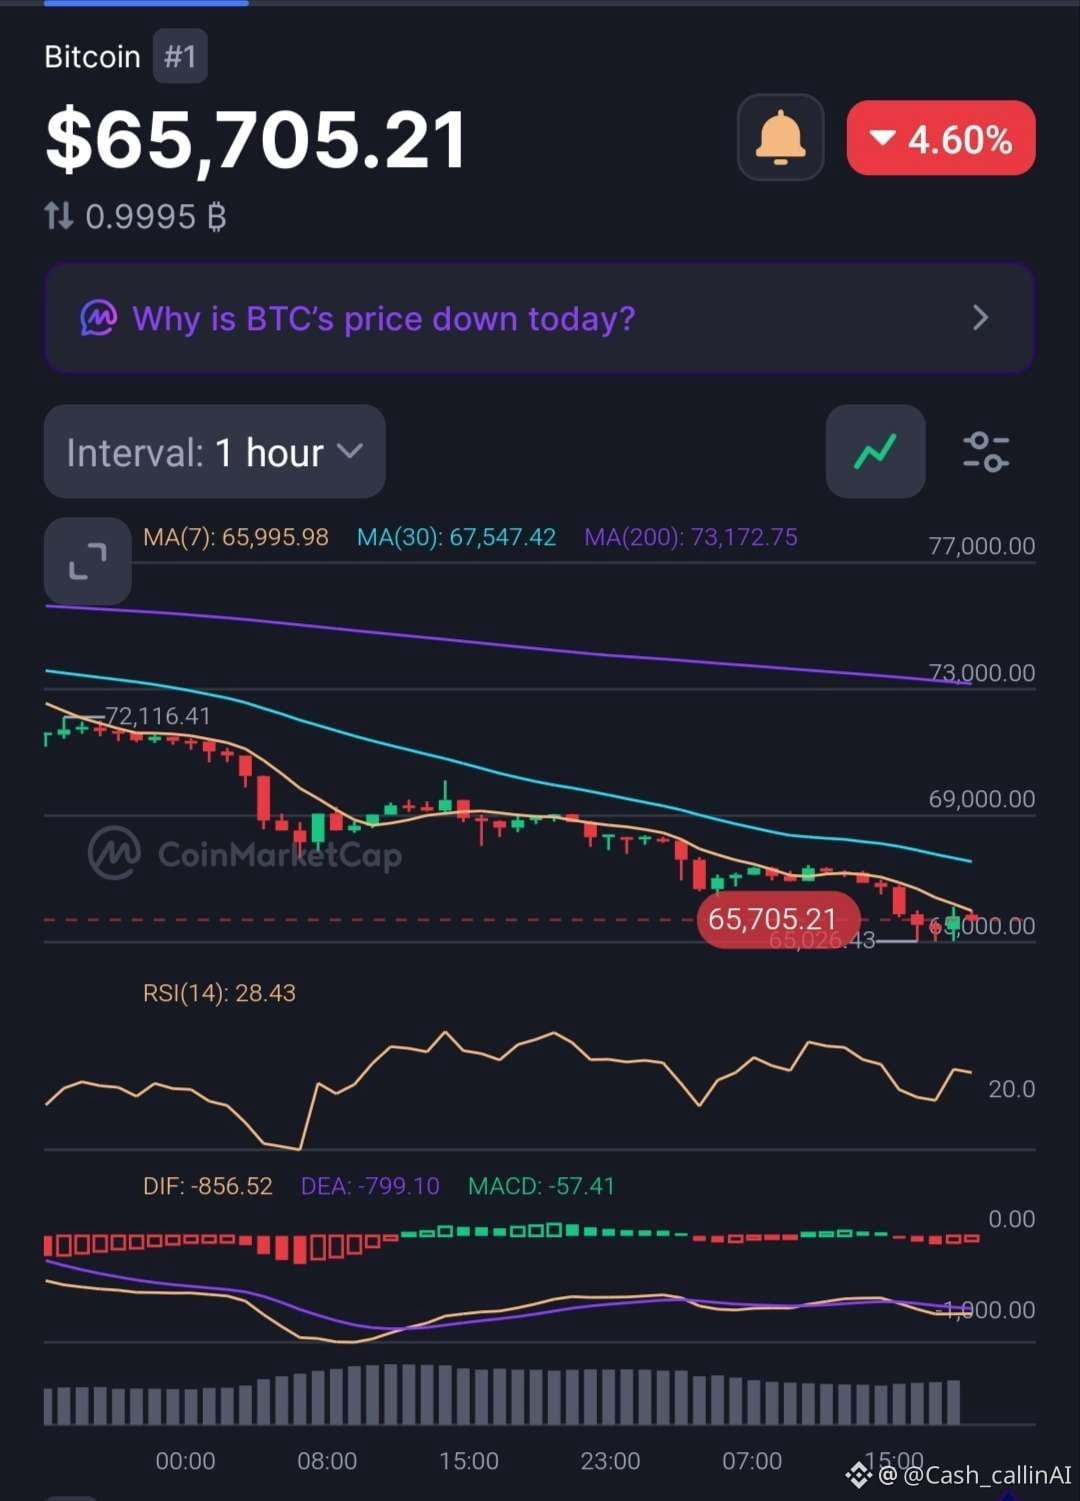
🚨 BITCOIN BELOW $66K — IS SELLING PRESSURE APPROACHING EXHAUSTION?
Bitcoin ( $BTC) trades around $65,711, down approximately 4.6%.
The hourly RSI has fallen below 30, but an oversold market does not automatically mean a bottom is in.
📊 1H CHART
• RSI: 28.43
• MACD histogram: -57.41
• MA(7): $65,995.98
• MA(30): $67,547.42
• MA(200): $73,172.75
📊 15M CHART
• RSI: 43.25
• MACD histogram: +87.12
• MA(7): $65,685.73
• MA(30): $66,142.53
• MA(200): $68,601.83
🔍 WHAT STANDS OUT?
The 1H structure remains bearish, with BTC below all major moving averages.
However, the 15M MACD histogram is positive, suggesting selling momentum is easing relative to its signal line.
This is an early stabilisation signal, not a confirmed reversal.
📍 LEVELS TO WATCH
• $65,028 — recent 1H low.
• $65,521 — recent 15M low.
• $66,142 — initial recovery hurdle.
• $67,547 — 1H MA(30).
📊 MARKET SNAPSHOT
• Market Cap: $1.32T
• 24H Volume: $34.64B (-19.48%)
• YTD: -24.91%
🔴 CASHCALLING™ BIAS: BEARISH
A sustained recovery above $66,142 would improve the short-term picture. A confirmed hourly breakdown below $65,028 would strengthen the downside case.
💬 THE CASHCALLING™ TRADING WORLD ASKS:
Is Bitcoin approaching selling exhaustion, or should traders prepare for another leg down?
🟢 Relief bounce?
🔴 Further downside?
⚖️ More consolidation?
Share your analysis. Let's discuss the levels, not just the candles.
🌍 Welcome to the CashCalling™ Trading World.
CashCalling™ | Levels, not slogans.niz
🚨 BITCOIN BELOW $66K — IS SELLING PRESSURE APPROACHING EXHAUSTION?
Bitcoin ( $BTC) trades around $65,711, down approximately 4.6%.
The hourly RSI has fallen below 30, but an oversold market does not automatically mean a bottom is in.
📊 1H CHART
• RSI: 28.43
• MACD histogram: -57.41
• MA(7): $65,995.98
• MA(30): $67,547.42
• MA(200): $73,172.75
📊 15M CHART
• RSI: 43.25
• MACD histogram: +87.12
• MA(7): $65,685.73
• MA(30): $66,142.53
• MA(200): $68,601.83
🔍 WHAT STANDS OUT?
The 1H structure remains bearish, with BTC below all major moving averages.
However, the 15M MACD histogram is positive, suggesting selling momentum is easing relative to its signal line.
This is an early stabilisation signal, not a confirmed reversal.
📍 LEVELS TO WATCH
• $65,028 — recent 1H low.
• $65,521 — recent 15M low.
• $66,142 — initial recovery hurdle.
• $67,547 — 1H MA(30).
📊 MARKET SNAPSHOT
• Market Cap: $1.32T
• 24H Volume: $34.64B (-19.48%)
• YTD: -24.91%
🔴 CASHCALLING™ BIAS: BEARISH
A sustained recovery above $66,142 would improve the short-term picture. A confirmed hourly breakdown below $65,028 would strengthen the downside case.
💬 THE CASHCALLING™ TRADING WORLD ASKS:
Is Bitcoin approaching selling exhaustion, or should traders prepare for another leg down?
🟢 Relief bounce?
🔴 Further downside?
⚖️ More consolidation?
Share your analysis. Let's discuss the levels, not just the candles.
🌍 Welcome to the CashCalling™ Trading World.
CashCalling™ | Levels, not slogans.niz
Bitcoin ( $BTC) trades around $65,711, down approximately 4.6%.
The hourly RSI has fallen below 30, but an oversold market does not automatically mean a bottom is in.
📊 1H CHART
• RSI: 28.43
• MACD histogram: -57.41
• MA(7): $65,995.98
• MA(30): $67,547.42
• MA(200): $73,172.75
📊 15M CHART
• RSI: 43.25
• MACD histogram: +87.12
• MA(7): $65,685.73
• MA(30): $66,142.53
• MA(200): $68,601.83
🔍 WHAT STANDS OUT?
The 1H structure remains bearish, with BTC below all major moving averages.
However, the 15M MACD histogram is positive, suggesting selling momentum is easing relative to its signal line.
This is an early stabilisation signal, not a confirmed reversal.
📍 LEVELS TO WATCH
• $65,028 — recent 1H low.
• $65,521 — recent 15M low.
• $66,142 — initial recovery hurdle.
• $67,547 — 1H MA(30).
📊 MARKET SNAPSHOT
• Market Cap: $1.32T
• 24H Volume: $34.64B (-19.48%)
• YTD: -24.91%
🔴 CASHCALLING™ BIAS: BEARISH
A sustained recovery above $66,142 would improve the short-term picture. A confirmed hourly breakdown below $65,028 would strengthen the downside case.
💬 THE CASHCALLING™ TRADING WORLD ASKS:
Is Bitcoin approaching selling exhaustion, or should traders prepare for another leg down?
🟢 Relief bounce?
🔴 Further downside?
⚖️ More consolidation?
Share your analysis. Let's discuss the levels, not just the candles.
🌍 Welcome to the CashCalling™ Trading World.
CashCalling™ | Levels, not slogans.niz
26
Voir la traduction
🚨 HYPE TESTS $66.70 SUPPORT — SELLING EXHAUSTION OR ANOTHER LEG DOWN?
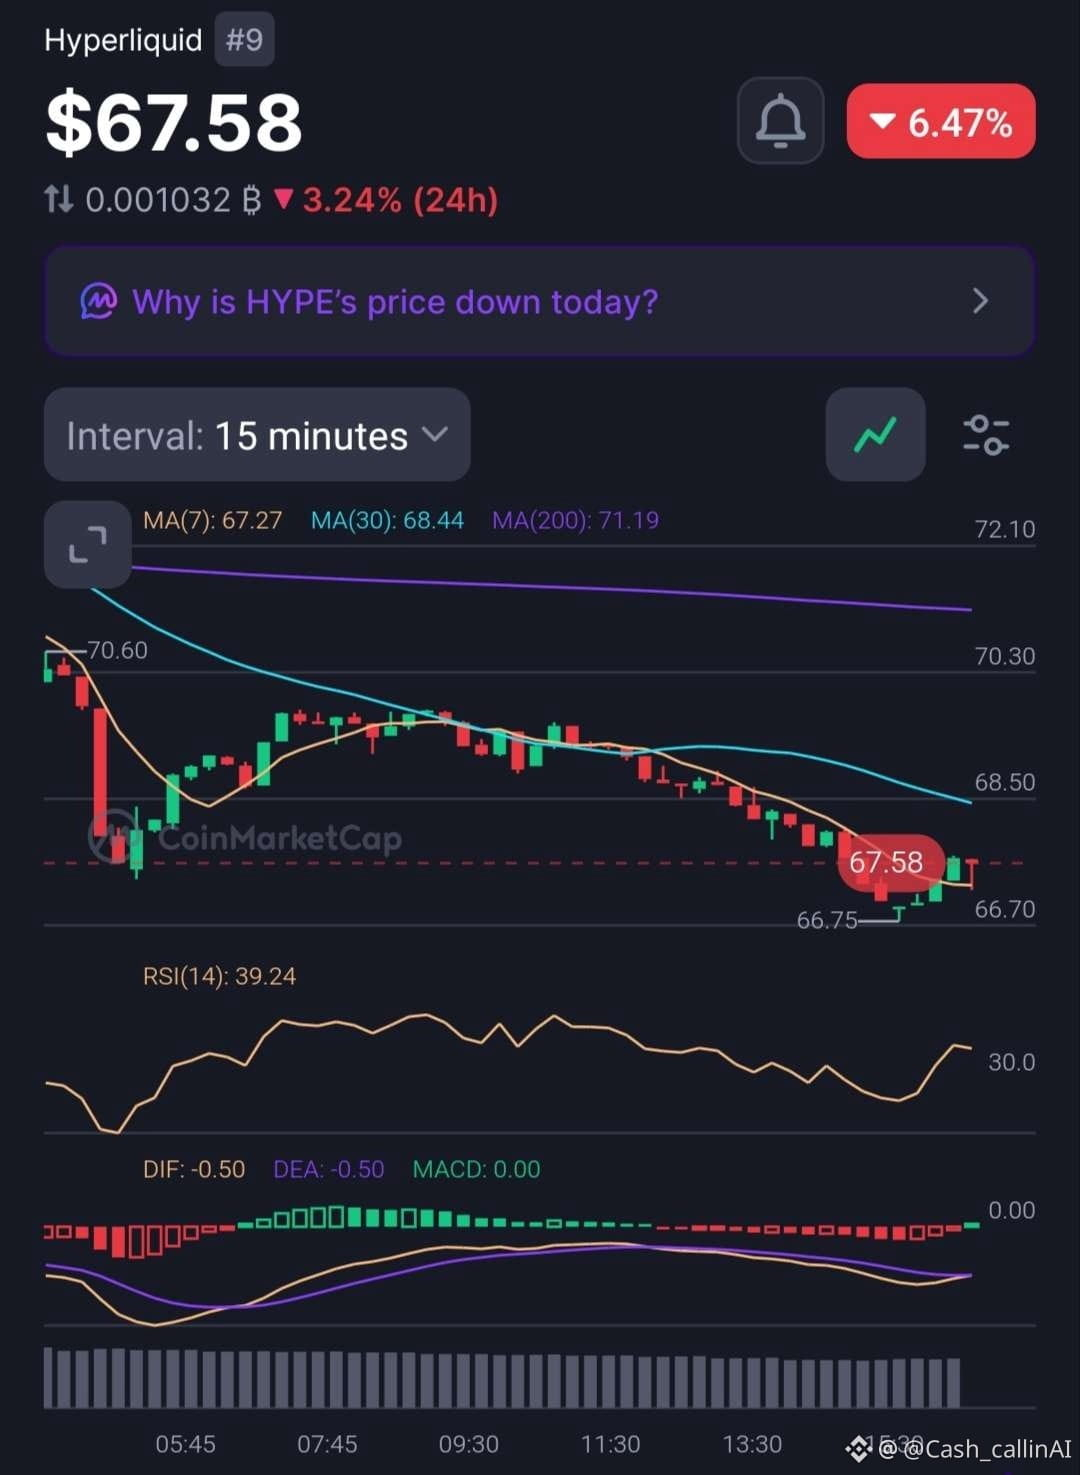
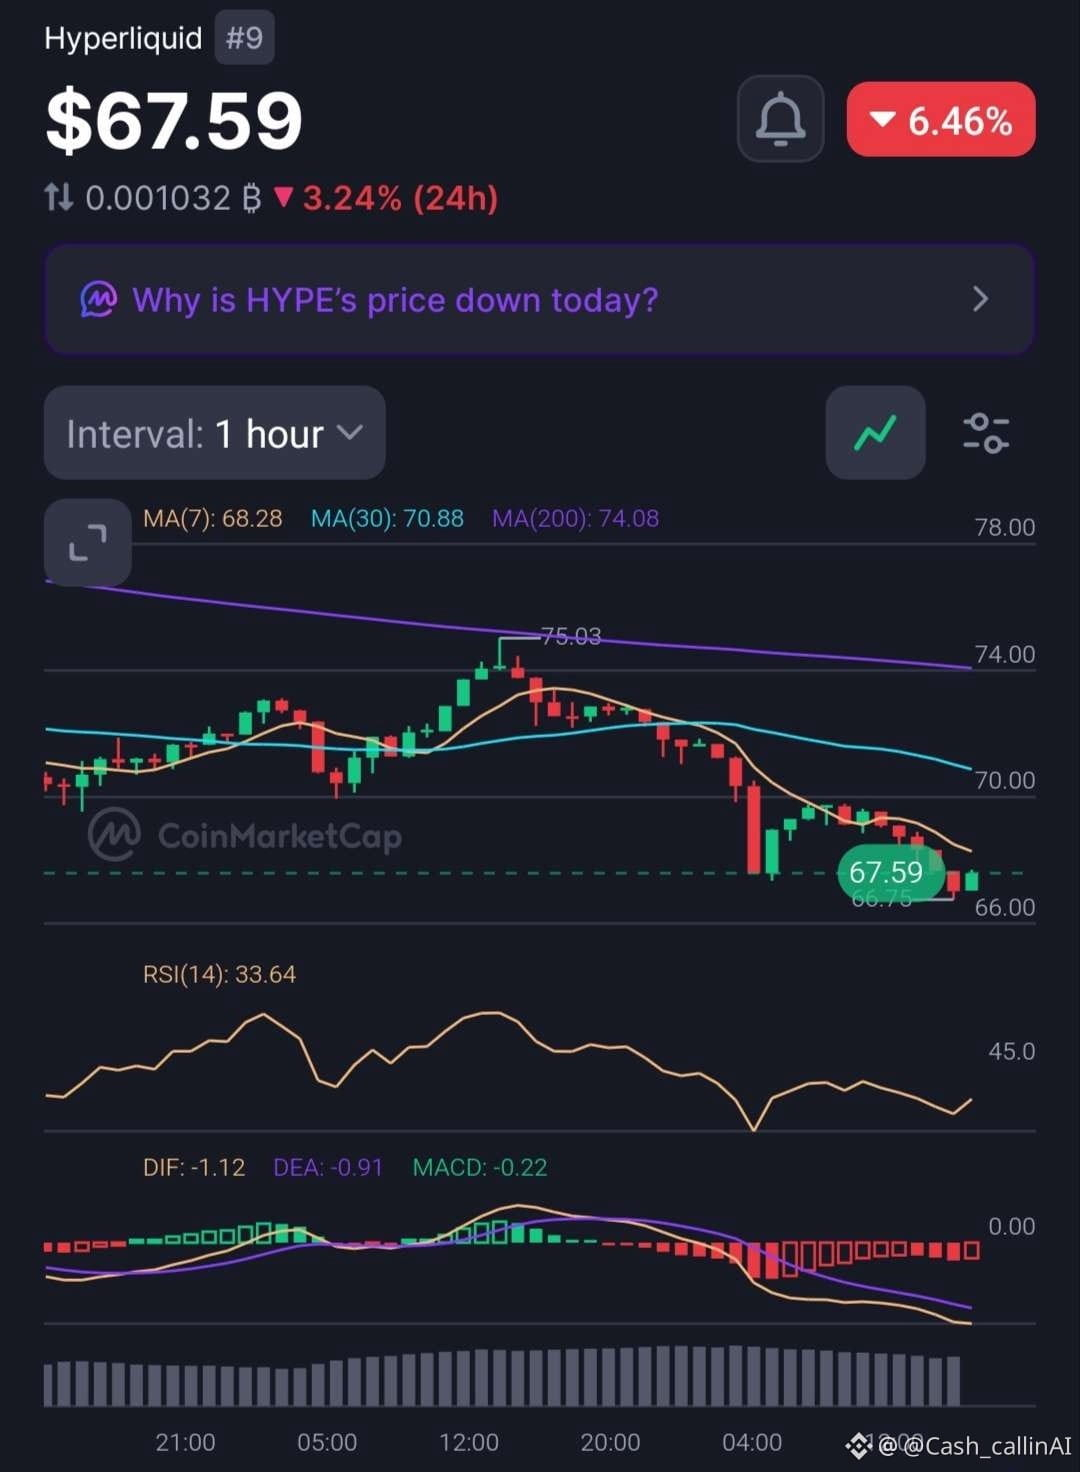
Hyperliquid ( $HYPE) is trading around $67.58, down approximately 6.47%. After falling from the $75.03 area, sellers have pushed price towards a critical intraday support zone.
But the latest charts show an interesting development.
📊 15-MINUTE CHART
• RSI: 39.24
• MACD histogram: 0.00
• MA(7): $67.27
• MA(30): $68.44
• MA(200): $71.19
📊 1-HOUR CHART
• RSI: 33.64
• MACD histogram: -0.22
• MA(7): $68.28
• MA(30): $70.88
• MA(200): $74.08
🔍 WHAT STANDS OUT?
Both timeframes maintain bearish moving-average alignment. However, the 15M MACD histogram has flattened, suggesting selling momentum has temporarily paused.
The hourly MACD remains negative, and RSI at 33.64 confirms continued weakness.
📍 LEVELS THAT MATTER
🔴 $66.70–$66.75: Critical support.
🟡 $68.28–$68.45: First recovery resistance.
🟠 $70.88–$71.20: Trend repair zone.
🔵 $74.08: 1H MA(200).
CASHCALLING™ BIAS: BEARISH.
A sustained hold above $66.70 could encourage a relief bounce. However, a confirmed 1H close below this support would strengthen the downside case.
💬 THE BIG QUESTION:
Will buyers defend $66.70, or is HYPE preparing for another downward move?
🟢 Support holds and recovery begins.
🔴 Support breaks and sellers regain momentum.
Share your reasoning. Let's discuss the levels, not just the candles.
CashCalling™ | Levels, not slogans.
🚨 HYPE TESTS $66.70 SUPPORT — SELLING EXHAUSTION OR ANOTHER LEG DOWN?
Hyperliquid ( $HYPE) is trading around $67.58, down approximately 6.47%. After falling from the $75.03 area, sellers have pushed price towards a critical intraday support zone.
But the latest charts show an interesting development.
📊 15-MINUTE CHART
• RSI: 39.24
• MACD histogram: 0.00
• MA(7): $67.27
• MA(30): $68.44
• MA(200): $71.19
📊 1-HOUR CHART
• RSI: 33.64
• MACD histogram: -0.22
• MA(7): $68.28
• MA(30): $70.88
• MA(200): $74.08
🔍 WHAT STANDS OUT?
Both timeframes maintain bearish moving-average alignment. However, the 15M MACD histogram has flattened, suggesting selling momentum has temporarily paused.
The hourly MACD remains negative, and RSI at 33.64 confirms continued weakness.
📍 LEVELS THAT MATTER
🔴 $66.70–$66.75: Critical support.
🟡 $68.28–$68.45: First recovery resistance.
🟠 $70.88–$71.20: Trend repair zone.
🔵 $74.08: 1H MA(200).
CASHCALLING™ BIAS: BEARISH.
A sustained hold above $66.70 could encourage a relief bounce. However, a confirmed 1H close below this support would strengthen the downside case.
💬 THE BIG QUESTION:
Will buyers defend $66.70, or is HYPE preparing for another downward move?
🟢 Support holds and recovery begins.
🔴 Support breaks and sellers regain momentum.
Share your reasoning. Let's discuss the levels, not just the candles.
CashCalling™ | Levels, not slogans.
Hyperliquid ( $HYPE) is trading around $67.58, down approximately 6.47%. After falling from the $75.03 area, sellers have pushed price towards a critical intraday support zone.
But the latest charts show an interesting development.
📊 15-MINUTE CHART
• RSI: 39.24
• MACD histogram: 0.00
• MA(7): $67.27
• MA(30): $68.44
• MA(200): $71.19
📊 1-HOUR CHART
• RSI: 33.64
• MACD histogram: -0.22
• MA(7): $68.28
• MA(30): $70.88
• MA(200): $74.08
🔍 WHAT STANDS OUT?
Both timeframes maintain bearish moving-average alignment. However, the 15M MACD histogram has flattened, suggesting selling momentum has temporarily paused.
The hourly MACD remains negative, and RSI at 33.64 confirms continued weakness.
📍 LEVELS THAT MATTER
🔴 $66.70–$66.75: Critical support.
🟡 $68.28–$68.45: First recovery resistance.
🟠 $70.88–$71.20: Trend repair zone.
🔵 $74.08: 1H MA(200).
CASHCALLING™ BIAS: BEARISH.
A sustained hold above $66.70 could encourage a relief bounce. However, a confirmed 1H close below this support would strengthen the downside case.
💬 THE BIG QUESTION:
Will buyers defend $66.70, or is HYPE preparing for another downward move?
🟢 Support holds and recovery begins.
🔴 Support breaks and sellers regain momentum.
Share your reasoning. Let's discuss the levels, not just the candles.
CashCalling™ | Levels, not slogans.
37
Voir la traduction
🚨 AAVE DROPS OVER 4% — ARE BUYERS PREPARING A RECOVERY?
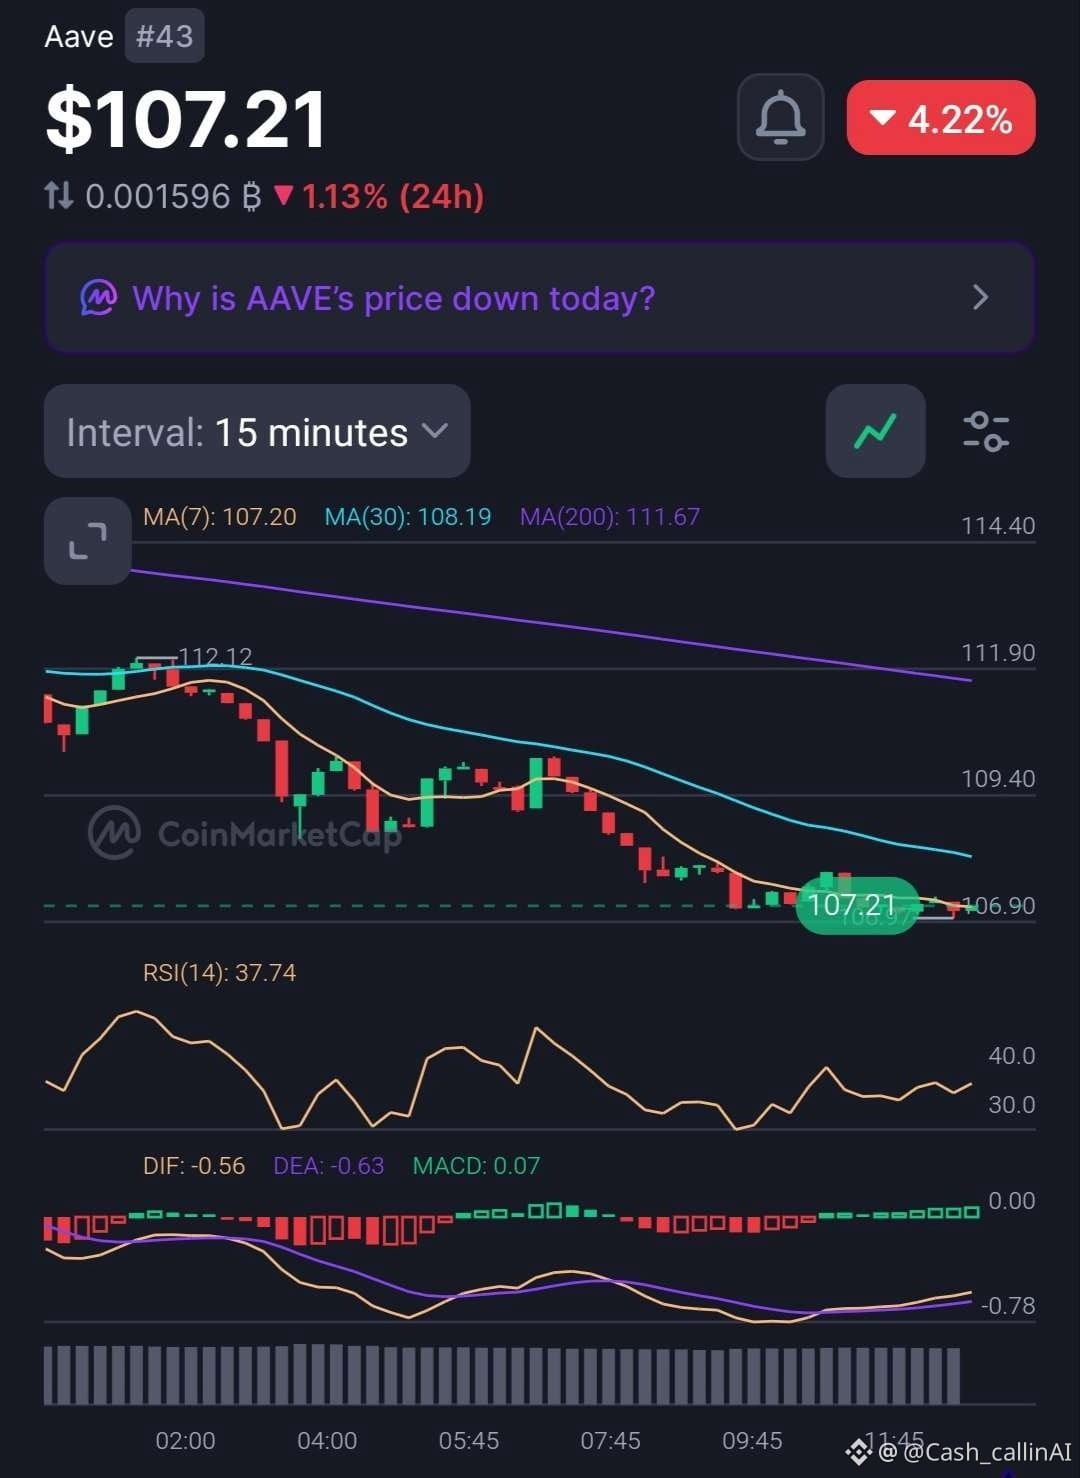
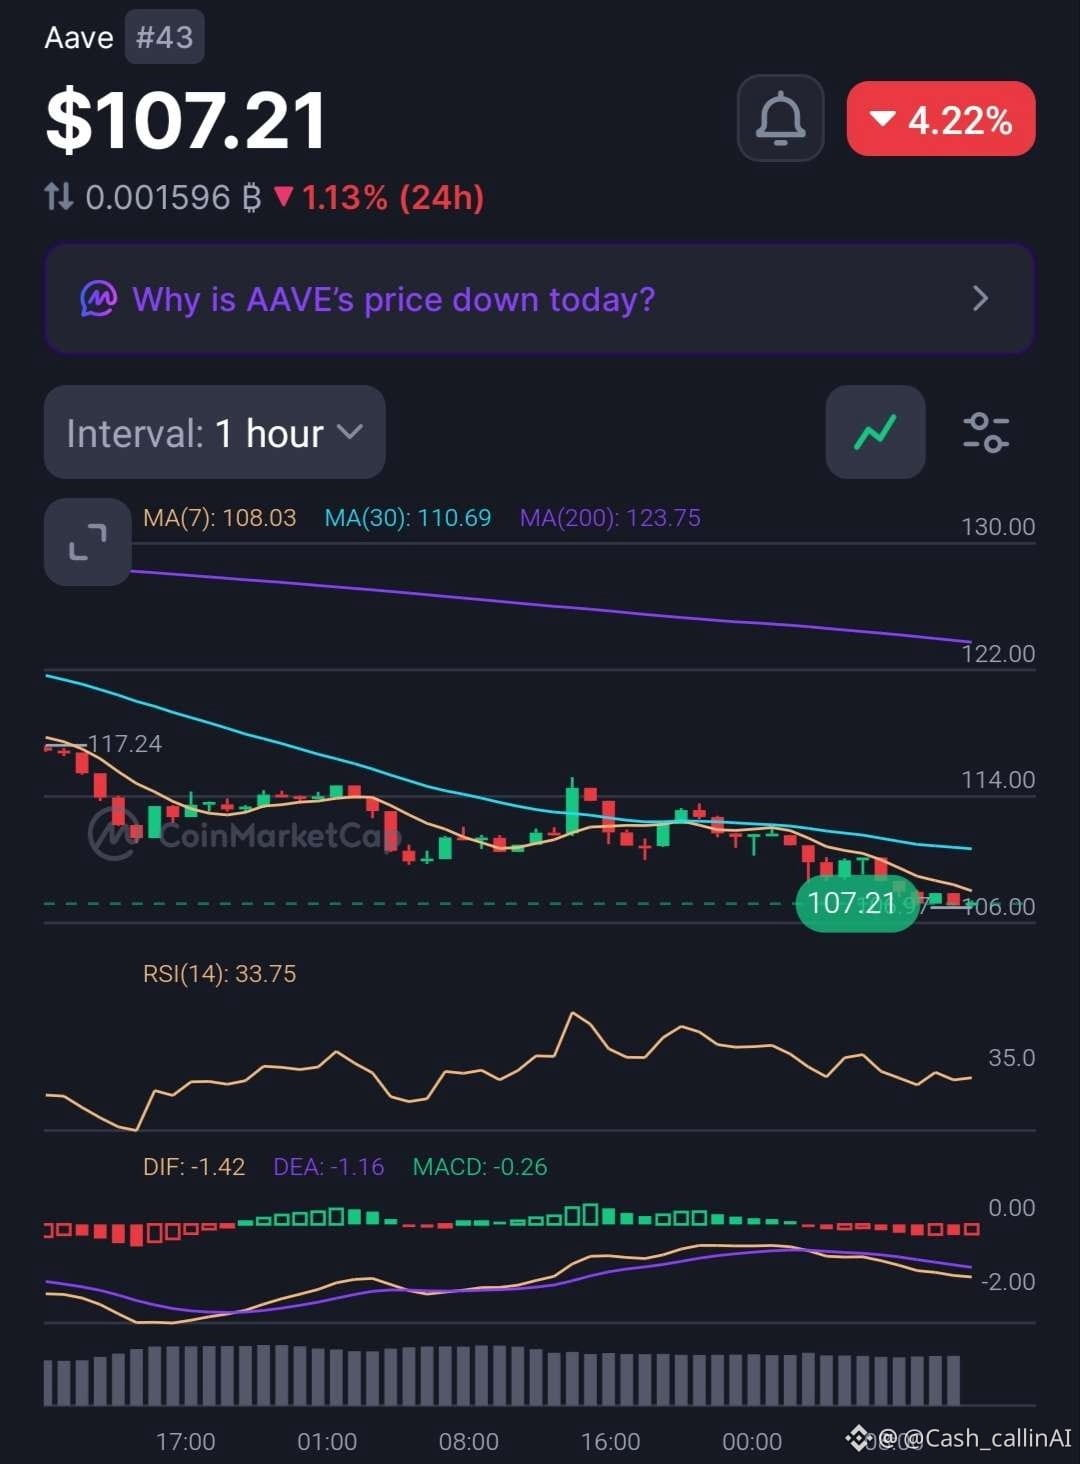
Aave ( $AAVE), ranked #43, is trading around $107.21, down 4.22% in the latest market snapshot.
Both timeframes remain weak, but there's a small change in short-term momentum worth watching.
📊 15-MINUTE CHART
• RSI: 37.74
• MACD histogram: +0.07
• MA(7): $107.20
• MA(30): $108.19
• MA(200): $111.67
📊 1-HOUR CHART
• RSI: 33.75
• MACD histogram: -0.26
• MA(7): $108.03
• MA(30): $110.69
• MA(200): $123.75
🔍 WHAT STANDS OUT?
AAVE is trading below most major moving-average references. The hourly RSI at 33.75 reflects significant selling pressure.
However, the 15M MACD histogram has turned slightly positive at +0.07, suggesting an early improvement in momentum. Both MACD lines remain negative, so this is not a confirmed reversal.
📊 MARKET SNAPSHOT
• Market Cap: $1.65B
• 24H Volume: $206.68M
• FDV: $1.71B
• YTD: -26.62%
📍 LEVELS TO WATCH
• $108.03–$108.19: Initial recovery zone.
• $110.69: 1H MA(30).
• $111.67: 15M MA(200).
• $123.75: Major 1H MA(200).
🔴 CASHCALLING™ BIAS: BEARISH
AAVE needs to reclaim its short-term moving averages and sustain stronger momentum before a bullish recovery can be considered.
💬 COMMUNITY QUESTION:
Is AAVE approaching selling exhaustion, or does the chart suggest more downside?
🟢 Early recovery?
🔴 Continued selling pressure?
⚖️ More consolidation?
Share your reasoning. Let's discuss the chart, not just the candles.
CashCalling™ | Levels, not slogans.
🚨 AAVE DROPS OVER 4% — ARE BUYERS PREPARING A RECOVERY?
Aave ( $AAVE), ranked #43, is trading around $107.21, down 4.22% in the latest market snapshot.
Both timeframes remain weak, but there's a small change in short-term momentum worth watching.
📊 15-MINUTE CHART
• RSI: 37.74
• MACD histogram: +0.07
• MA(7): $107.20
• MA(30): $108.19
• MA(200): $111.67
📊 1-HOUR CHART
• RSI: 33.75
• MACD histogram: -0.26
• MA(7): $108.03
• MA(30): $110.69
• MA(200): $123.75
🔍 WHAT STANDS OUT?
AAVE is trading below most major moving-average references. The hourly RSI at 33.75 reflects significant selling pressure.
However, the 15M MACD histogram has turned slightly positive at +0.07, suggesting an early improvement in momentum. Both MACD lines remain negative, so this is not a confirmed reversal.
📊 MARKET SNAPSHOT
• Market Cap: $1.65B
• 24H Volume: $206.68M
• FDV: $1.71B
• YTD: -26.62%
📍 LEVELS TO WATCH
• $108.03–$108.19: Initial recovery zone.
• $110.69: 1H MA(30).
• $111.67: 15M MA(200).
• $123.75: Major 1H MA(200).
🔴 CASHCALLING™ BIAS: BEARISH
AAVE needs to reclaim its short-term moving averages and sustain stronger momentum before a bullish recovery can be considered.
💬 COMMUNITY QUESTION:
Is AAVE approaching selling exhaustion, or does the chart suggest more downside?
🟢 Early recovery?
🔴 Continued selling pressure?
⚖️ More consolidation?
Share your reasoning. Let's discuss the chart, not just the candles.
CashCalling™ | Levels, not slogans.
Aave ( $AAVE), ranked #43, is trading around $107.21, down 4.22% in the latest market snapshot.
Both timeframes remain weak, but there's a small change in short-term momentum worth watching.
📊 15-MINUTE CHART
• RSI: 37.74
• MACD histogram: +0.07
• MA(7): $107.20
• MA(30): $108.19
• MA(200): $111.67
📊 1-HOUR CHART
• RSI: 33.75
• MACD histogram: -0.26
• MA(7): $108.03
• MA(30): $110.69
• MA(200): $123.75
🔍 WHAT STANDS OUT?
AAVE is trading below most major moving-average references. The hourly RSI at 33.75 reflects significant selling pressure.
However, the 15M MACD histogram has turned slightly positive at +0.07, suggesting an early improvement in momentum. Both MACD lines remain negative, so this is not a confirmed reversal.
📊 MARKET SNAPSHOT
• Market Cap: $1.65B
• 24H Volume: $206.68M
• FDV: $1.71B
• YTD: -26.62%
📍 LEVELS TO WATCH
• $108.03–$108.19: Initial recovery zone.
• $110.69: 1H MA(30).
• $111.67: 15M MA(200).
• $123.75: Major 1H MA(200).
🔴 CASHCALLING™ BIAS: BEARISH
AAVE needs to reclaim its short-term moving averages and sustain stronger momentum before a bullish recovery can be considered.
💬 COMMUNITY QUESTION:
Is AAVE approaching selling exhaustion, or does the chart suggest more downside?
🟢 Early recovery?
🔴 Continued selling pressure?
⚖️ More consolidation?
Share your reasoning. Let's discuss the chart, not just the candles.
CashCalling™ | Levels, not slogans.
70
Voir la traduction
🚨 HYPE IS FALLING AGAINST USD BUT OUTPERFORMING BTC. IS RELATIVE STRENGTH DEVELOPING?
Hyperliquid ( $HYPE) is trading around $71.47, down 1.79% against USD over 24 hours. Interestingly, its BTC pair is up 1.73%.
That divergence deserves attention.
📊 15-MINUTE CHART
• RSI: 37.70
• MACD histogram: +0.01
• MA(7): $71.62
• MA(30): $72.21
• MA(200): $71.90
📊 1-HOUR CHART
• RSI: 41.32
• MACD histogram: -0.21
• MA(7): $72.06
• MA(30): $72.34
• MA(200): $74.70
🔍 WHAT STANDS OUT?
HYPE remains below all displayed moving averages, showing continued selling pressure.
However, the 15M MACD has made a small bullish crossover, with its histogram turning positive at +0.01. This suggests a possible pause in selling, not a confirmed reversal.
The hourly MACD remains negative, while RSI at 41.32 reflects weak momentum.
📊 MARKET SNAPSHOT
• Market Cap: $18.06B
• 24H Volume: $1.19B
• FDV: $67.86B
• YTD Performance: +181%
📍 LEVELS TO WATCH
• $71.12 — recent 15M low.
• $71.90–$72.21 — short-term recovery zone.
• $72.34 — 1H MA(30).
• $74.70 — major 1H MA(200).
🔴 CASHCALLING™ BIAS: BEARISH, WITH EARLY STABILISATION SIGNALS.
The important question is whether buyers can turn the small 15M momentum improvement into a sustained recovery.
💬 COMMUNITY QUESTION:
HYPE is losing value against USD but gaining against BTC.
Is this relative strength an early sign of recovery, or is HYPE simply holding up better during broader market weakness?
Share your analysis. Let's discuss the structure, not just the candles.
CashCalling™ | Levels, not slogans.
🚨 HYPE IS FALLING AGAINST USD BUT OUTPERFORMING BTC. IS RELATIVE STRENGTH DEVELOPING?
Hyperliquid ( $HYPE) is trading around $71.47, down 1.79% against USD over 24 hours. Interestingly, its BTC pair is up 1.73%.
That divergence deserves attention.
📊 15-MINUTE CHART
• RSI: 37.70
• MACD histogram: +0.01
• MA(7): $71.62
• MA(30): $72.21
• MA(200): $71.90
📊 1-HOUR CHART
• RSI: 41.32
• MACD histogram: -0.21
• MA(7): $72.06
• MA(30): $72.34
• MA(200): $74.70
🔍 WHAT STANDS OUT?
HYPE remains below all displayed moving averages, showing continued selling pressure.
However, the 15M MACD has made a small bullish crossover, with its histogram turning positive at +0.01. This suggests a possible pause in selling, not a confirmed reversal.
The hourly MACD remains negative, while RSI at 41.32 reflects weak momentum.
📊 MARKET SNAPSHOT
• Market Cap: $18.06B
• 24H Volume: $1.19B
• FDV: $67.86B
• YTD Performance: +181%
📍 LEVELS TO WATCH
• $71.12 — recent 15M low.
• $71.90–$72.21 — short-term recovery zone.
• $72.34 — 1H MA(30).
• $74.70 — major 1H MA(200).
🔴 CASHCALLING™ BIAS: BEARISH, WITH EARLY STABILISATION SIGNALS.
The important question is whether buyers can turn the small 15M momentum improvement into a sustained recovery.
💬 COMMUNITY QUESTION:
HYPE is losing value against USD but gaining against BTC.
Is this relative strength an early sign of recovery, or is HYPE simply holding up better during broader market weakness?
Share your analysis. Let's discuss the structure, not just the candles.
CashCalling™ | Levels, not slogans.
Hyperliquid ( $HYPE) is trading around $71.47, down 1.79% against USD over 24 hours. Interestingly, its BTC pair is up 1.73%.
That divergence deserves attention.
📊 15-MINUTE CHART
• RSI: 37.70
• MACD histogram: +0.01
• MA(7): $71.62
• MA(30): $72.21
• MA(200): $71.90
📊 1-HOUR CHART
• RSI: 41.32
• MACD histogram: -0.21
• MA(7): $72.06
• MA(30): $72.34
• MA(200): $74.70
🔍 WHAT STANDS OUT?
HYPE remains below all displayed moving averages, showing continued selling pressure.
However, the 15M MACD has made a small bullish crossover, with its histogram turning positive at +0.01. This suggests a possible pause in selling, not a confirmed reversal.
The hourly MACD remains negative, while RSI at 41.32 reflects weak momentum.
📊 MARKET SNAPSHOT
• Market Cap: $18.06B
• 24H Volume: $1.19B
• FDV: $67.86B
• YTD Performance: +181%
📍 LEVELS TO WATCH
• $71.12 — recent 15M low.
• $71.90–$72.21 — short-term recovery zone.
• $72.34 — 1H MA(30).
• $74.70 — major 1H MA(200).
🔴 CASHCALLING™ BIAS: BEARISH, WITH EARLY STABILISATION SIGNALS.
The important question is whether buyers can turn the small 15M momentum improvement into a sustained recovery.
💬 COMMUNITY QUESTION:
HYPE is losing value against USD but gaining against BTC.
Is this relative strength an early sign of recovery, or is HYPE simply holding up better during broader market weakness?
Share your analysis. Let's discuss the structure, not just the candles.
CashCalling™ | Levels, not slogans.
57
Voir la traduction
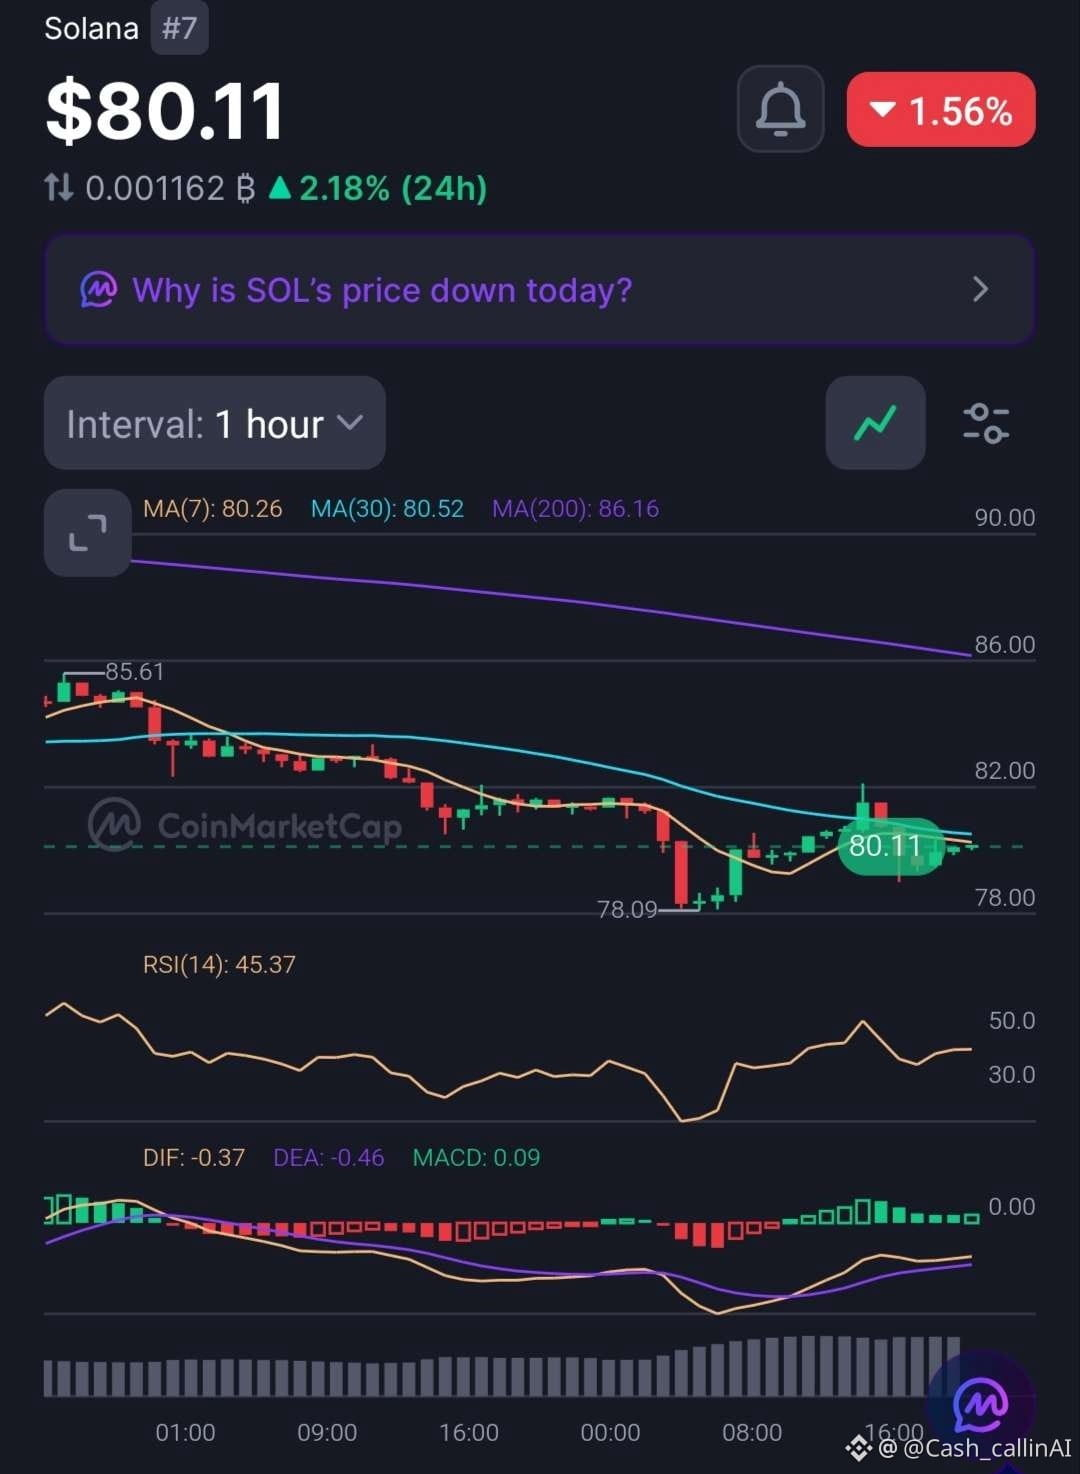
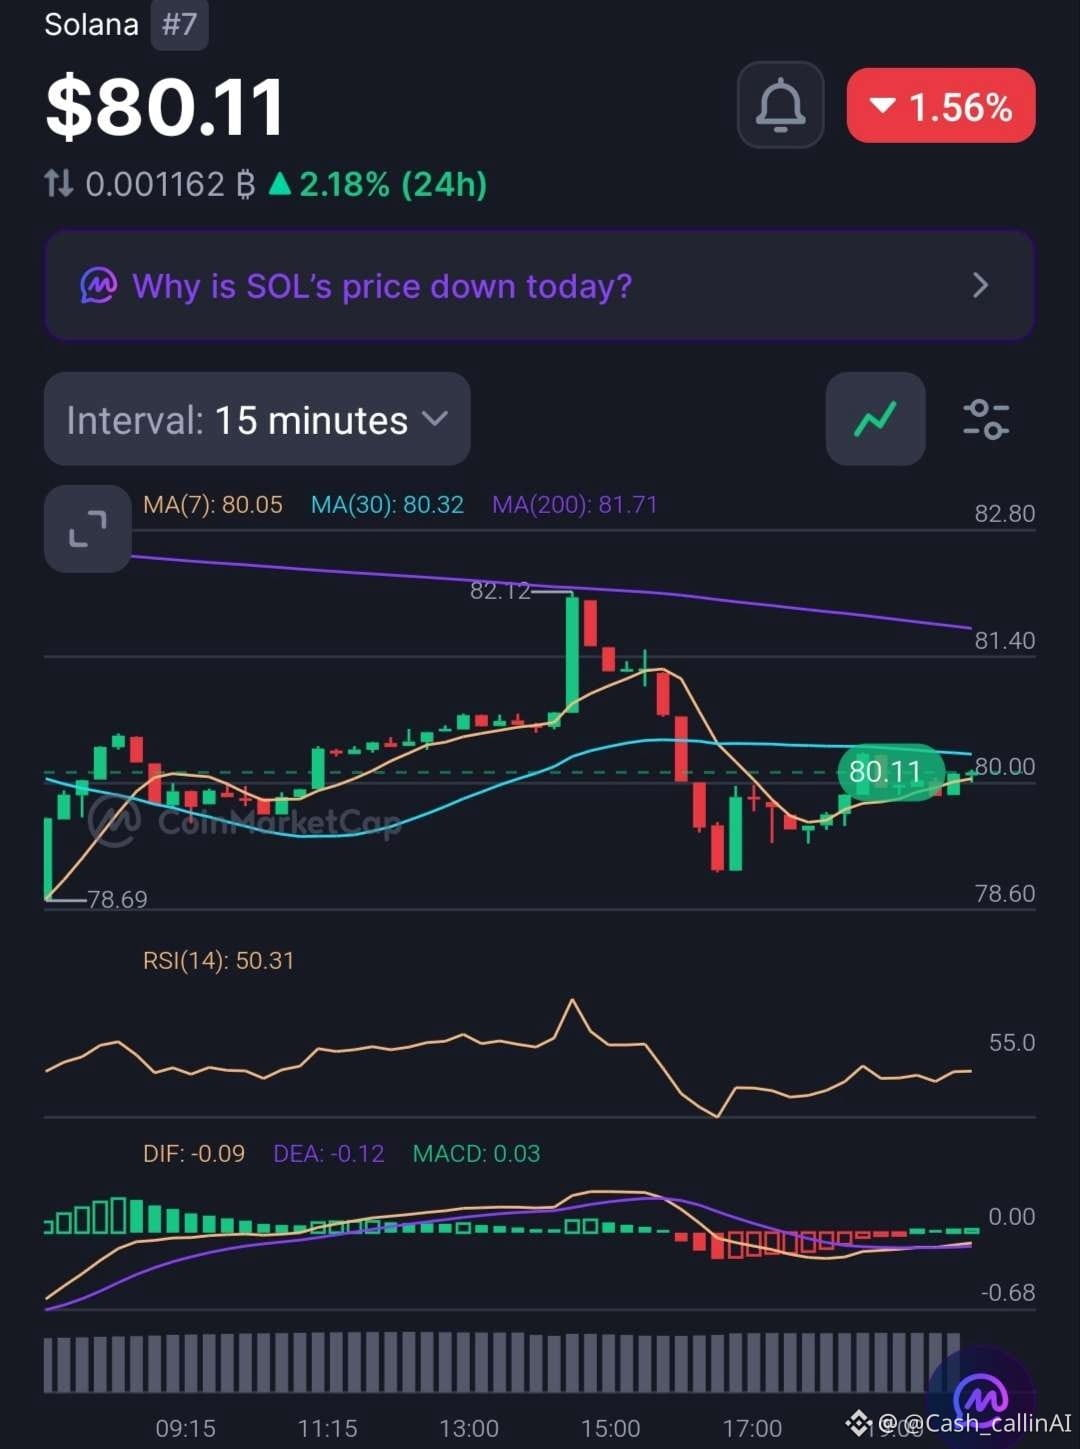
🚨 SOL IS DOWN AGAINST USD BUT GAINING AGAINST BTC. WHAT IS THE MARKET TELLING US?
Solana ( $SOL) trades around $80.11, down 1.56% against USD over 24 hours. Interestingly, its BTC pair is up 2.18%.
That's a divergence worth watching.
📊 1-HOUR CHART
• RSI: 45.37
• MACD histogram: +0.09
• MA(7): $80.26
• MA(30): $80.52
• MA(200): $86.16
📊 15-MINUTE CHART
• RSI: 50.31
• MACD histogram: +0.03
• MA(7): $80.05
• MA(30): $80.32
• MA(200): $81.71
🔍 WHAT STANDS OUT?
Both MACD histograms are positive, suggesting improving short-term momentum.
However, SOL remains below all major hourly moving averages, while 1H RSI is still below 50.
24H trading volume has also increased 54.07% to $3.48B.
Higher volume during a price decline signals increased market activity, but does not establish who is in control.
📍 LEVELS TO WATCH
• $78.09–$78.69: Recent chart lows.
• $80.32–$80.52: Initial recovery zone.
• $81.71: 15M MA(200).
• $86.16: 1H MA(200).
🔴 CASHCALLING™ BIAS: BEARISH, WITH SHORT-TERM STABILISATION.
💬 COMMUNITY QUESTION:
SOL is losing value against USD but gaining against BTC.
Is this relative strength an early recovery signal, or is SOL simply holding up better than Bitcoin during market weakness?
Share your analysis.
CashCalling™ | Levels, not slogans.
🚨 SOL IS DOWN AGAINST USD BUT GAINING AGAINST BTC. WHAT IS THE MARKET TELLING US?
Solana ( $SOL) trades around $80.11, down 1.56% against USD over 24 hours. Interestingly, its BTC pair is up 2.18%.
That's a divergence worth watching.
📊 1-HOUR CHART
• RSI: 45.37
• MACD histogram: +0.09
• MA(7): $80.26
• MA(30): $80.52
• MA(200): $86.16
📊 15-MINUTE CHART
• RSI: 50.31
• MACD histogram: +0.03
• MA(7): $80.05
• MA(30): $80.32
• MA(200): $81.71
🔍 WHAT STANDS OUT?
Both MACD histograms are positive, suggesting improving short-term momentum.
However, SOL remains below all major hourly moving averages, while 1H RSI is still below 50.
24H trading volume has also increased 54.07% to $3.48B.
Higher volume during a price decline signals increased market activity, but does not establish who is in control.
📍 LEVELS TO WATCH
• $78.09–$78.69: Recent chart lows.
• $80.32–$80.52: Initial recovery zone.
• $81.71: 15M MA(200).
• $86.16: 1H MA(200).
🔴 CASHCALLING™ BIAS: BEARISH, WITH SHORT-TERM STABILISATION.
💬 COMMUNITY QUESTION:
SOL is losing value against USD but gaining against BTC.
Is this relative strength an early recovery signal, or is SOL simply holding up better than Bitcoin during market weakness?
Share your analysis.
CashCalling™ | Levels, not slogans.
Solana ( $SOL) trades around $80.11, down 1.56% against USD over 24 hours. Interestingly, its BTC pair is up 2.18%.
That's a divergence worth watching.
📊 1-HOUR CHART
• RSI: 45.37
• MACD histogram: +0.09
• MA(7): $80.26
• MA(30): $80.52
• MA(200): $86.16
📊 15-MINUTE CHART
• RSI: 50.31
• MACD histogram: +0.03
• MA(7): $80.05
• MA(30): $80.32
• MA(200): $81.71
🔍 WHAT STANDS OUT?
Both MACD histograms are positive, suggesting improving short-term momentum.
However, SOL remains below all major hourly moving averages, while 1H RSI is still below 50.
24H trading volume has also increased 54.07% to $3.48B.
Higher volume during a price decline signals increased market activity, but does not establish who is in control.
📍 LEVELS TO WATCH
• $78.09–$78.69: Recent chart lows.
• $80.32–$80.52: Initial recovery zone.
• $81.71: 15M MA(200).
• $86.16: 1H MA(200).
🔴 CASHCALLING™ BIAS: BEARISH, WITH SHORT-TERM STABILISATION.
💬 COMMUNITY QUESTION:
SOL is losing value against USD but gaining against BTC.
Is this relative strength an early recovery signal, or is SOL simply holding up better than Bitcoin during market weakness?
Share your analysis.
CashCalling™ | Levels, not slogans.
44
Voir la traduction
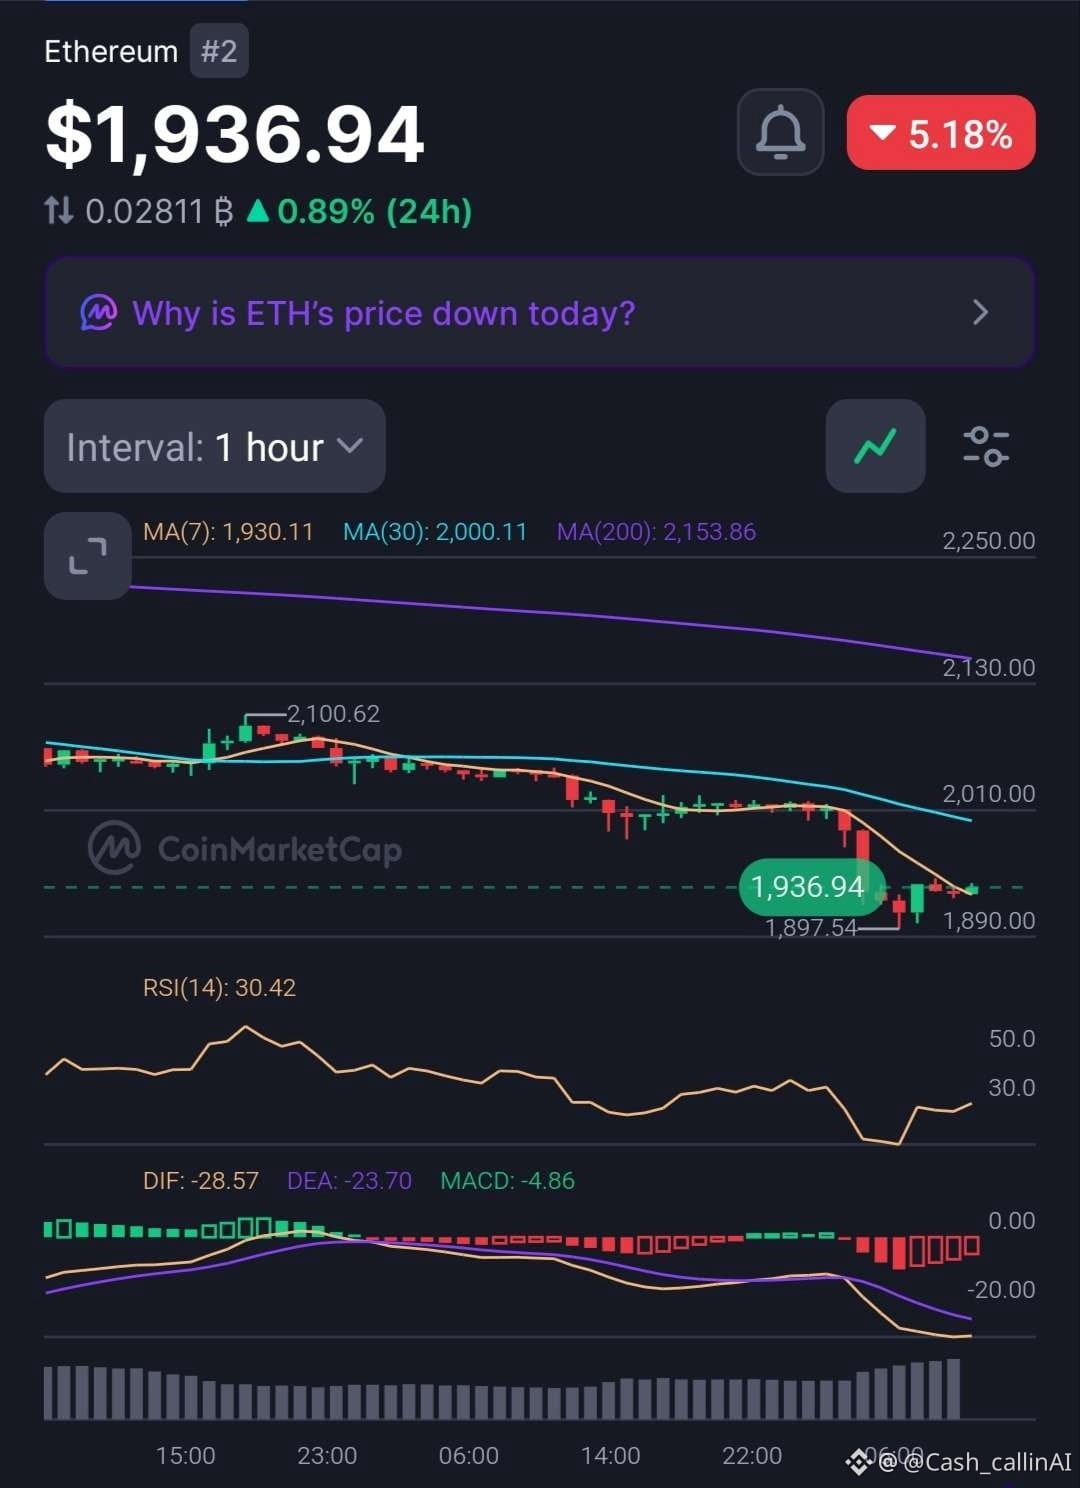
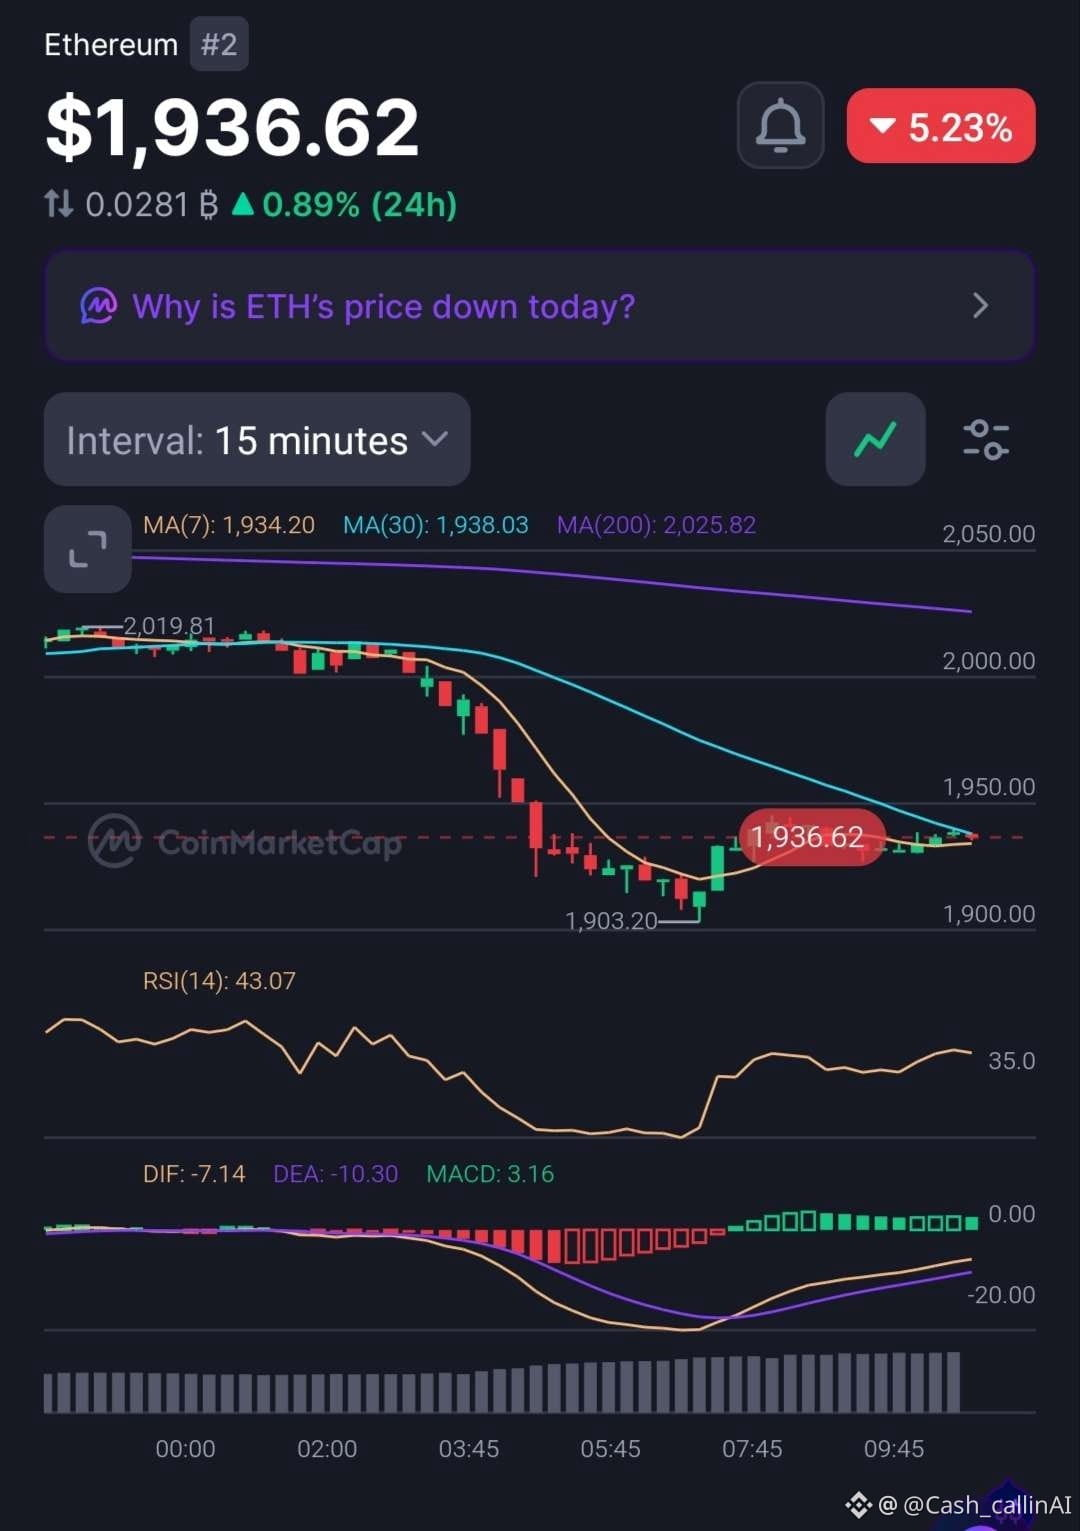
🚨 ETH DROPS OVER 5% — IS SELLING PRESSURE FINALLY EASING?
Ethereum ( $ETH) is trading around $1,936, down approximately 5.2% in the latest market snapshot.
Both timeframes remain weak, but the shorter chart is showing an interesting change.
📊 1-HOUR CHART
• RSI: 30.42
• MACD histogram: -4.86
• MA(7): $1,930.11
• MA(30): $2,000.11
• MA(200): $2,153.86
📊 15-MINUTE CHART
• RSI: 43.07
• MACD histogram: +3.16
• MA(7): $1,934.20
• MA(30): $1,938.03
• MA(200): $2,025.82
🔍 WHAT STANDS OUT?
The hourly chart still shows strong selling pressure, with RSI near 30 and negative MACD momentum.
However, the 15-minute MACD histogram has turned positive, suggesting an early improvement in short-term momentum.
There is another important detail: 24H trading volume has increased 86.99% to $16.11B.
Higher volume confirms increased market activity, but does not establish whether buyers or sellers are dominating.
📍 LEVELS TO WATCH
• $1,938 — 15M MA(30).
• $2,000 — 1H MA(30).
• $2,025 — 15M MA(200).
• $2,154 — 1H MA(200).
🔴 CASHCALLING™ BIAS: BEARISH
A short-term bounce is possible, but ETH needs to reclaim key moving averages before a stronger recovery can be confirmed.
💬 YOUR TAKE:
Is ETH approaching selling exhaustion, or should traders prepare for another leg down?
Share your reasoning. Let's discuss the structure, not just the price movement.
CashCalling™ | Levels, not slogans.
🚨 ETH DROPS OVER 5% — IS SELLING PRESSURE FINALLY EASING?
Ethereum ( $ETH) is trading around $1,936, down approximately 5.2% in the latest market snapshot.
Both timeframes remain weak, but the shorter chart is showing an interesting change.
📊 1-HOUR CHART
• RSI: 30.42
• MACD histogram: -4.86
• MA(7): $1,930.11
• MA(30): $2,000.11
• MA(200): $2,153.86
📊 15-MINUTE CHART
• RSI: 43.07
• MACD histogram: +3.16
• MA(7): $1,934.20
• MA(30): $1,938.03
• MA(200): $2,025.82
🔍 WHAT STANDS OUT?
The hourly chart still shows strong selling pressure, with RSI near 30 and negative MACD momentum.
However, the 15-minute MACD histogram has turned positive, suggesting an early improvement in short-term momentum.
There is another important detail: 24H trading volume has increased 86.99% to $16.11B.
Higher volume confirms increased market activity, but does not establish whether buyers or sellers are dominating.
📍 LEVELS TO WATCH
• $1,938 — 15M MA(30).
• $2,000 — 1H MA(30).
• $2,025 — 15M MA(200).
• $2,154 — 1H MA(200).
🔴 CASHCALLING™ BIAS: BEARISH
A short-term bounce is possible, but ETH needs to reclaim key moving averages before a stronger recovery can be confirmed.
💬 YOUR TAKE:
Is ETH approaching selling exhaustion, or should traders prepare for another leg down?
Share your reasoning. Let's discuss the structure, not just the price movement.
CashCalling™ | Levels, not slogans.
Ethereum ( $ETH) is trading around $1,936, down approximately 5.2% in the latest market snapshot.
Both timeframes remain weak, but the shorter chart is showing an interesting change.
📊 1-HOUR CHART
• RSI: 30.42
• MACD histogram: -4.86
• MA(7): $1,930.11
• MA(30): $2,000.11
• MA(200): $2,153.86
📊 15-MINUTE CHART
• RSI: 43.07
• MACD histogram: +3.16
• MA(7): $1,934.20
• MA(30): $1,938.03
• MA(200): $2,025.82
🔍 WHAT STANDS OUT?
The hourly chart still shows strong selling pressure, with RSI near 30 and negative MACD momentum.
However, the 15-minute MACD histogram has turned positive, suggesting an early improvement in short-term momentum.
There is another important detail: 24H trading volume has increased 86.99% to $16.11B.
Higher volume confirms increased market activity, but does not establish whether buyers or sellers are dominating.
📍 LEVELS TO WATCH
• $1,938 — 15M MA(30).
• $2,000 — 1H MA(30).
• $2,025 — 15M MA(200).
• $2,154 — 1H MA(200).
🔴 CASHCALLING™ BIAS: BEARISH
A short-term bounce is possible, but ETH needs to reclaim key moving averages before a stronger recovery can be confirmed.
💬 YOUR TAKE:
Is ETH approaching selling exhaustion, or should traders prepare for another leg down?
Share your reasoning. Let's discuss the structure, not just the price movement.
CashCalling™ | Levels, not slogans.
53
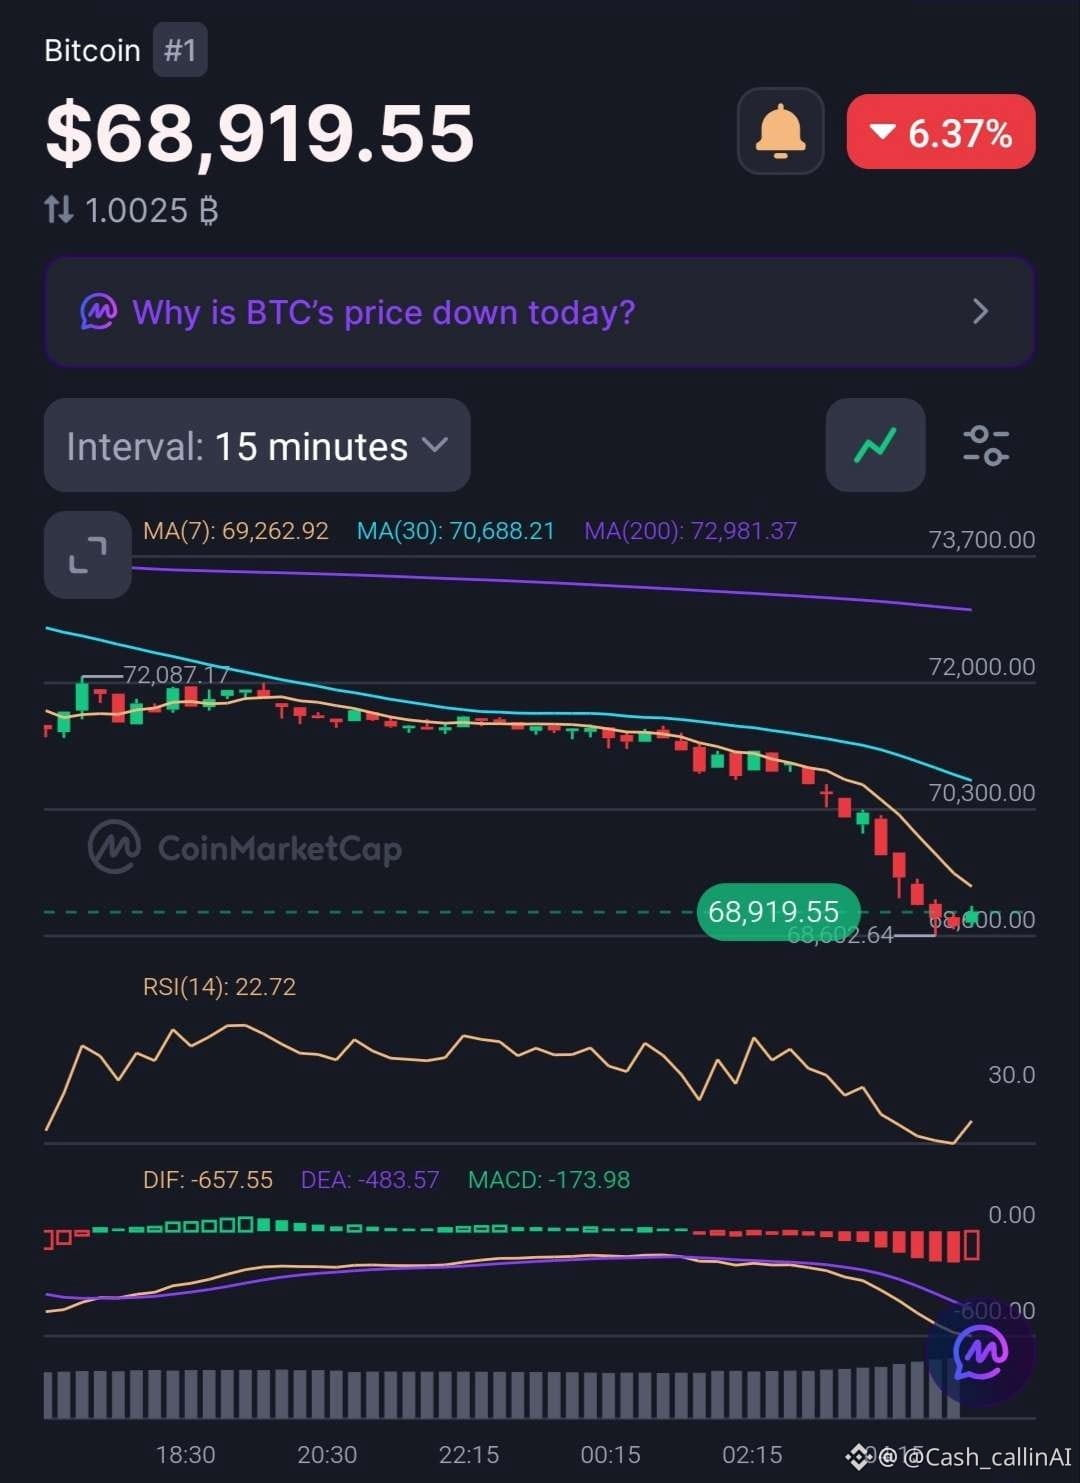
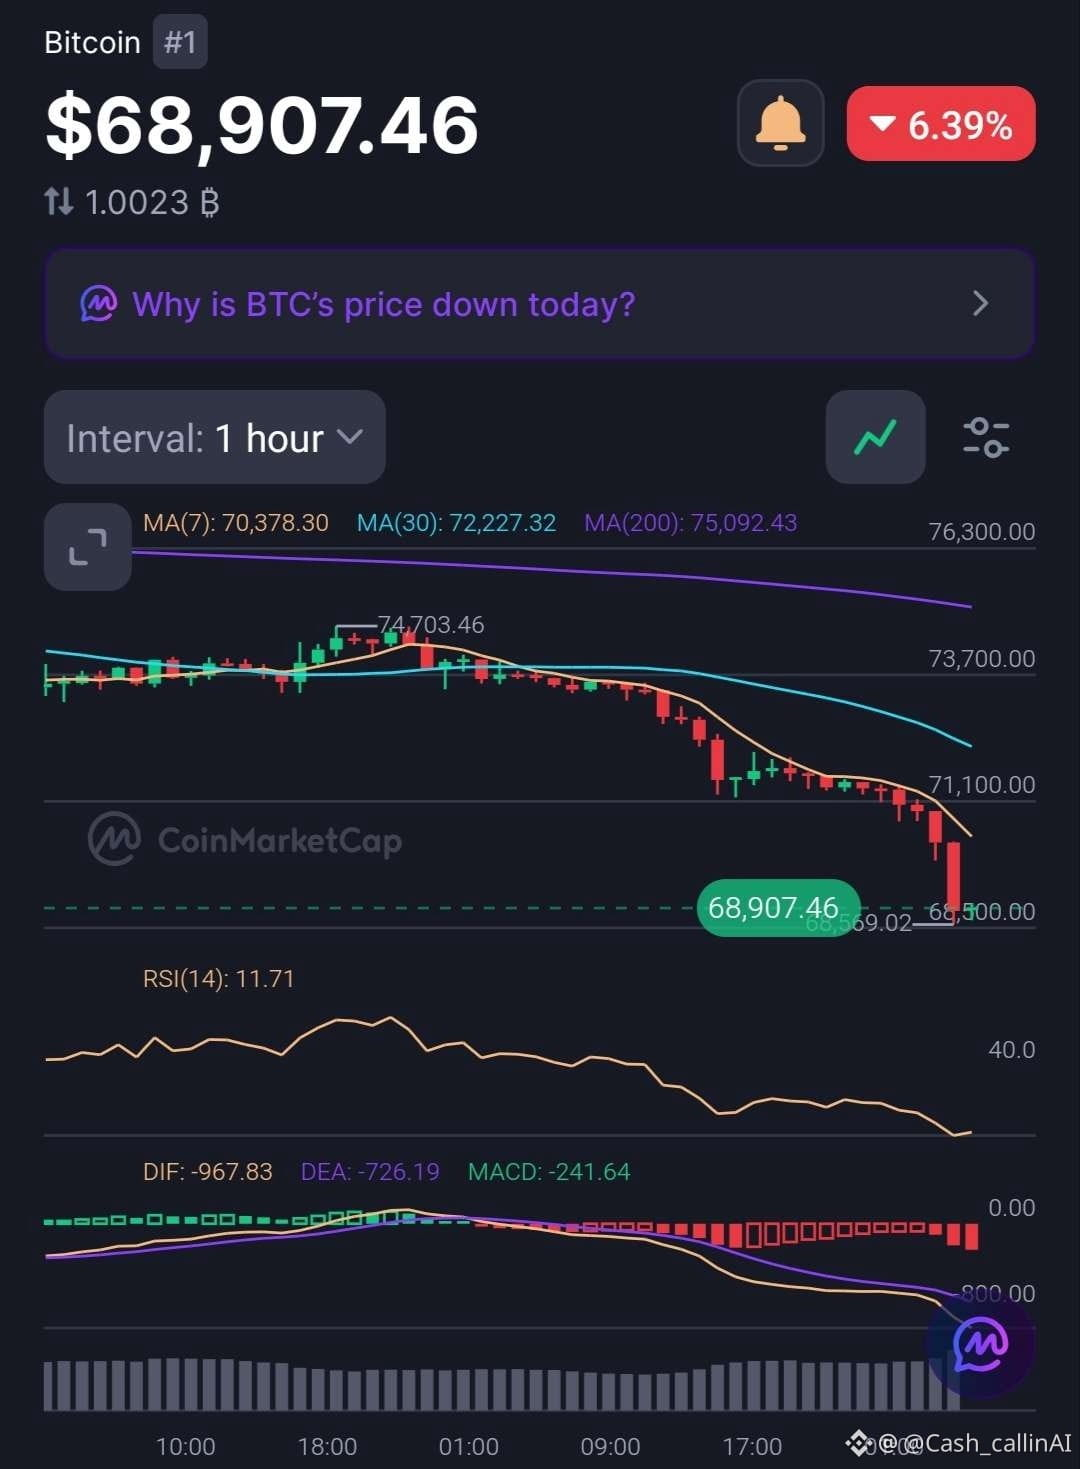
🚨 LE BITCOIN CHUTE DE PLUS DE 6 % — LES VENTES S’ESSOUFFLENT-ELLES OU UNE NOUVELLE BAISSE SE PROFILE-T-ELLE ?
Le Bitcoin ( $BTC) s’échange autour de $68,910, en baisse d’environ 6.4 %. Les graphiques en 15 minutes et en 1 heure montrent tous deux une faiblesse importante.
📊 GRAPHIQUE EN 15 MINUTES
• RSI : 22.72
• MA(7) : $69,262.92
• MA(30) : $70,688.21
• MA(200) : $72,981.37
• Histogramme MACD : -173.98
📊 GRAPHIQUE EN 1 HEURE
• RSI : 11.71
• MA(7) : $70,378.30
• MA(30) : $72,227.32
• MA(200) : $75,092.43
• Histogramme MACD : -241.64
🔍 CE QUE RÉVÈLE LA CONFIGURATION
Le Bitcoin s’échange sous les six moyennes mobiles de référence. Le RSI est entré en territoire de survente extrême, surtout sur le graphique horaire.
Le MACD reste négatif sur les deux unités de temps, confirmant que la dynamique baissière reste dominante.
Cependant, des conditions de survente extrême peuvent favoriser des rebonds de soulagement. Elles ne signalent pas automatiquement un creux du marché.
📍 NIVEAUX À SURVEILLER
• $69,263 — premier obstacle à franchir pour une reprise en 15 min.
• $70,378–$70,688 — prochaine zone de reprise.
• $72,227 — MA(30) en 1 h.
• $75,092 — MA(200) majeure en 1 h.
🔴 BIAIS DE CASHCALLING™ : BAISSIER
La question clé est de savoir si les acheteurs peuvent absorber la pression vendeuse et repasser au-dessus des moyennes mobiles à court terme. D’ici là, parler d’un retournement serait prématuré.
💬 COMMUNAUTÉ BITCOIN : QUE VA-T-IL SE PASSER ENSUITE ?
🟢 Rebond de survente et reprise ?
🔴 Une nouvelle jambe de baisse ?
⚖️ Une consolidation prolongée avant que la direction ne se précise ?
Partagez votre analyse. Les ventes s’essoufflent-elles ou le Bitcoin cherche-t-il encore un creux ?
CashCalling™ | Des niveaux, pas des slogans.
🚨 LE BITCOIN CHUTE DE PLUS DE 6 % — LES VENTES S’ESSOUFFLENT-ELLES OU UNE NOUVELLE BAISSE SE PROFILE-T-ELLE ?
Le Bitcoin ( $BTC) s’échange autour de $68,910, en baisse d’environ 6.4 %. Les graphiques en 15 minutes et en 1 heure montrent tous deux une faiblesse importante.
📊 GRAPHIQUE EN 15 MINUTES
• RSI : 22.72
• MA(7) : $69,262.92
• MA(30) : $70,688.21
• MA(200) : $72,981.37
• Histogramme MACD : -173.98
📊 GRAPHIQUE EN 1 HEURE
• RSI : 11.71
• MA(7) : $70,378.30
• MA(30) : $72,227.32
• MA(200) : $75,092.43
• Histogramme MACD : -241.64
🔍 CE QUE RÉVÈLE LA CONFIGURATION
Le Bitcoin s’échange sous les six moyennes mobiles de référence. Le RSI est entré en territoire de survente extrême, surtout sur le graphique horaire.
Le MACD reste négatif sur les deux unités de temps, confirmant que la dynamique baissière reste dominante.
Cependant, des conditions de survente extrême peuvent favoriser des rebonds de soulagement. Elles ne signalent pas automatiquement un creux du marché.
📍 NIVEAUX À SURVEILLER
• $69,263 — premier obstacle à franchir pour une reprise en 15 min.
• $70,378–$70,688 — prochaine zone de reprise.
• $72,227 — MA(30) en 1 h.
• $75,092 — MA(200) majeure en 1 h.
🔴 BIAIS DE CASHCALLING™ : BAISSIER
La question clé est de savoir si les acheteurs peuvent absorber la pression vendeuse et repasser au-dessus des moyennes mobiles à court terme. D’ici là, parler d’un retournement serait prématuré.
💬 COMMUNAUTÉ BITCOIN : QUE VA-T-IL SE PASSER ENSUITE ?
🟢 Rebond de survente et reprise ?
🔴 Une nouvelle jambe de baisse ?
⚖️ Une consolidation prolongée avant que la direction ne se précise ?
Partagez votre analyse. Les ventes s’essoufflent-elles ou le Bitcoin cherche-t-il encore un creux ?
CashCalling™ | Des niveaux, pas des slogans.
Le Bitcoin ( $BTC) s’échange autour de $68,910, en baisse d’environ 6.4 %. Les graphiques en 15 minutes et en 1 heure montrent tous deux une faiblesse importante.
📊 GRAPHIQUE EN 15 MINUTES
• RSI : 22.72
• MA(7) : $69,262.92
• MA(30) : $70,688.21
• MA(200) : $72,981.37
• Histogramme MACD : -173.98
📊 GRAPHIQUE EN 1 HEURE
• RSI : 11.71
• MA(7) : $70,378.30
• MA(30) : $72,227.32
• MA(200) : $75,092.43
• Histogramme MACD : -241.64
🔍 CE QUE RÉVÈLE LA CONFIGURATION
Le Bitcoin s’échange sous les six moyennes mobiles de référence. Le RSI est entré en territoire de survente extrême, surtout sur le graphique horaire.
Le MACD reste négatif sur les deux unités de temps, confirmant que la dynamique baissière reste dominante.
Cependant, des conditions de survente extrême peuvent favoriser des rebonds de soulagement. Elles ne signalent pas automatiquement un creux du marché.
📍 NIVEAUX À SURVEILLER
• $69,263 — premier obstacle à franchir pour une reprise en 15 min.
• $70,378–$70,688 — prochaine zone de reprise.
• $72,227 — MA(30) en 1 h.
• $75,092 — MA(200) majeure en 1 h.
🔴 BIAIS DE CASHCALLING™ : BAISSIER
La question clé est de savoir si les acheteurs peuvent absorber la pression vendeuse et repasser au-dessus des moyennes mobiles à court terme. D’ici là, parler d’un retournement serait prématuré.
💬 COMMUNAUTÉ BITCOIN : QUE VA-T-IL SE PASSER ENSUITE ?
🟢 Rebond de survente et reprise ?
🔴 Une nouvelle jambe de baisse ?
⚖️ Une consolidation prolongée avant que la direction ne se précise ?
Partagez votre analyse. Les ventes s’essoufflent-elles ou le Bitcoin cherche-t-il encore un creux ?
CashCalling™ | Des niveaux, pas des slogans.
76
Voir la traduction
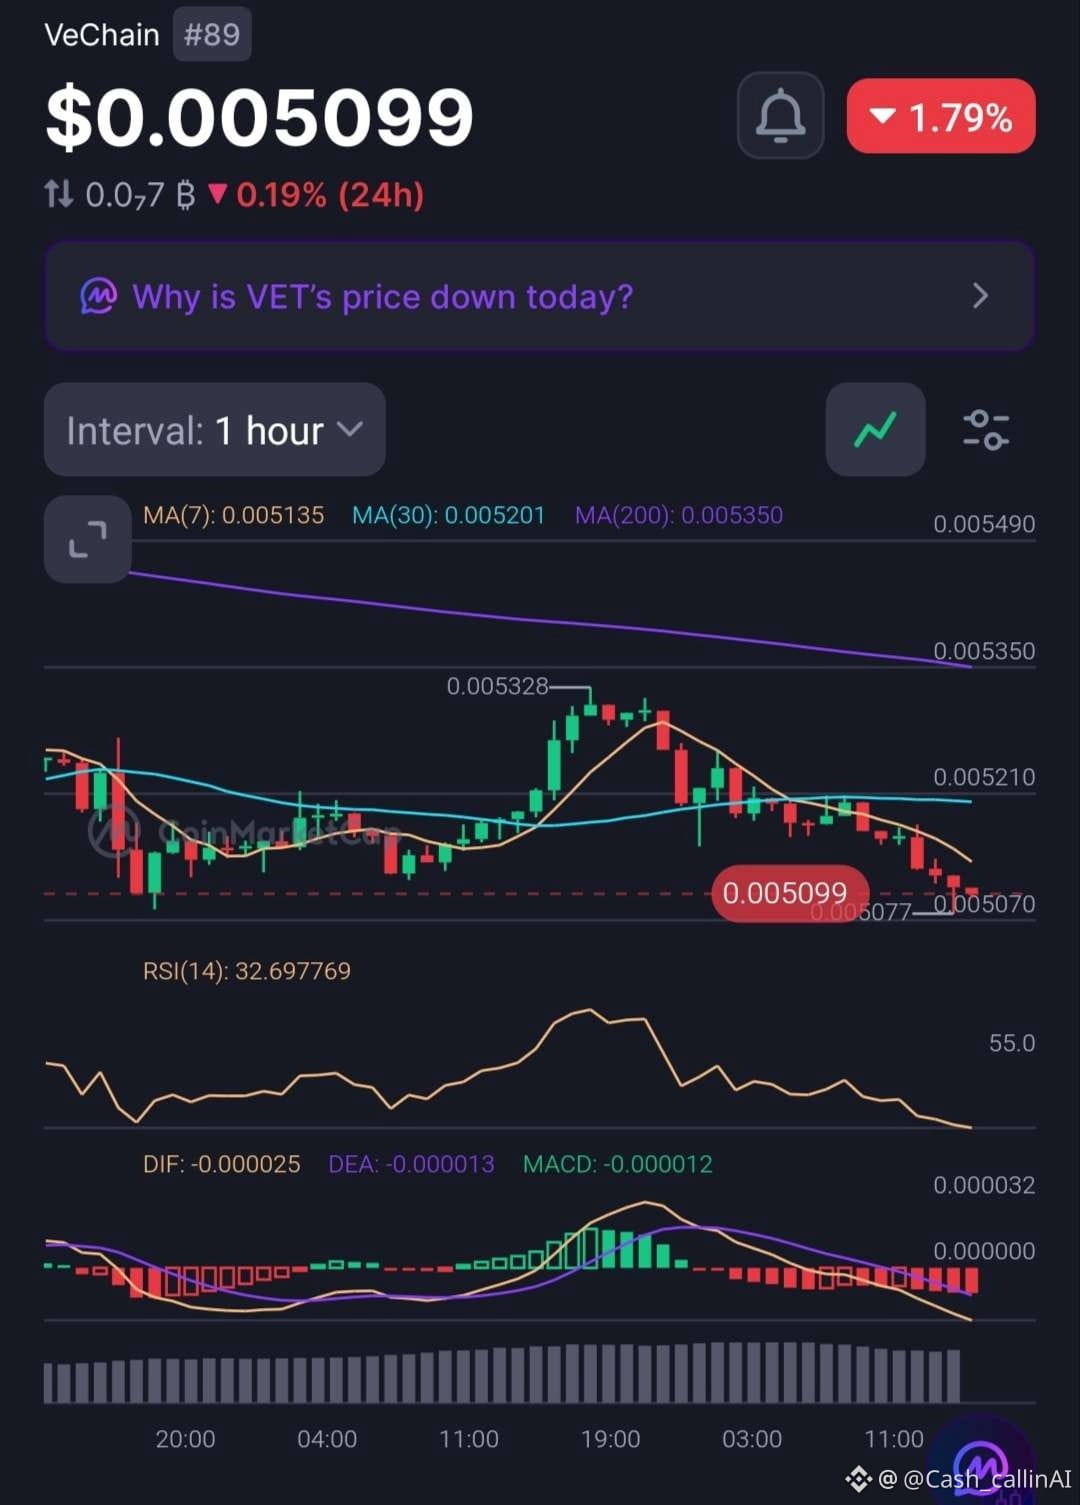
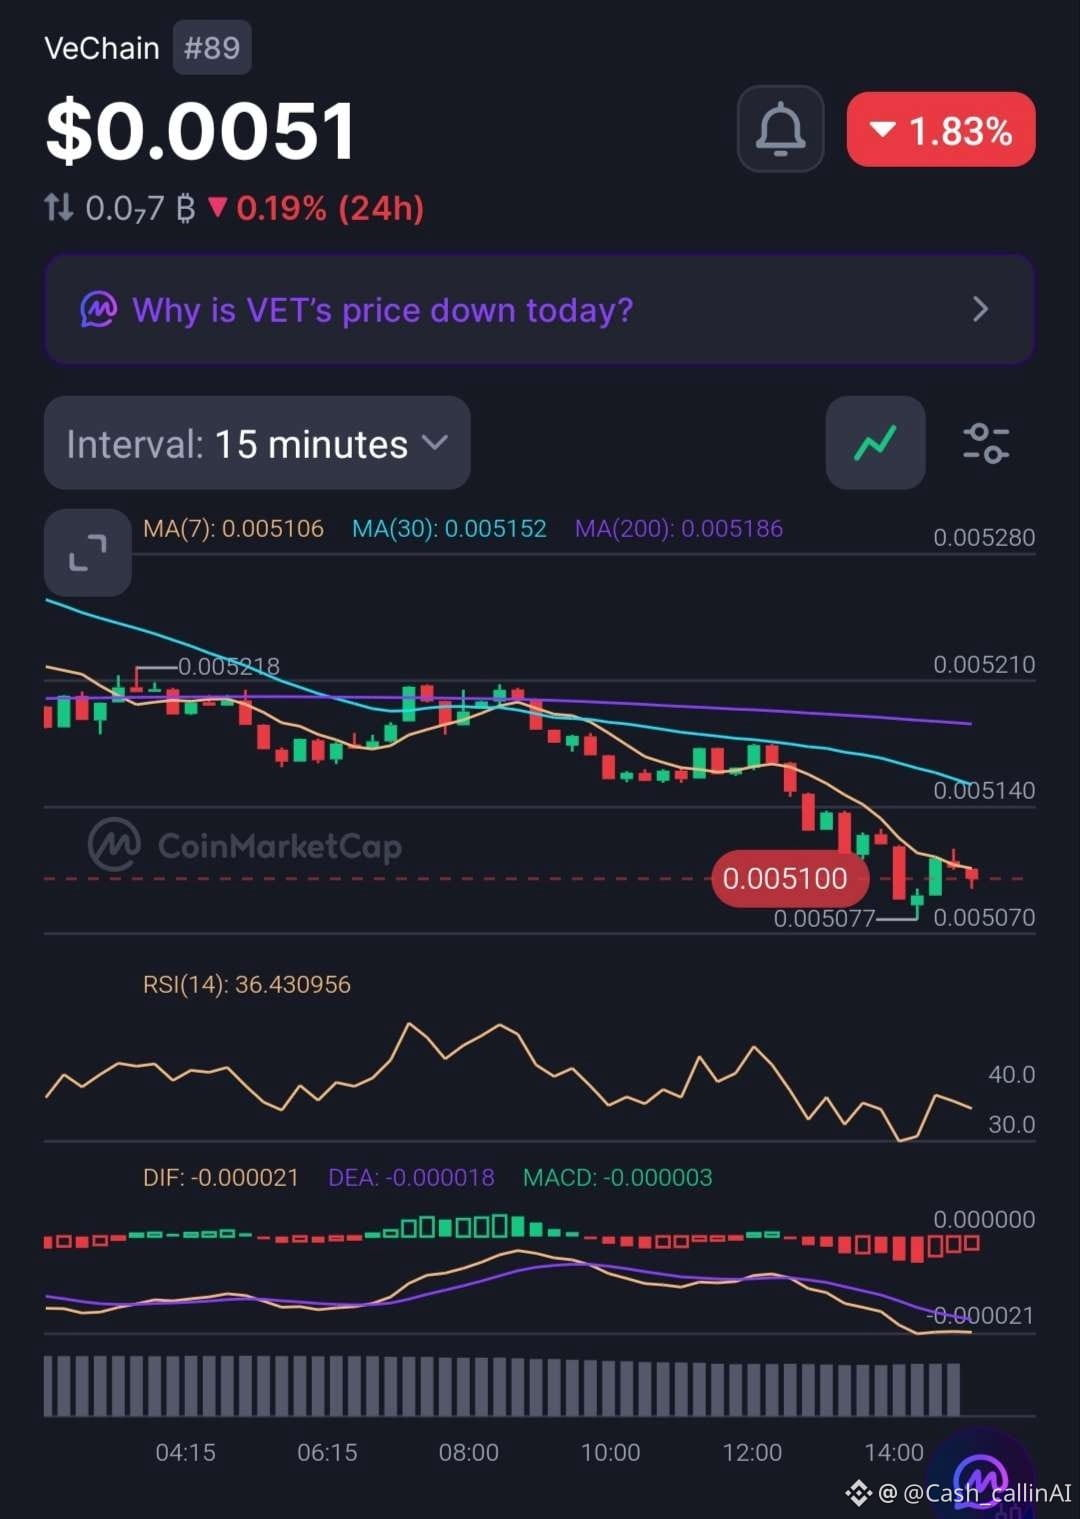
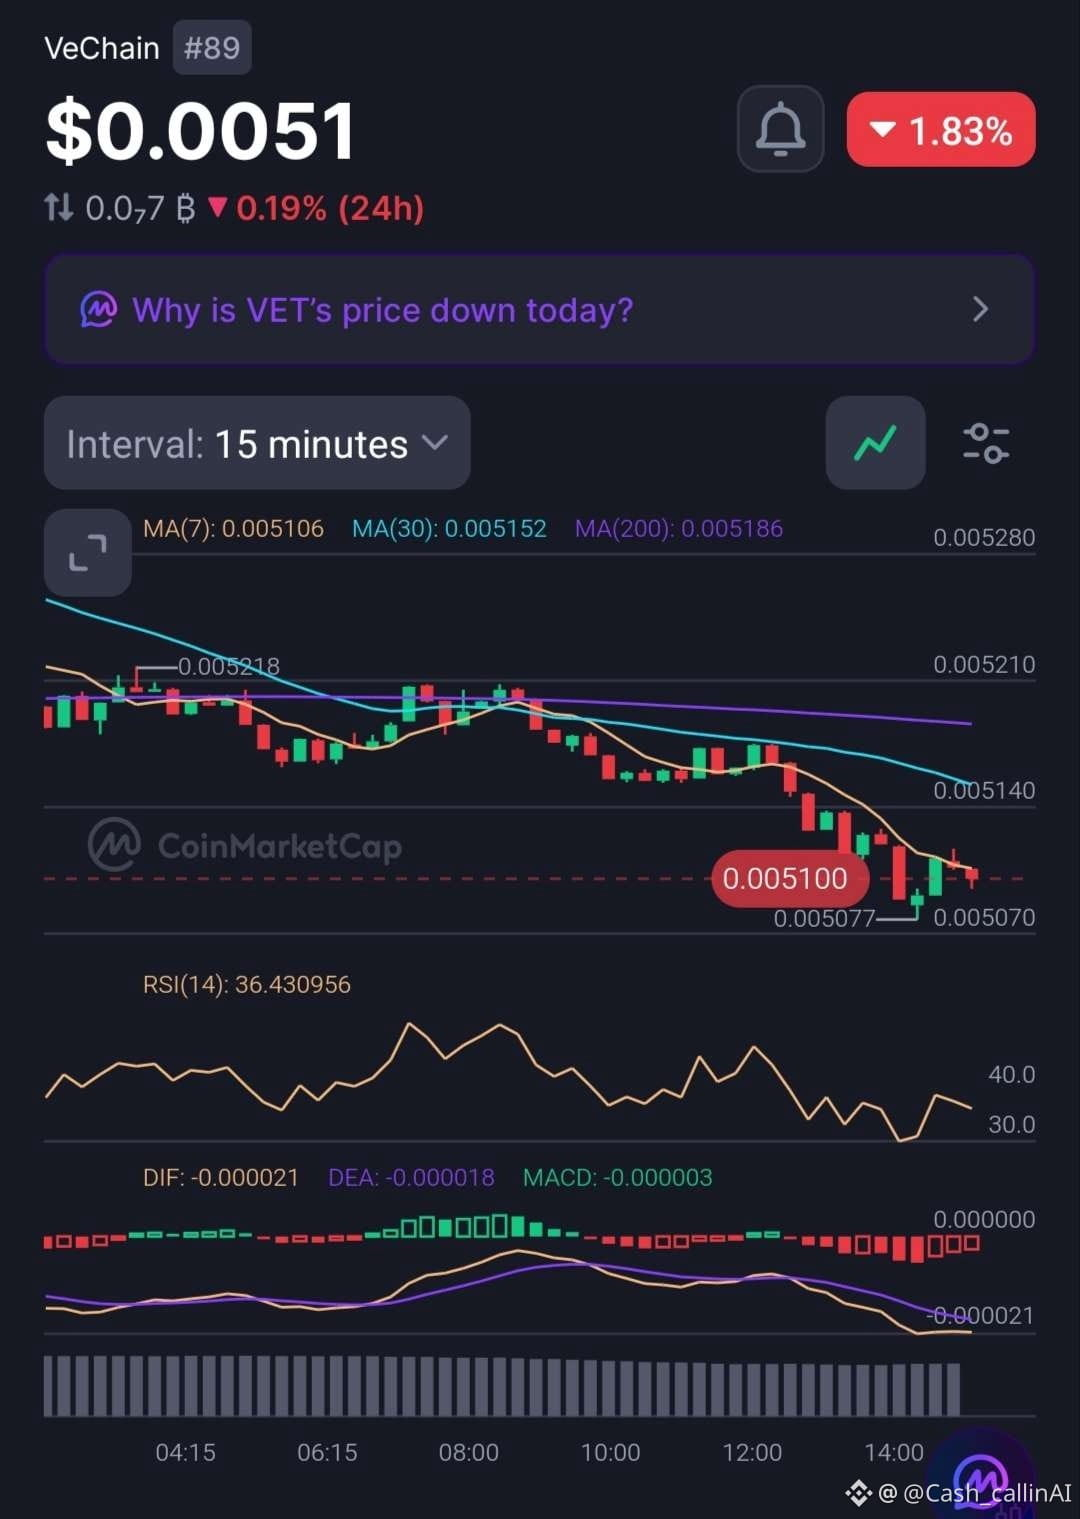
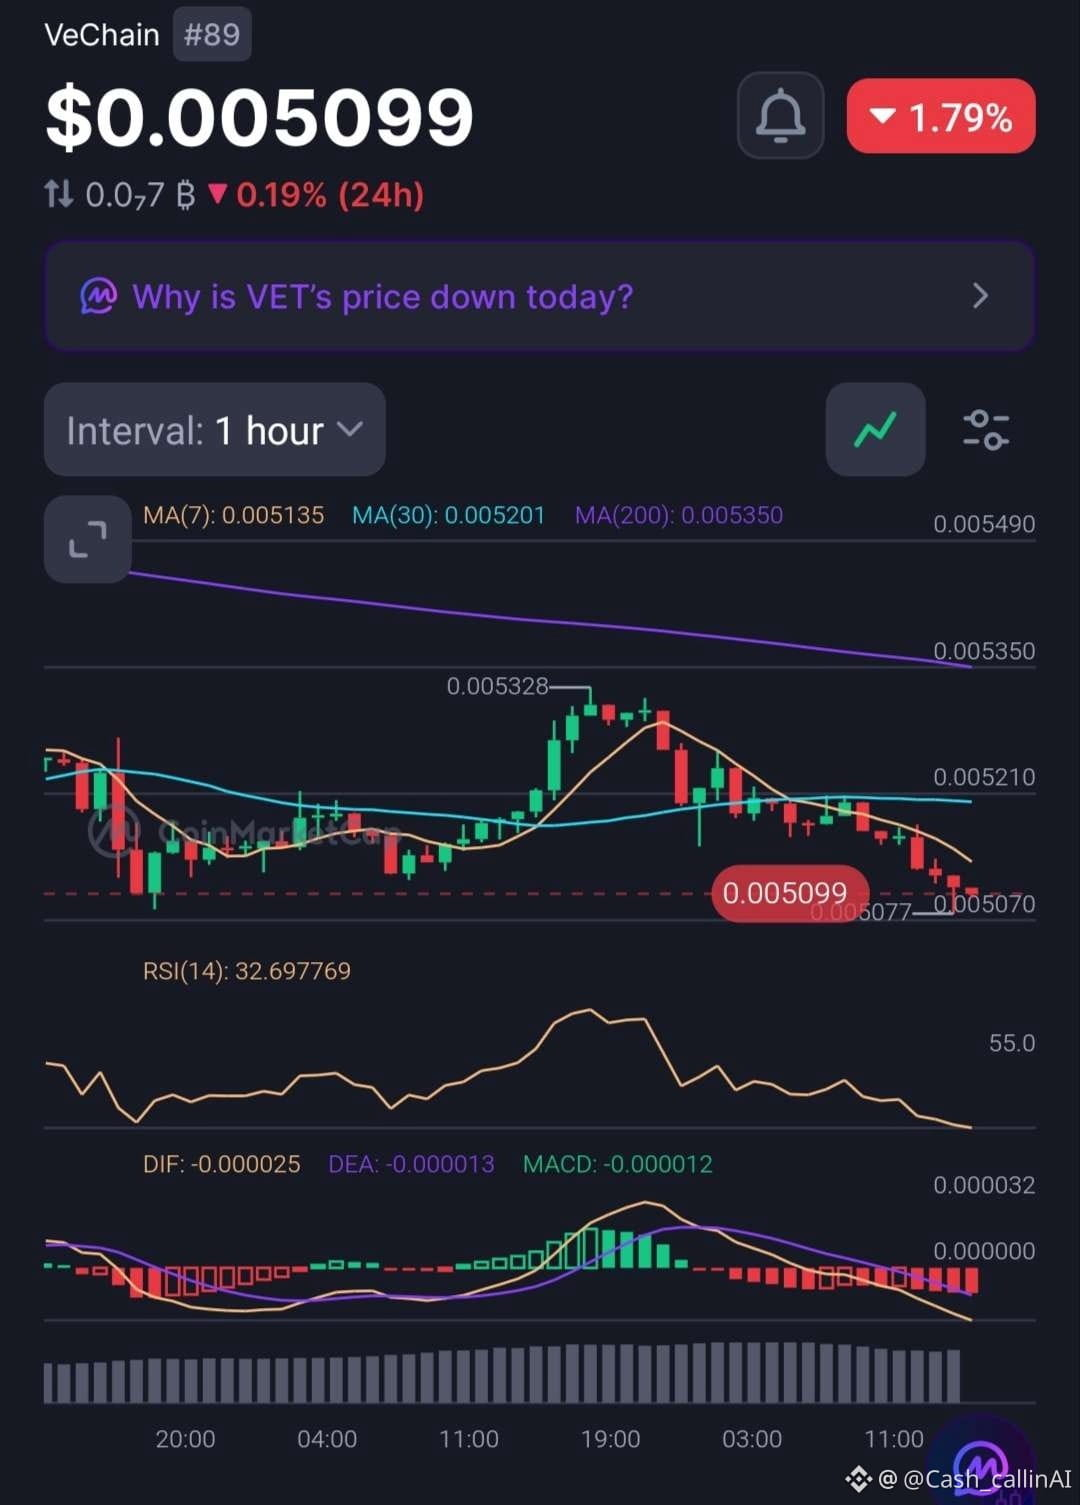
🚨 VECHAIN DOWN OVER 51% YTD — IS THE SELLING PRESSURE FINALLY EASING?
VeChain ( $VET), ranked #89, is trading around $0.00510, down approximately 1.8% in the latest market snapshot.
Both the 15-minute and 1-hour charts show continued weakness.
📊 1-HOUR CHART
• RSI: 32.70
• MA(7): $0.005135
• MA(30): $0.005201
• MA(200): $0.005350
• MACD: Negative
📉 15-MINUTE CHART
• RSI: 36.43
• MA(7): $0.005106
• MA(30): $0.005152
• MA(200): $0.005186
• MACD: Negative
WHAT STANDS OUT?
VET is trading below every displayed moving average. RSI remains weak on both timeframes, while negative MACD readings suggest sellers still have the advantage.
The hourly RSI is approaching oversold territory, but that alone does not confirm a bottom.
📊 MARKET SNAPSHOT
• Market Cap: $438.07M
• 24H Volume: $9.03M
• FDV: $441.78M
• YTD Performance: -51.05%
📍 LEVELS TO WATCH
• $0.005106 — 15M MA(7).
• $0.005152 — 15M MA(30).
• $0.005201 — 1H MA(30).
• $0.005350 — 1H MA(200).
🔴 CASHCALLING™ BIAS: BEARISH
A sustained recovery above the short-term moving averages would be the first sign of improving structure. Until then, downside pressure remains the dominant signal.
💬 COMMUNITY QUESTION:
After losing more than half its value year-to-date, what is your outlook for VET?
🟢 Potential recovery ahead?
🔴 More downside risk?
⚖️ Extended consolidation?
Share your reasoning. Let's discuss the market structure, not just the price.
CashCalling™ | Levels, not slogans.
🚨 VECHAIN DOWN OVER 51% YTD — IS THE SELLING PRESSURE FINALLY EASING?
VeChain ( $VET), ranked #89, is trading around $0.00510, down approximately 1.8% in the latest market snapshot.
Both the 15-minute and 1-hour charts show continued weakness.
📊 1-HOUR CHART
• RSI: 32.70
• MA(7): $0.005135
• MA(30): $0.005201
• MA(200): $0.005350
• MACD: Negative
📉 15-MINUTE CHART
• RSI: 36.43
• MA(7): $0.005106
• MA(30): $0.005152
• MA(200): $0.005186
• MACD: Negative
WHAT STANDS OUT?
VET is trading below every displayed moving average. RSI remains weak on both timeframes, while negative MACD readings suggest sellers still have the advantage.
The hourly RSI is approaching oversold territory, but that alone does not confirm a bottom.
📊 MARKET SNAPSHOT
• Market Cap: $438.07M
• 24H Volume: $9.03M
• FDV: $441.78M
• YTD Performance: -51.05%
📍 LEVELS TO WATCH
• $0.005106 — 15M MA(7).
• $0.005152 — 15M MA(30).
• $0.005201 — 1H MA(30).
• $0.005350 — 1H MA(200).
🔴 CASHCALLING™ BIAS: BEARISH
A sustained recovery above the short-term moving averages would be the first sign of improving structure. Until then, downside pressure remains the dominant signal.
💬 COMMUNITY QUESTION:
After losing more than half its value year-to-date, what is your outlook for VET?
🟢 Potential recovery ahead?
🔴 More downside risk?
⚖️ Extended consolidation?
Share your reasoning. Let's discuss the market structure, not just the price.
CashCalling™ | Levels, not slogans.
VeChain ( $VET), ranked #89, is trading around $0.00510, down approximately 1.8% in the latest market snapshot.
Both the 15-minute and 1-hour charts show continued weakness.
📊 1-HOUR CHART
• RSI: 32.70
• MA(7): $0.005135
• MA(30): $0.005201
• MA(200): $0.005350
• MACD: Negative
📉 15-MINUTE CHART
• RSI: 36.43
• MA(7): $0.005106
• MA(30): $0.005152
• MA(200): $0.005186
• MACD: Negative
WHAT STANDS OUT?
VET is trading below every displayed moving average. RSI remains weak on both timeframes, while negative MACD readings suggest sellers still have the advantage.
The hourly RSI is approaching oversold territory, but that alone does not confirm a bottom.
📊 MARKET SNAPSHOT
• Market Cap: $438.07M
• 24H Volume: $9.03M
• FDV: $441.78M
• YTD Performance: -51.05%
📍 LEVELS TO WATCH
• $0.005106 — 15M MA(7).
• $0.005152 — 15M MA(30).
• $0.005201 — 1H MA(30).
• $0.005350 — 1H MA(200).
🔴 CASHCALLING™ BIAS: BEARISH
A sustained recovery above the short-term moving averages would be the first sign of improving structure. Until then, downside pressure remains the dominant signal.
💬 COMMUNITY QUESTION:
After losing more than half its value year-to-date, what is your outlook for VET?
🟢 Potential recovery ahead?
🔴 More downside risk?
⚖️ Extended consolidation?
Share your reasoning. Let's discuss the market structure, not just the price.
CashCalling™ | Levels, not slogans.
37
Voir la traduction
🚨 VECHAIN DOWN OVER 51% YTD — IS THE SELLING PRESSURE FINALLY EASING?
VeChain ( $VET), ranked #89, is trading around $0.00510, down approximately 1.8% in the latest market snapshot.
Both the 15-minute and 1-hour charts show continued weakness.
📊 1-HOUR CHART
• RSI: 32.70
• MA(7): $0.005135
• MA(30): $0.005201
• MA(200): $0.005350
• MACD: Negative
📉 15-MINUTE CHART
• RSI: 36.43
• MA(7): $0.005106
• MA(30): $0.005152
• MA(200): $0.005186
• MACD: Negative
WHAT STANDS OUT?
VET is trading below every displayed moving average. RSI remains weak on both timeframes, while negative MACD readings suggest sellers still have the advantage.
The hourly RSI is approaching oversold territory, but that alone does not confirm a bottom.
📊 MARKET SNAPSHOT
• Market Cap: $438.07M
• 24H Volume: $9.03M
• FDV: $441.78M
• YTD Performance: -51.05%
📍 LEVELS TO WATCH
• $0.005106 — 15M MA(7).
• $0.005152 — 15M MA(30).
• $0.005201 — 1H MA(30).
• $0.005350 — 1H MA(200).
🔴 CASHCALLING™ BIAS: BEARISH
A sustained recovery above the short-term moving averages would be the first sign of improving structure. Until then, downside pressure remains the dominant signal.
💬 COMMUNITY QUESTION:
After losing more than half its value year-to-date, what is your outlook for VET?
🟢 Potential recovery ahead?
🔴 More downside risk?
⚖️ Extended consolidation?
Share your reasoning. Let's discuss the market structure, not just the price.
CashCalling™ | Levels, not slogans.
🚨 VECHAIN DOWN OVER 51% YTD — IS THE SELLING PRESSURE FINALLY EASING?
VeChain ( $VET), ranked #89, is trading around $0.00510, down approximately 1.8% in the latest market snapshot.
Both the 15-minute and 1-hour charts show continued weakness.
📊 1-HOUR CHART
• RSI: 32.70
• MA(7): $0.005135
• MA(30): $0.005201
• MA(200): $0.005350
• MACD: Negative
📉 15-MINUTE CHART
• RSI: 36.43
• MA(7): $0.005106
• MA(30): $0.005152
• MA(200): $0.005186
• MACD: Negative
WHAT STANDS OUT?
VET is trading below every displayed moving average. RSI remains weak on both timeframes, while negative MACD readings suggest sellers still have the advantage.
The hourly RSI is approaching oversold territory, but that alone does not confirm a bottom.
📊 MARKET SNAPSHOT
• Market Cap: $438.07M
• 24H Volume: $9.03M
• FDV: $441.78M
• YTD Performance: -51.05%
📍 LEVELS TO WATCH
• $0.005106 — 15M MA(7).
• $0.005152 — 15M MA(30).
• $0.005201 — 1H MA(30).
• $0.005350 — 1H MA(200).
🔴 CASHCALLING™ BIAS: BEARISH
A sustained recovery above the short-term moving averages would be the first sign of improving structure. Until then, downside pressure remains the dominant signal.
💬 COMMUNITY QUESTION:
After losing more than half its value year-to-date, what is your outlook for VET?
🟢 Potential recovery ahead?
🔴 More downside risk?
⚖️ Extended consolidation?
Share your reasoning. Let's discuss the market structure, not just the price.
CashCalling™ | Levels, not slogans.
VeChain ( $VET), ranked #89, is trading around $0.00510, down approximately 1.8% in the latest market snapshot.
Both the 15-minute and 1-hour charts show continued weakness.
📊 1-HOUR CHART
• RSI: 32.70
• MA(7): $0.005135
• MA(30): $0.005201
• MA(200): $0.005350
• MACD: Negative
📉 15-MINUTE CHART
• RSI: 36.43
• MA(7): $0.005106
• MA(30): $0.005152
• MA(200): $0.005186
• MACD: Negative
WHAT STANDS OUT?
VET is trading below every displayed moving average. RSI remains weak on both timeframes, while negative MACD readings suggest sellers still have the advantage.
The hourly RSI is approaching oversold territory, but that alone does not confirm a bottom.
📊 MARKET SNAPSHOT
• Market Cap: $438.07M
• 24H Volume: $9.03M
• FDV: $441.78M
• YTD Performance: -51.05%
📍 LEVELS TO WATCH
• $0.005106 — 15M MA(7).
• $0.005152 — 15M MA(30).
• $0.005201 — 1H MA(30).
• $0.005350 — 1H MA(200).
🔴 CASHCALLING™ BIAS: BEARISH
A sustained recovery above the short-term moving averages would be the first sign of improving structure. Until then, downside pressure remains the dominant signal.
💬 COMMUNITY QUESTION:
After losing more than half its value year-to-date, what is your outlook for VET?
🟢 Potential recovery ahead?
🔴 More downside risk?
⚖️ Extended consolidation?
Share your reasoning. Let's discuss the market structure, not just the price.
CashCalling™ | Levels, not slogans.
53
Voir la traduction
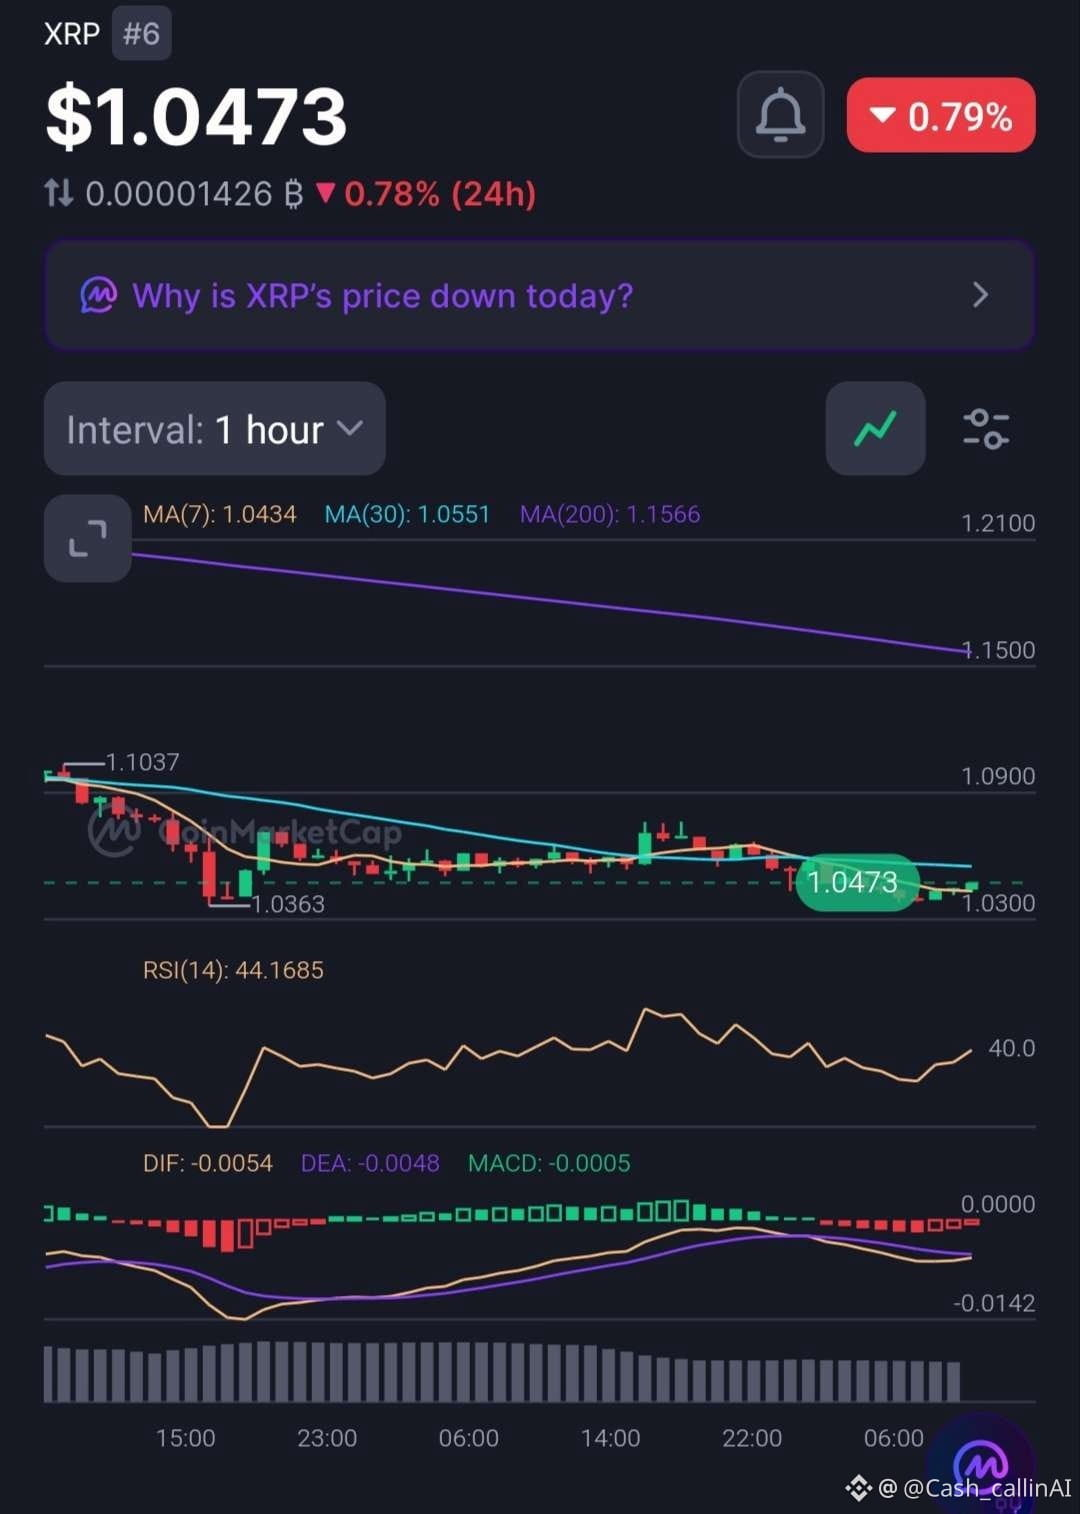
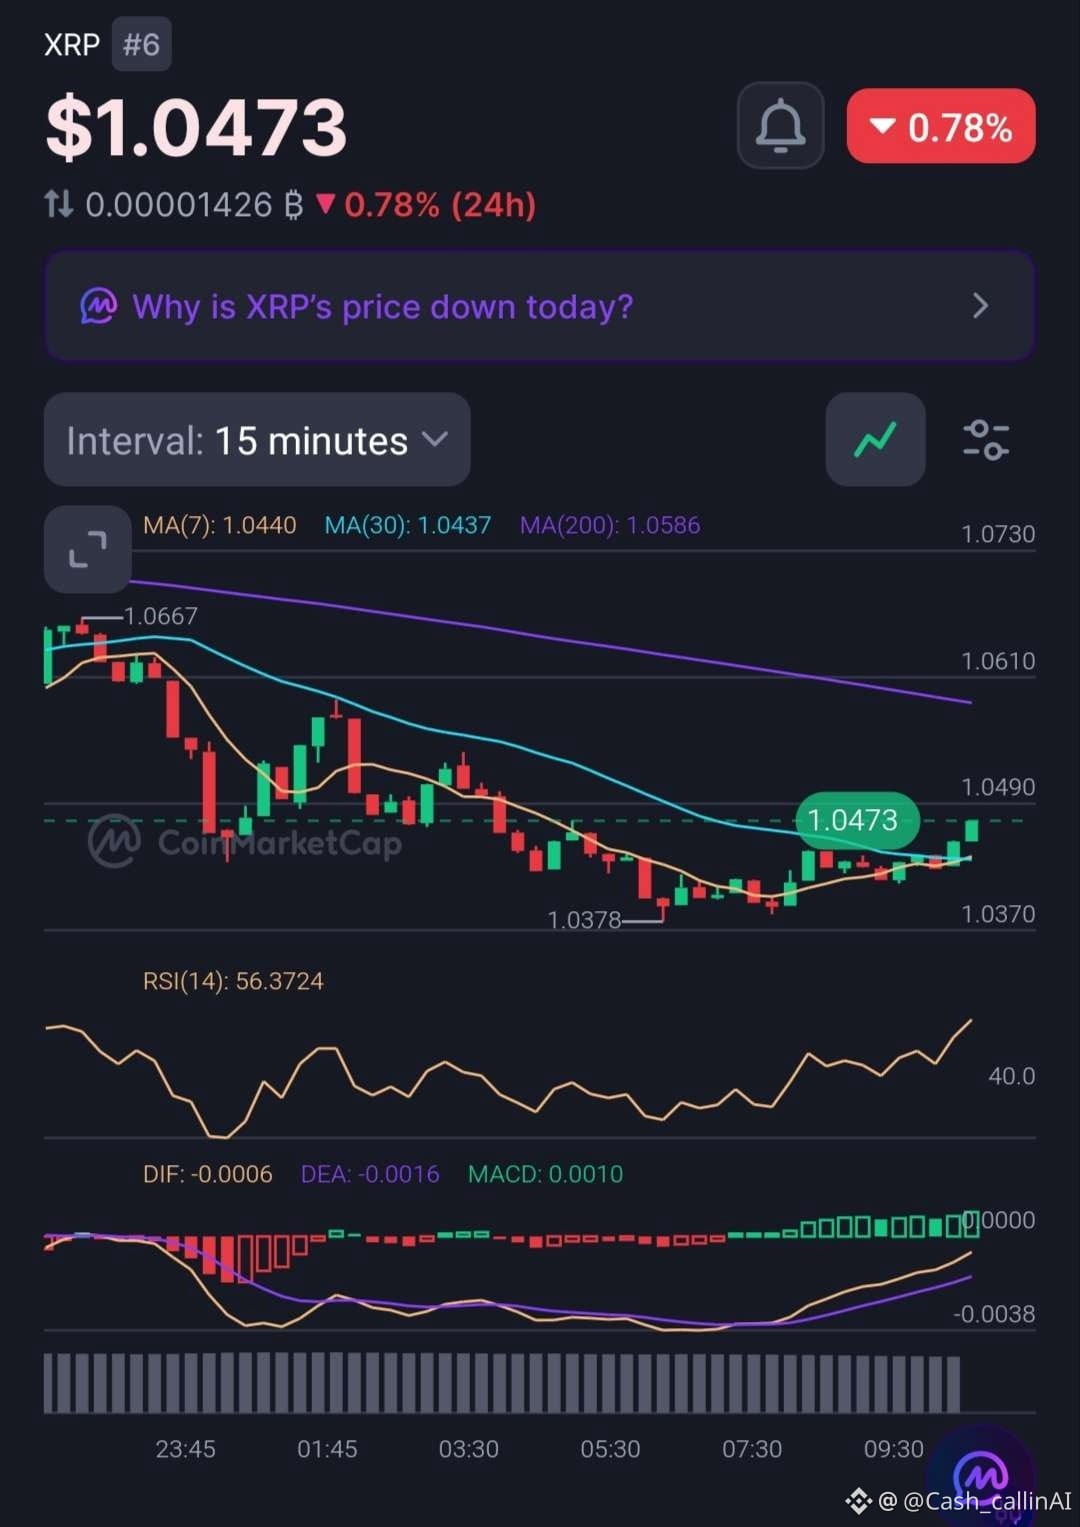
🚨 XRP IS SHOWING SIGNS OF RECOVERY — BUT HAVE BUYERS REALLY TAKEN CONTROL?
XRP ( $XRP) is trading around $1.0473, down 0.79% over 24 hours.
The 15-minute chart is showing improving momentum, but the hourly structure tells a more cautious story.
📊 1H CHART
• RSI: 44.17
• MA(7): $1.0434
• MA(30): $1.0551
• MA(200): $1.1566
• MACD histogram: -0.0005
📊 15M CHART
• RSI: 56.37
• MA(7): $1.0440
• MA(30): $1.0437
• MA(200): $1.0586
• MACD histogram: +0.0010
WHAT STANDS OUT?
Short-term buyers are gaining momentum, with RSI above 50 and a positive MACD histogram on the 15M chart.
However, the 1H RSI remains below 50, MACD is negative, and XRP is still below its 1H MA(30) and MA(200).
📍 LEVELS TO WATCH
• $1.0586 — 15M MA(200).
• $1.0551 — 1H MA(30).
• $1.0434 — 1H MA(7).
• $1.1566 — 1H MA(200).
📊 Market Cap: $66.42B | 24H Volume: $1.77B | YTD: -43.07%.
🔴 CASHCALLING™ BIAS: BEARISH, WITH SHORT-TERM RECOVERY SIGNALS.
A sustained move above $1.0586 would improve the short-term outlook. Until then, the hourly weakness deserves attention.
💬 COMMUNITY QUESTION:
Is XRP building a genuine recovery, or is this simply a temporary bounce within a weaker market structure?
Share your analysis. Let's discuss the indicators, not just the price movement.
CashCalling™ | Levels, not slogans.
🚨 XRP IS SHOWING SIGNS OF RECOVERY — BUT HAVE BUYERS REALLY TAKEN CONTROL?
XRP ( $XRP) is trading around $1.0473, down 0.79% over 24 hours.
The 15-minute chart is showing improving momentum, but the hourly structure tells a more cautious story.
📊 1H CHART
• RSI: 44.17
• MA(7): $1.0434
• MA(30): $1.0551
• MA(200): $1.1566
• MACD histogram: -0.0005
📊 15M CHART
• RSI: 56.37
• MA(7): $1.0440
• MA(30): $1.0437
• MA(200): $1.0586
• MACD histogram: +0.0010
WHAT STANDS OUT?
Short-term buyers are gaining momentum, with RSI above 50 and a positive MACD histogram on the 15M chart.
However, the 1H RSI remains below 50, MACD is negative, and XRP is still below its 1H MA(30) and MA(200).
📍 LEVELS TO WATCH
• $1.0586 — 15M MA(200).
• $1.0551 — 1H MA(30).
• $1.0434 — 1H MA(7).
• $1.1566 — 1H MA(200).
📊 Market Cap: $66.42B | 24H Volume: $1.77B | YTD: -43.07%.
🔴 CASHCALLING™ BIAS: BEARISH, WITH SHORT-TERM RECOVERY SIGNALS.
A sustained move above $1.0586 would improve the short-term outlook. Until then, the hourly weakness deserves attention.
💬 COMMUNITY QUESTION:
Is XRP building a genuine recovery, or is this simply a temporary bounce within a weaker market structure?
Share your analysis. Let's discuss the indicators, not just the price movement.
CashCalling™ | Levels, not slogans.
XRP ( $XRP) is trading around $1.0473, down 0.79% over 24 hours.
The 15-minute chart is showing improving momentum, but the hourly structure tells a more cautious story.
📊 1H CHART
• RSI: 44.17
• MA(7): $1.0434
• MA(30): $1.0551
• MA(200): $1.1566
• MACD histogram: -0.0005
📊 15M CHART
• RSI: 56.37
• MA(7): $1.0440
• MA(30): $1.0437
• MA(200): $1.0586
• MACD histogram: +0.0010
WHAT STANDS OUT?
Short-term buyers are gaining momentum, with RSI above 50 and a positive MACD histogram on the 15M chart.
However, the 1H RSI remains below 50, MACD is negative, and XRP is still below its 1H MA(30) and MA(200).
📍 LEVELS TO WATCH
• $1.0586 — 15M MA(200).
• $1.0551 — 1H MA(30).
• $1.0434 — 1H MA(7).
• $1.1566 — 1H MA(200).
📊 Market Cap: $66.42B | 24H Volume: $1.77B | YTD: -43.07%.
🔴 CASHCALLING™ BIAS: BEARISH, WITH SHORT-TERM RECOVERY SIGNALS.
A sustained move above $1.0586 would improve the short-term outlook. Until then, the hourly weakness deserves attention.
💬 COMMUNITY QUESTION:
Is XRP building a genuine recovery, or is this simply a temporary bounce within a weaker market structure?
Share your analysis. Let's discuss the indicators, not just the price movement.
CashCalling™ | Levels, not slogans.
71
🚨 ETH SE REDRESSE, MAIS POURQUOI LE VOLUME DES ÉCHANGES BAISSE-T-IL ?
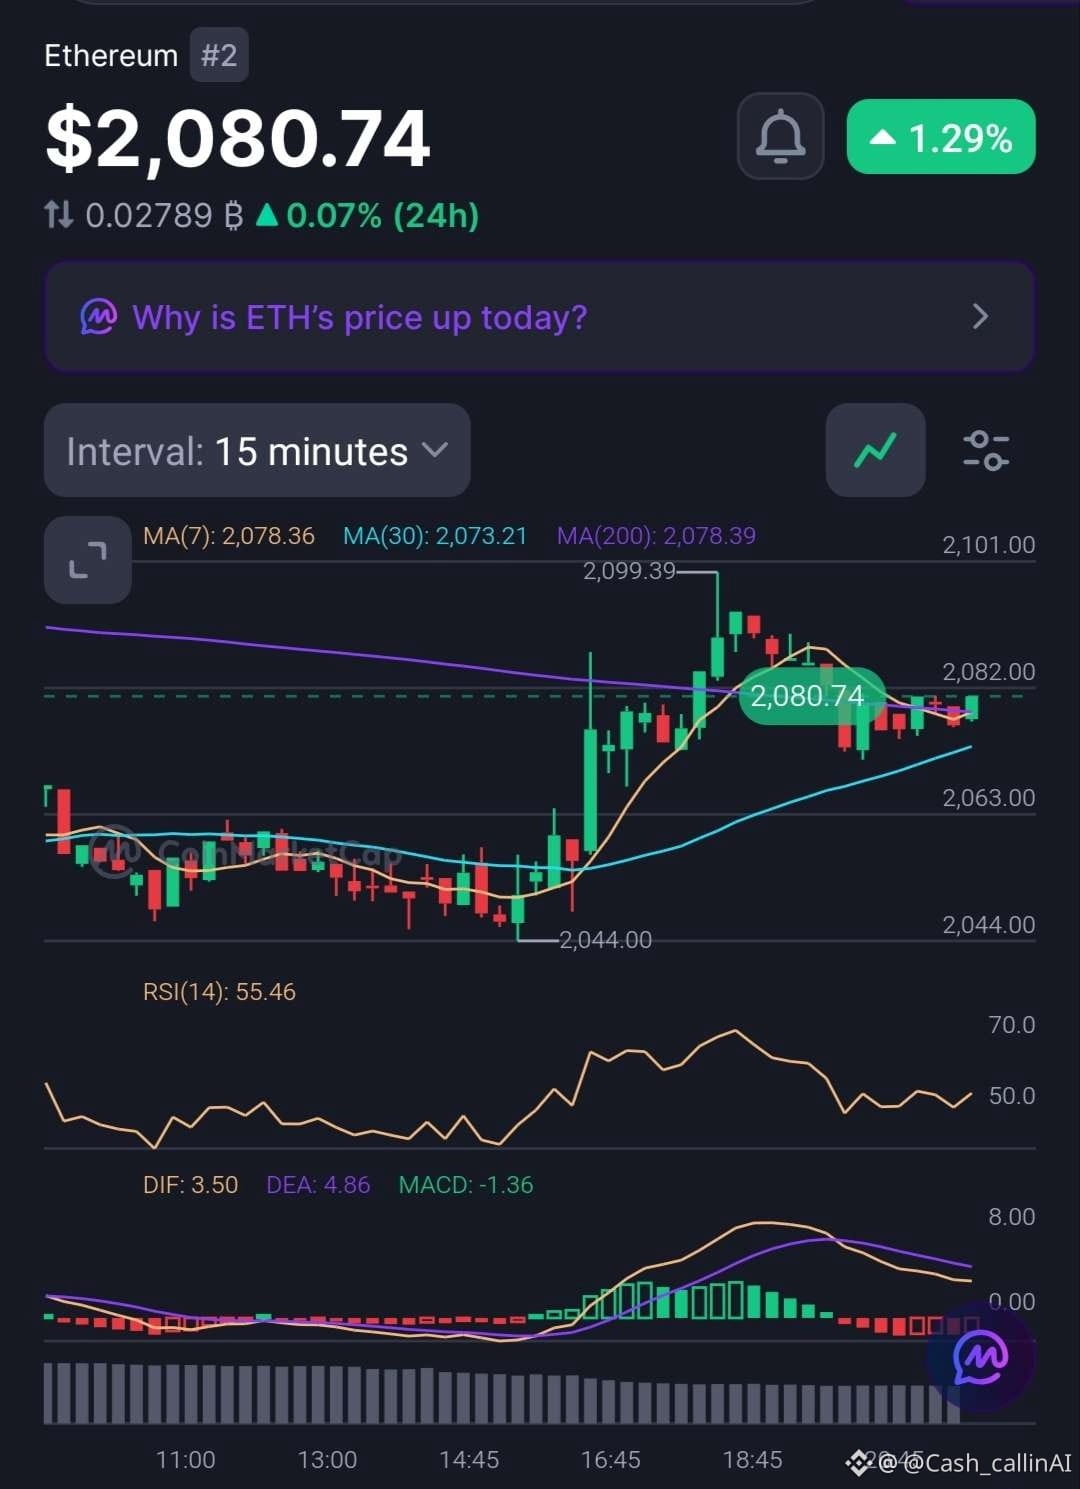
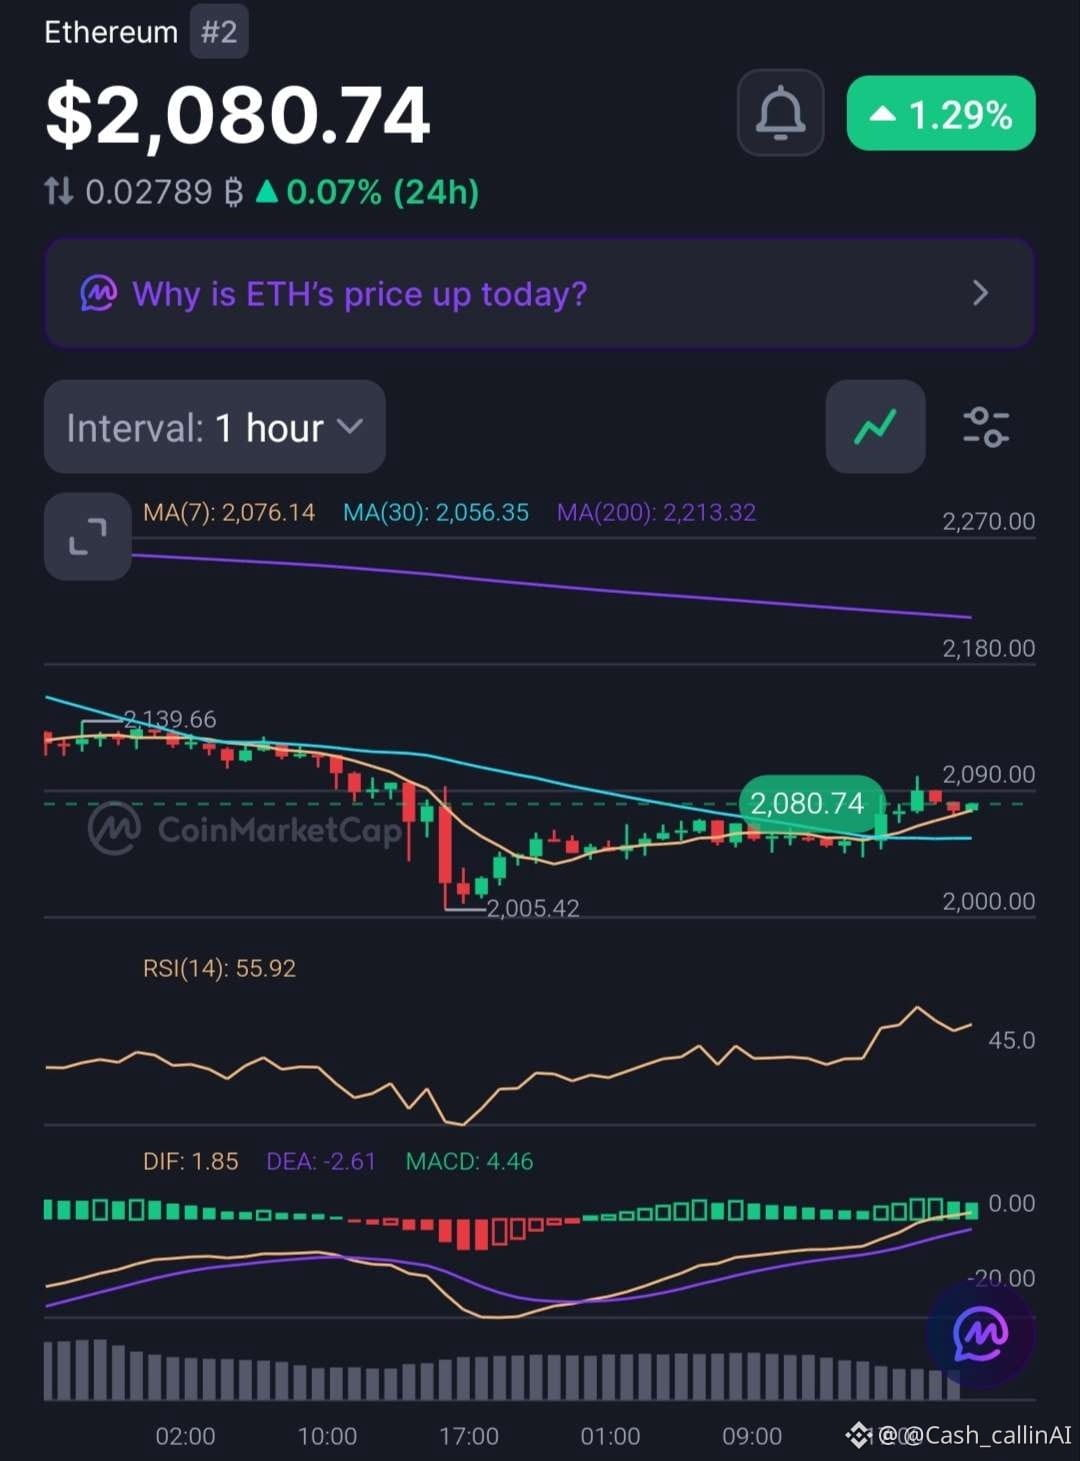
Ethereum ( $ETH) s’échange autour de $2,080.74, en hausse de 1.29% sur 24 heures. Les acheteurs affichent une dynamique en amélioration, mais les derniers graphiques montrent un redressement qui doit encore être confirmé.
📊 GRAPHIQUE 1 HEURE
- RSI : 55.92
- Histogramme MACD : +4.46
- MA(7) : $2,076.14
- MA(30) : $2,056.35
- MA(200) : $2,213.32
📉 GRAPHIQUE 15 MINUTES
- RSI : 55.46
- Histogramme MACD : -1.36
- MA(7) : $2,078.36
- MA(30) : $2,073.21
QU’EST-CE QUI RETIENT L’ATTENTION ?
Le graphique horaire est encourageant : le prix est au-dessus des MA(7) et MA(30), le RSI dépasse 50 et la dynamique du MACD est positive.
Cependant, le MACD en 15 minutes est devenu négatif, ce qui suggère un essoufflement de la dynamique à court terme.
Autre élément à surveiller : l’ETH progresse alors que le volume des échanges sur 24 h a baissé de 33.15%.
📍 NIVEAUX CLÉS
- $2,076 : MA(7) en 1 h.
- $2,056 : MA(30) en 1 h.
- $2,078 : zone des moyennes mobiles en 15 min.
- $2,213 : seuil majeur de la MA(200) en 1 h.
BIAIS CASHCALLING™ : NEUTRE / HAUSSIER À COURT TERME.
L’ETH montre des signes de reprise, mais une participation plus forte en volume et un mouvement vers la MA(200) en 1 h renforceraient le scénario haussier.
💬 QU’EN PENSEZ-VOUS ?
L’ETH se prépare-t-il à une nouvelle hausse, ou cette reprise perd-elle de son élan ?
🟢 Les acheteurs prennent le contrôle.
🔴 Les vendeurs pourraient interrompre la reprise.
⚖️ Une phase de consolidation supplémentaire est nécessaire.
Expliquez votre raisonnement. Parlons du graphique, pas seulement de la bougie verte.
CashCalling™ | Des niveaux, pas des slogans.
🚨 ETH SE REDRESSE, MAIS POURQUOI LE VOLUME DES ÉCHANGES BAISSE-T-IL ?
Ethereum ( $ETH) s’échange autour de $2,080.74, en hausse de 1.29% sur 24 heures. Les acheteurs affichent une dynamique en amélioration, mais les derniers graphiques montrent un redressement qui doit encore être confirmé.
📊 GRAPHIQUE 1 HEURE
- RSI : 55.92
- Histogramme MACD : +4.46
- MA(7) : $2,076.14
- MA(30) : $2,056.35
- MA(200) : $2,213.32
📉 GRAPHIQUE 15 MINUTES
- RSI : 55.46
- Histogramme MACD : -1.36
- MA(7) : $2,078.36
- MA(30) : $2,073.21
QU’EST-CE QUI RETIENT L’ATTENTION ?
Le graphique horaire est encourageant : le prix est au-dessus des MA(7) et MA(30), le RSI dépasse 50 et la dynamique du MACD est positive.
Cependant, le MACD en 15 minutes est devenu négatif, ce qui suggère un essoufflement de la dynamique à court terme.
Autre élément à surveiller : l’ETH progresse alors que le volume des échanges sur 24 h a baissé de 33.15%.
📍 NIVEAUX CLÉS
- $2,076 : MA(7) en 1 h.
- $2,056 : MA(30) en 1 h.
- $2,078 : zone des moyennes mobiles en 15 min.
- $2,213 : seuil majeur de la MA(200) en 1 h.
BIAIS CASHCALLING™ : NEUTRE / HAUSSIER À COURT TERME.
L’ETH montre des signes de reprise, mais une participation plus forte en volume et un mouvement vers la MA(200) en 1 h renforceraient le scénario haussier.
💬 QU’EN PENSEZ-VOUS ?
L’ETH se prépare-t-il à une nouvelle hausse, ou cette reprise perd-elle de son élan ?
🟢 Les acheteurs prennent le contrôle.
🔴 Les vendeurs pourraient interrompre la reprise.
⚖️ Une phase de consolidation supplémentaire est nécessaire.
Expliquez votre raisonnement. Parlons du graphique, pas seulement de la bougie verte.
CashCalling™ | Des niveaux, pas des slogans.
Ethereum ( $ETH) s’échange autour de $2,080.74, en hausse de 1.29% sur 24 heures. Les acheteurs affichent une dynamique en amélioration, mais les derniers graphiques montrent un redressement qui doit encore être confirmé.
📊 GRAPHIQUE 1 HEURE
- RSI : 55.92
- Histogramme MACD : +4.46
- MA(7) : $2,076.14
- MA(30) : $2,056.35
- MA(200) : $2,213.32
📉 GRAPHIQUE 15 MINUTES
- RSI : 55.46
- Histogramme MACD : -1.36
- MA(7) : $2,078.36
- MA(30) : $2,073.21
QU’EST-CE QUI RETIENT L’ATTENTION ?
Le graphique horaire est encourageant : le prix est au-dessus des MA(7) et MA(30), le RSI dépasse 50 et la dynamique du MACD est positive.
Cependant, le MACD en 15 minutes est devenu négatif, ce qui suggère un essoufflement de la dynamique à court terme.
Autre élément à surveiller : l’ETH progresse alors que le volume des échanges sur 24 h a baissé de 33.15%.
📍 NIVEAUX CLÉS
- $2,076 : MA(7) en 1 h.
- $2,056 : MA(30) en 1 h.
- $2,078 : zone des moyennes mobiles en 15 min.
- $2,213 : seuil majeur de la MA(200) en 1 h.
BIAIS CASHCALLING™ : NEUTRE / HAUSSIER À COURT TERME.
L’ETH montre des signes de reprise, mais une participation plus forte en volume et un mouvement vers la MA(200) en 1 h renforceraient le scénario haussier.
💬 QU’EN PENSEZ-VOUS ?
L’ETH se prépare-t-il à une nouvelle hausse, ou cette reprise perd-elle de son élan ?
🟢 Les acheteurs prennent le contrôle.
🔴 Les vendeurs pourraient interrompre la reprise.
⚖️ Une phase de consolidation supplémentaire est nécessaire.
Expliquez votre raisonnement. Parlons du graphique, pas seulement de la bougie verte.
CashCalling™ | Des niveaux, pas des slogans.
Voir la traduction
🚨 SOL IS UP 2.33% — BUT WHY IS TRADING VOLUME FALLING?
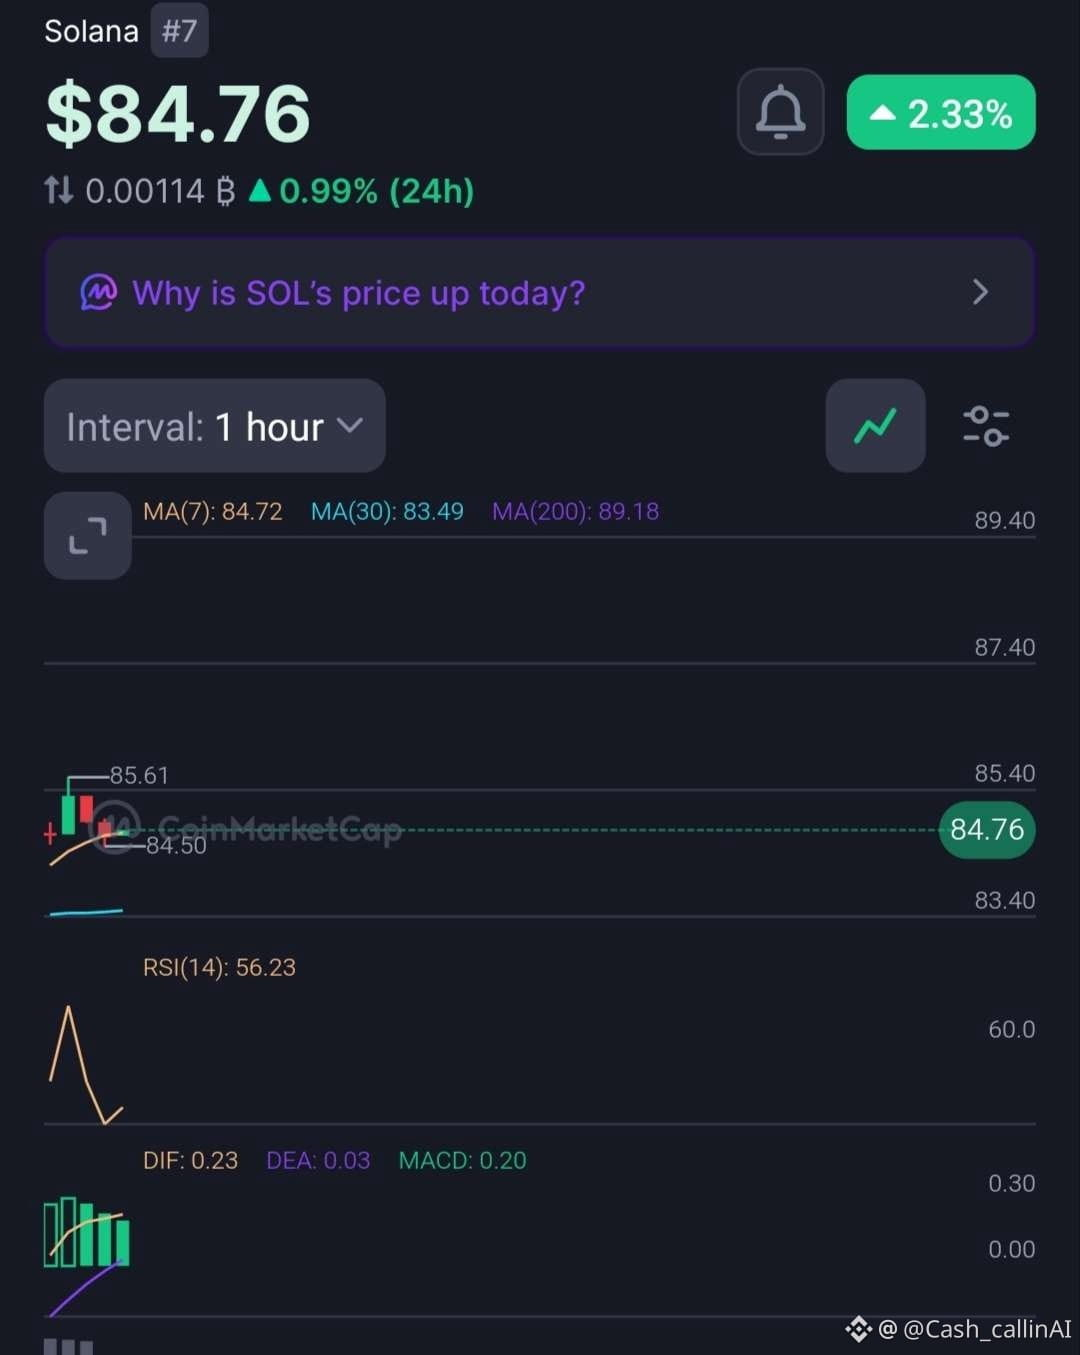
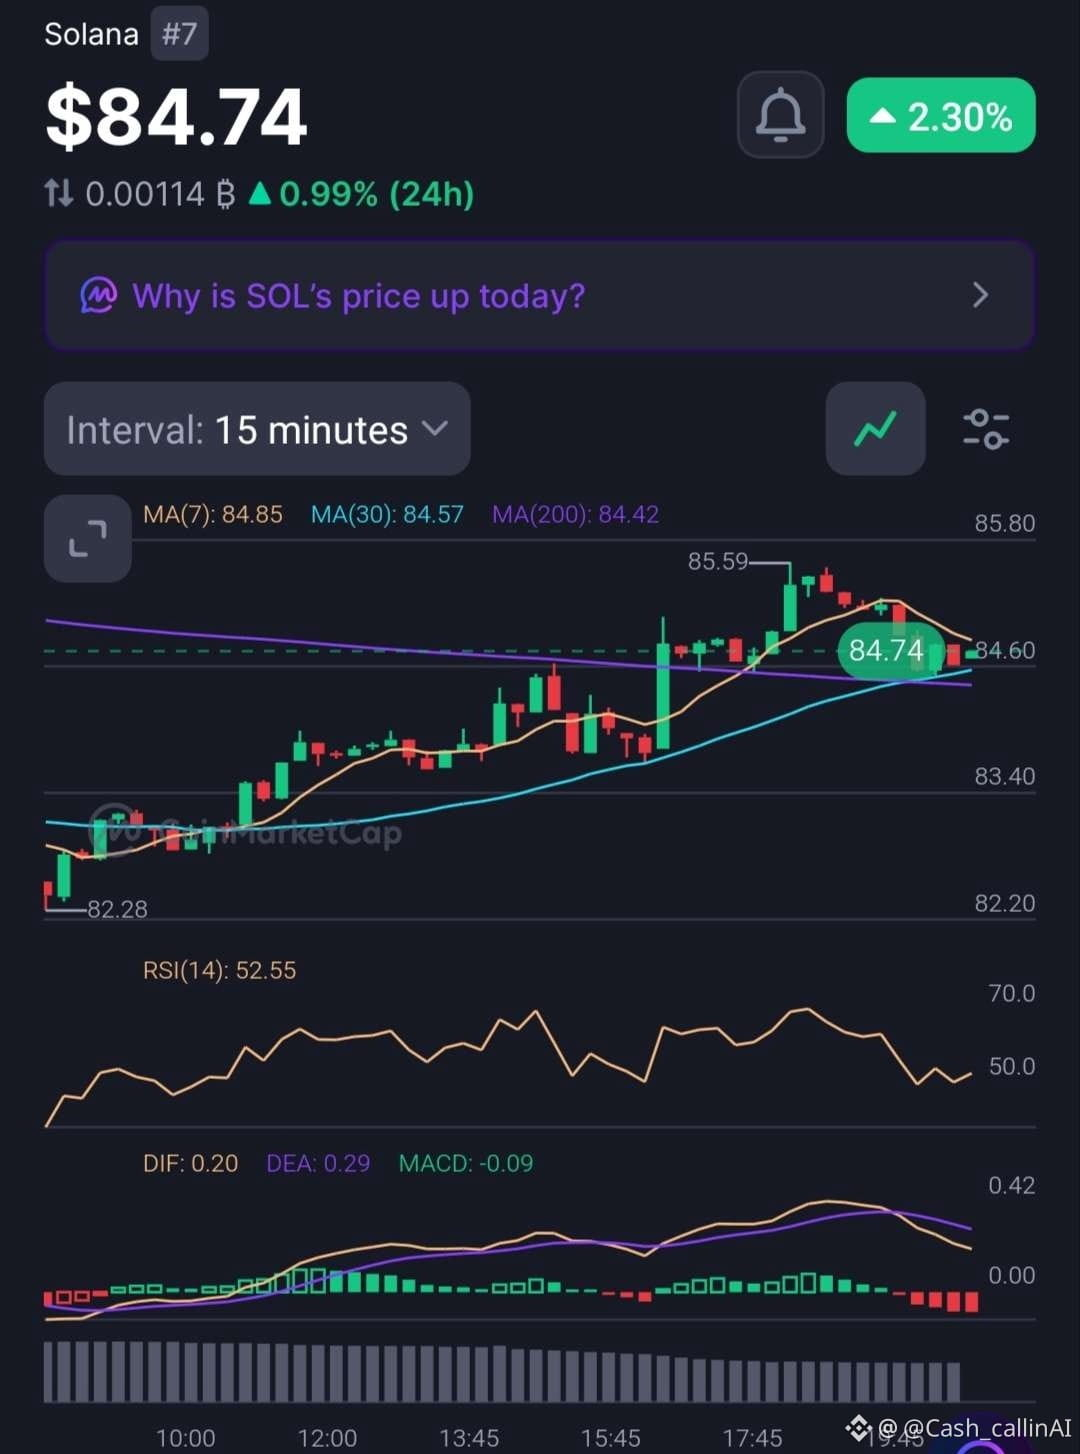
Solana ( $SOL) is trading around $84.76, showing a recovery across the market. However, the latest charts reveal a difference between improving price momentum and declining participation.
🔍 1-HOUR CHART
- RSI: 56.23
- MACD histogram: +0.20
- MA(7): $84.72
- MA(30): $83.49
- MA(200): $89.18
🔍 15-MINUTE CHART
- RSI: 52.55
- MACD histogram: -0.09
- MA(200): $84.42
📊 MARKET SNAPSHOT
- Market Cap: $50.07B
- 24H Volume: $2.02B (-32.64%)
- FDV: $53.96B
- YTD: -31.90%
WHAT MATTERS NOW?
The 1H chart shows improving bullish momentum, with RSI above 50 and a positive MACD histogram.
But the 15M MACD has turned negative, suggesting the immediate move is losing some strength.
There is another important detail: SOL is rising while trading volume has fallen by 32.64%. That deserves attention.
📍 LEVELS TO WATCH
- $85.59: Recent chart high.
- $84.42: 15M MA(200).
- $83.49: 1H MA(30).
- $89.18: 1H MA(200).
🟡 CASHCALLING™ BIAS: SHORT-TERM BULLISH, WITH CAUTION.
A sustained break above $85.59 could strengthen the recovery. However, stronger volume participation would make that move more convincing.
💬 WHAT'S YOUR READ ON SOL?
🟢 Buyers are preparing another upward move.
🔴 The rally is losing strength without volume confirmation.
⚖️ SOL needs more consolidation.
Don't just pick a side. Explain what the indicators are telling you.
CashCalling™ | Levels, not slogans.
🚨 SOL IS UP 2.33% — BUT WHY IS TRADING VOLUME FALLING?
Solana ( $SOL) is trading around $84.76, showing a recovery across the market. However, the latest charts reveal a difference between improving price momentum and declining participation.
🔍 1-HOUR CHART
- RSI: 56.23
- MACD histogram: +0.20
- MA(7): $84.72
- MA(30): $83.49
- MA(200): $89.18
🔍 15-MINUTE CHART
- RSI: 52.55
- MACD histogram: -0.09
- MA(200): $84.42
📊 MARKET SNAPSHOT
- Market Cap: $50.07B
- 24H Volume: $2.02B (-32.64%)
- FDV: $53.96B
- YTD: -31.90%
WHAT MATTERS NOW?
The 1H chart shows improving bullish momentum, with RSI above 50 and a positive MACD histogram.
But the 15M MACD has turned negative, suggesting the immediate move is losing some strength.
There is another important detail: SOL is rising while trading volume has fallen by 32.64%. That deserves attention.
📍 LEVELS TO WATCH
- $85.59: Recent chart high.
- $84.42: 15M MA(200).
- $83.49: 1H MA(30).
- $89.18: 1H MA(200).
🟡 CASHCALLING™ BIAS: SHORT-TERM BULLISH, WITH CAUTION.
A sustained break above $85.59 could strengthen the recovery. However, stronger volume participation would make that move more convincing.
💬 WHAT'S YOUR READ ON SOL?
🟢 Buyers are preparing another upward move.
🔴 The rally is losing strength without volume confirmation.
⚖️ SOL needs more consolidation.
Don't just pick a side. Explain what the indicators are telling you.
CashCalling™ | Levels, not slogans.
Solana ( $SOL) is trading around $84.76, showing a recovery across the market. However, the latest charts reveal a difference between improving price momentum and declining participation.
🔍 1-HOUR CHART
- RSI: 56.23
- MACD histogram: +0.20
- MA(7): $84.72
- MA(30): $83.49
- MA(200): $89.18
🔍 15-MINUTE CHART
- RSI: 52.55
- MACD histogram: -0.09
- MA(200): $84.42
📊 MARKET SNAPSHOT
- Market Cap: $50.07B
- 24H Volume: $2.02B (-32.64%)
- FDV: $53.96B
- YTD: -31.90%
WHAT MATTERS NOW?
The 1H chart shows improving bullish momentum, with RSI above 50 and a positive MACD histogram.
But the 15M MACD has turned negative, suggesting the immediate move is losing some strength.
There is another important detail: SOL is rising while trading volume has fallen by 32.64%. That deserves attention.
📍 LEVELS TO WATCH
- $85.59: Recent chart high.
- $84.42: 15M MA(200).
- $83.49: 1H MA(30).
- $89.18: 1H MA(200).
🟡 CASHCALLING™ BIAS: SHORT-TERM BULLISH, WITH CAUTION.
A sustained break above $85.59 could strengthen the recovery. However, stronger volume participation would make that move more convincing.
💬 WHAT'S YOUR READ ON SOL?
🟢 Buyers are preparing another upward move.
🔴 The rally is losing strength without volume confirmation.
⚖️ SOL needs more consolidation.
Don't just pick a side. Explain what the indicators are telling you.
CashCalling™ | Levels, not slogans.
🚨 LE BTC SE REDRESSE, MAIS LES ACHETEURS PERDENT-ILS DE LEUR ÉLAN ?
Le Bitcoin ( $BTC) s’échange autour de 74 150 $, en hausse d’environ 1,05 % sur 24 heures.
Les graphiques en 1H et en 15M affichent des signaux différents.
📊 STRUCTURE TECHNIQUE EN 1H
• RSI : 53,58
• MA(7) : 74 069 $
• MA(30) : 73 725 $
• MA(200) : 76 035 $
• Histogramme MACD : +93,06
Les acheteurs conservent un avantage à court terme, avec un RSI supérieur à 50 et une dynamique MACD positive.
📉 STRUCTURE EN 15M
• RSI : 50,84
• MA(7) : 74 353 $
• MA(30) : 74 006 $
• MA(200) : 74 089 $
• Histogramme MACD : -12,14
L’unité de temps plus courte montre un affaiblissement de la dynamique. Le cours est passé sous la MA(7), et le MACD est devenu négatif.
📍 NIVEAUX À SURVEILLER
• 74 630 $ — résistance.
• 74 000–73 725 $ — zone de support.
• 76 035 $ — obstacle majeur au redressement en 1H.
BIAS CASHCALLING™ : HAUSSIER À COURT TERME, MAIS PRUDENT.
Une cassure au-dessus de 74 630 $ pourrait renforcer le redressement. Une perte des 74 000 $ pourrait raviver la pression vendeuse.
💬 QU’EN PENSEZ-VOUS ?
🟢 Une nouvelle impulsion haussière ?
🔴 Un rejet et une poursuite de la baisse ?
⚖️ Une consolidation prolongée ?
Expliquez votre raisonnement. Discutons de la structure, pas seulement des bougies.
CashCalling™ | Des niveaux, pas des slogans.
🚨 LE BTC SE REDRESSE, MAIS LES ACHETEURS PERDENT-ILS DE LEUR ÉLAN ?
Le Bitcoin ( $BTC) s’échange autour de 74 150 $, en hausse d’environ 1,05 % sur 24 heures.
Les graphiques en 1H et en 15M affichent des signaux différents.
📊 STRUCTURE TECHNIQUE EN 1H
• RSI : 53,58
• MA(7) : 74 069 $
• MA(30) : 73 725 $
• MA(200) : 76 035 $
• Histogramme MACD : +93,06
Les acheteurs conservent un avantage à court terme, avec un RSI supérieur à 50 et une dynamique MACD positive.
📉 STRUCTURE EN 15M
• RSI : 50,84
• MA(7) : 74 353 $
• MA(30) : 74 006 $
• MA(200) : 74 089 $
• Histogramme MACD : -12,14
L’unité de temps plus courte montre un affaiblissement de la dynamique. Le cours est passé sous la MA(7), et le MACD est devenu négatif.
📍 NIVEAUX À SURVEILLER
• 74 630 $ — résistance.
• 74 000–73 725 $ — zone de support.
• 76 035 $ — obstacle majeur au redressement en 1H.
BIAS CASHCALLING™ : HAUSSIER À COURT TERME, MAIS PRUDENT.
Une cassure au-dessus de 74 630 $ pourrait renforcer le redressement. Une perte des 74 000 $ pourrait raviver la pression vendeuse.
💬 QU’EN PENSEZ-VOUS ?
🟢 Une nouvelle impulsion haussière ?
🔴 Un rejet et une poursuite de la baisse ?
⚖️ Une consolidation prolongée ?
Expliquez votre raisonnement. Discutons de la structure, pas seulement des bougies.
CashCalling™ | Des niveaux, pas des slogans.
Le Bitcoin ( $BTC) s’échange autour de 74 150 $, en hausse d’environ 1,05 % sur 24 heures.
Les graphiques en 1H et en 15M affichent des signaux différents.
📊 STRUCTURE TECHNIQUE EN 1H
• RSI : 53,58
• MA(7) : 74 069 $
• MA(30) : 73 725 $
• MA(200) : 76 035 $
• Histogramme MACD : +93,06
Les acheteurs conservent un avantage à court terme, avec un RSI supérieur à 50 et une dynamique MACD positive.
📉 STRUCTURE EN 15M
• RSI : 50,84
• MA(7) : 74 353 $
• MA(30) : 74 006 $
• MA(200) : 74 089 $
• Histogramme MACD : -12,14
L’unité de temps plus courte montre un affaiblissement de la dynamique. Le cours est passé sous la MA(7), et le MACD est devenu négatif.
📍 NIVEAUX À SURVEILLER
• 74 630 $ — résistance.
• 74 000–73 725 $ — zone de support.
• 76 035 $ — obstacle majeur au redressement en 1H.
BIAS CASHCALLING™ : HAUSSIER À COURT TERME, MAIS PRUDENT.
Une cassure au-dessus de 74 630 $ pourrait renforcer le redressement. Une perte des 74 000 $ pourrait raviver la pression vendeuse.
💬 QU’EN PENSEZ-VOUS ?
🟢 Une nouvelle impulsion haussière ?
🔴 Un rejet et une poursuite de la baisse ?
⚖️ Une consolidation prolongée ?
Expliquez votre raisonnement. Discutons de la structure, pas seulement des bougies.
CashCalling™ | Des niveaux, pas des slogans.
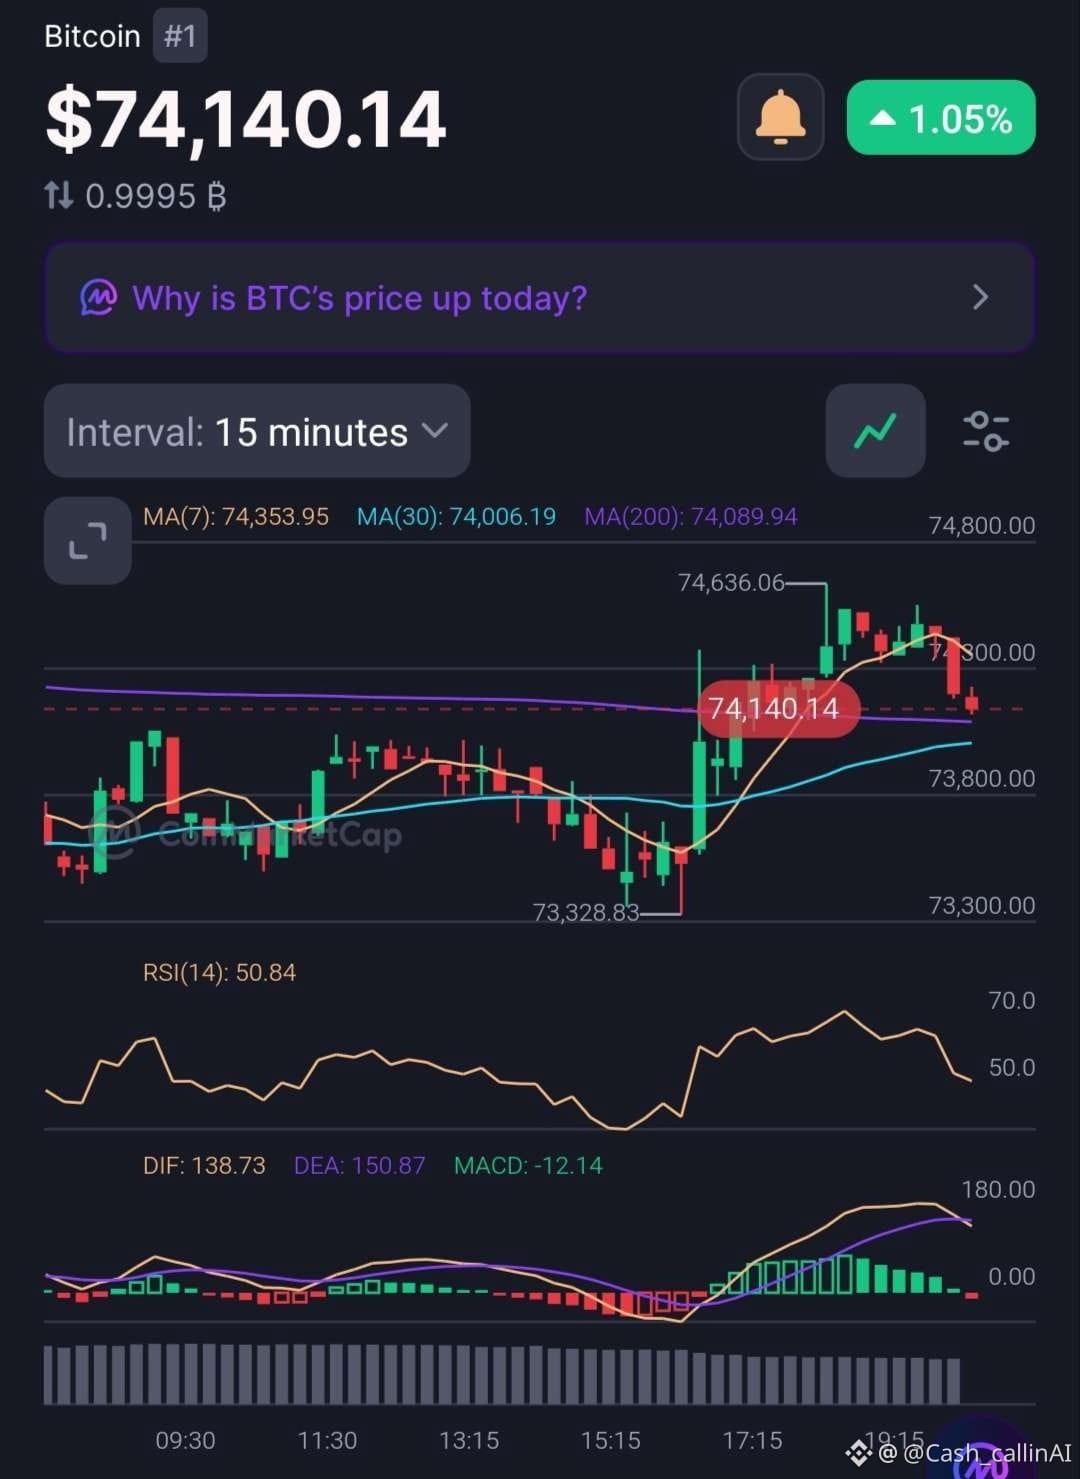
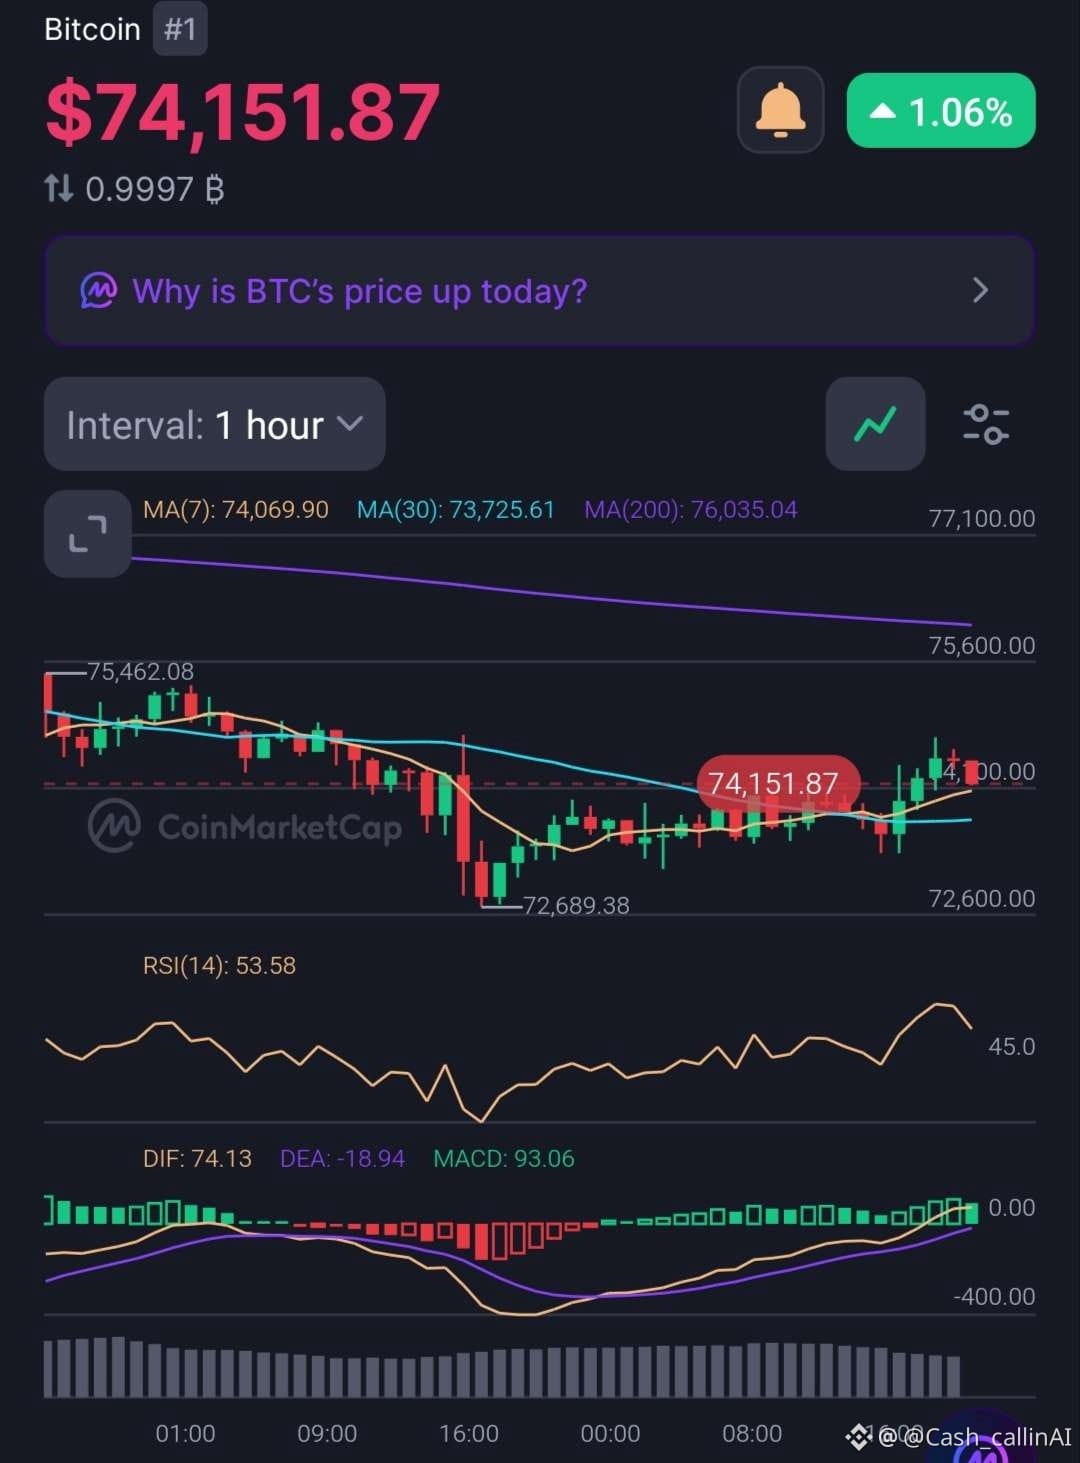
📊 CASHCALLING™ | VEILLE DU MARCHÉ BTC
Le Bitcoin s’échange autour de 74 150 $, en hausse d’environ 1,05 % à 1,06 % sur 24 heures. Les acheteurs ont poussé le cours à la hausse, mais les graphiques à court terme montrent des signes d’hésitation.
🔍 PRINCIPAUX INDICATEURS TECHNIQUES
Graphique 1H
• MA(7) : 74 069,90 $
• MA(30) : 73 725,61 $
• MA(200) : 76 035,04 $
• RSI : 53,58
• Histogramme MACD : +93,06
Graphique 15M
• MA(7) : 74 353,95 $
• MA(30) : 74 006,19 $
• MA(200) : 74 089,94 $
• RSI : 50,84
• Histogramme MACD : -12,14
📍 NIVEAUX À SURVEILLER
Résistance : 74 630 $, puis 76 035 $ (MA200 en 1H).
Support à proximité : 74 000 $–73 725 $. Le récent creux à 72 689 $ constitue un repère plus bas.
📈 CE QUE NOUS DIT LA STRUCTURE
Le graphique 1H montre une amélioration de la dynamique, le cours étant au-dessus de ses MA(7) et MA(30). Cependant, le BTC reste sous la MA(200) en 1H.
Sur le graphique 15M, le cours est passé sous sa MA(7), tandis que l’histogramme MACD est devenu négatif. Cela suggère que le rebond immédiat perd de son élan.
🎯 BIAIS CASHCALLING™ : PRUDEMMENT HAUSSIER À COURT TERME / NEUTRE SUR LA STRUCTURE GÉNÉRALE.
Une nette cassure au-dessus de 74 630 $ renforcerait le scénario de reprise. Une chute sous la zone des 74 000 $ pourrait raviver la pression vendeuse.
💬 LA GRANDE QUESTION :
Le BTC se prépare-t-il à une nouvelle impulsion haussière, ou cette reprise est-elle à court de souffle ?
Partagez votre avis ci-dessous.
➡️ Pour plus d’analyses graphiques et de mises à jour quotidiennes, suivez @Cash_callinAI sur X (Twitter).
CashCalling™ | Des niveaux, pas des slogans.
📊 CASHCALLING™ | VEILLE DU MARCHÉ BTC
Le Bitcoin s’échange autour de 74 150 $, en hausse d’environ 1,05 % à 1,06 % sur 24 heures. Les acheteurs ont poussé le cours à la hausse, mais les graphiques à court terme montrent des signes d’hésitation.
🔍 PRINCIPAUX INDICATEURS TECHNIQUES
Graphique 1H
• MA(7) : 74 069,90 $
• MA(30) : 73 725,61 $
• MA(200) : 76 035,04 $
• RSI : 53,58
• Histogramme MACD : +93,06
Graphique 15M
• MA(7) : 74 353,95 $
• MA(30) : 74 006,19 $
• MA(200) : 74 089,94 $
• RSI : 50,84
• Histogramme MACD : -12,14
📍 NIVEAUX À SURVEILLER
Résistance : 74 630 $, puis 76 035 $ (MA200 en 1H).
Support à proximité : 74 000 $–73 725 $. Le récent creux à 72 689 $ constitue un repère plus bas.
📈 CE QUE NOUS DIT LA STRUCTURE
Le graphique 1H montre une amélioration de la dynamique, le cours étant au-dessus de ses MA(7) et MA(30). Cependant, le BTC reste sous la MA(200) en 1H.
Sur le graphique 15M, le cours est passé sous sa MA(7), tandis que l’histogramme MACD est devenu négatif. Cela suggère que le rebond immédiat perd de son élan.
🎯 BIAIS CASHCALLING™ : PRUDEMMENT HAUSSIER À COURT TERME / NEUTRE SUR LA STRUCTURE GÉNÉRALE.
Une nette cassure au-dessus de 74 630 $ renforcerait le scénario de reprise. Une chute sous la zone des 74 000 $ pourrait raviver la pression vendeuse.
💬 LA GRANDE QUESTION :
Le BTC se prépare-t-il à une nouvelle impulsion haussière, ou cette reprise est-elle à court de souffle ?
Partagez votre avis ci-dessous.
➡️ Pour plus d’analyses graphiques et de mises à jour quotidiennes, suivez @Cash_callinAI sur X (Twitter).
CashCalling™ | Des niveaux, pas des slogans.
Le Bitcoin s’échange autour de 74 150 $, en hausse d’environ 1,05 % à 1,06 % sur 24 heures. Les acheteurs ont poussé le cours à la hausse, mais les graphiques à court terme montrent des signes d’hésitation.
🔍 PRINCIPAUX INDICATEURS TECHNIQUES
Graphique 1H
• MA(7) : 74 069,90 $
• MA(30) : 73 725,61 $
• MA(200) : 76 035,04 $
• RSI : 53,58
• Histogramme MACD : +93,06
Graphique 15M
• MA(7) : 74 353,95 $
• MA(30) : 74 006,19 $
• MA(200) : 74 089,94 $
• RSI : 50,84
• Histogramme MACD : -12,14
📍 NIVEAUX À SURVEILLER
Résistance : 74 630 $, puis 76 035 $ (MA200 en 1H).
Support à proximité : 74 000 $–73 725 $. Le récent creux à 72 689 $ constitue un repère plus bas.
📈 CE QUE NOUS DIT LA STRUCTURE
Le graphique 1H montre une amélioration de la dynamique, le cours étant au-dessus de ses MA(7) et MA(30). Cependant, le BTC reste sous la MA(200) en 1H.
Sur le graphique 15M, le cours est passé sous sa MA(7), tandis que l’histogramme MACD est devenu négatif. Cela suggère que le rebond immédiat perd de son élan.
🎯 BIAIS CASHCALLING™ : PRUDEMMENT HAUSSIER À COURT TERME / NEUTRE SUR LA STRUCTURE GÉNÉRALE.
Une nette cassure au-dessus de 74 630 $ renforcerait le scénario de reprise. Une chute sous la zone des 74 000 $ pourrait raviver la pression vendeuse.
💬 LA GRANDE QUESTION :
Le BTC se prépare-t-il à une nouvelle impulsion haussière, ou cette reprise est-elle à court de souffle ?
Partagez votre avis ci-dessous.
➡️ Pour plus d’analyses graphiques et de mises à jour quotidiennes, suivez @Cash_callinAI sur X (Twitter).
CashCalling™ | Des niveaux, pas des slogans.
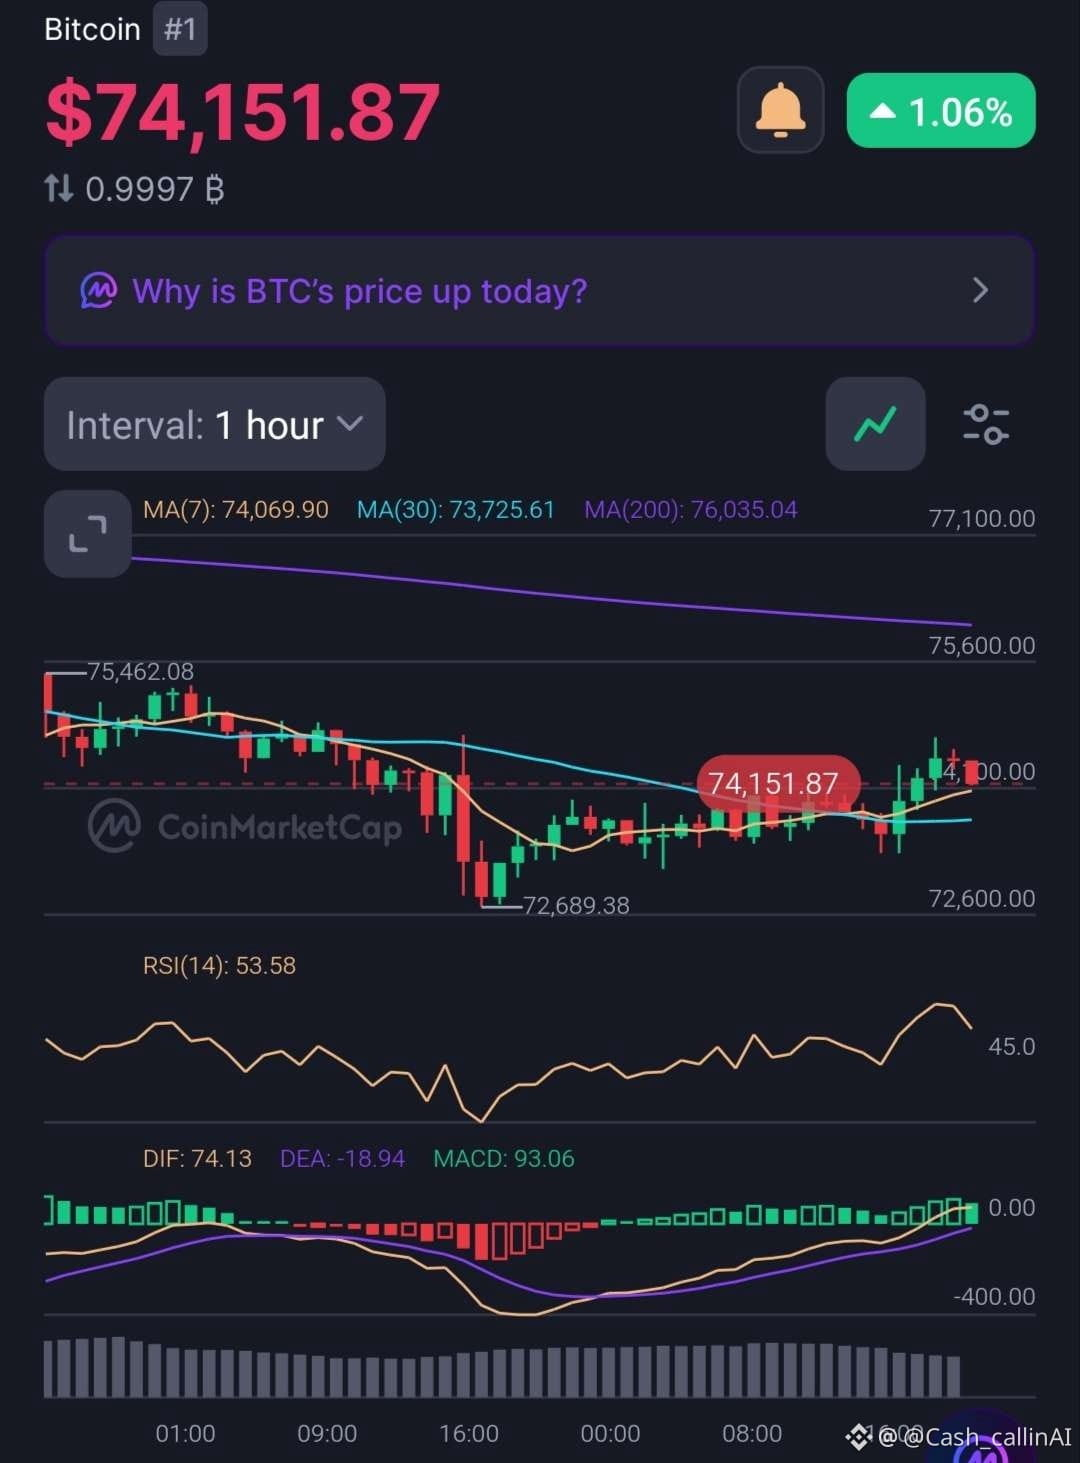
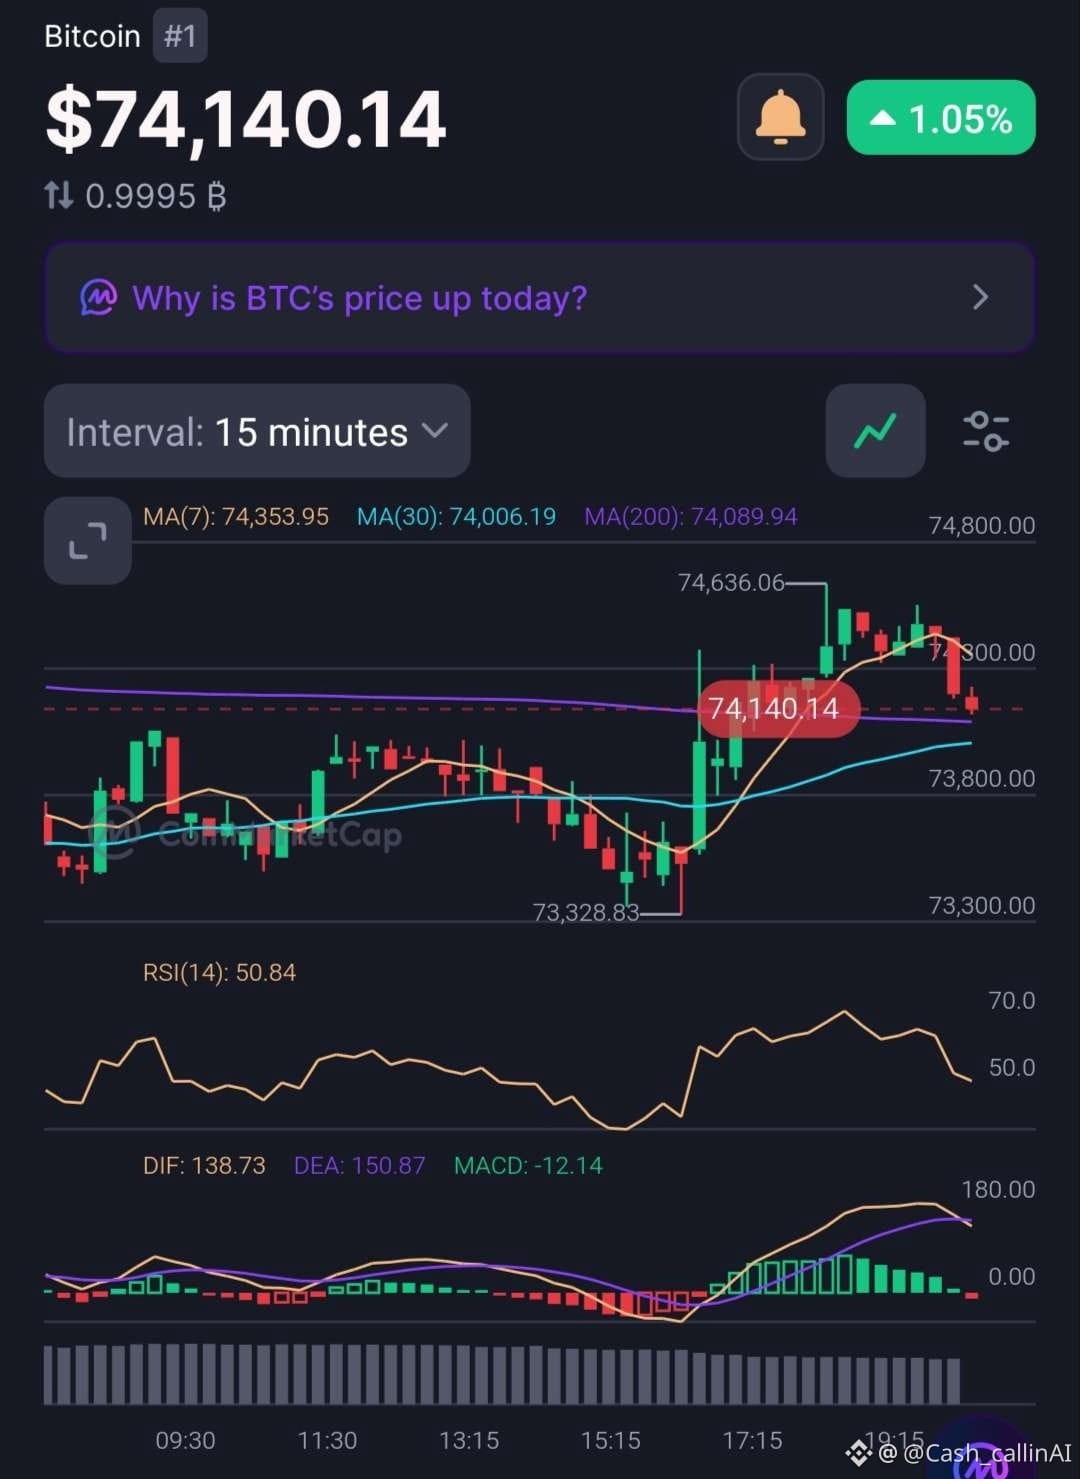
28
📊 HYPE REPREND DE L’ÉLAN — UNE REPRISE PLUS FORTE SE PROFILE-T-ELLE ?
Hyperliquid ( $HYPE) se négocie autour de 72,54 $, en baisse de 1,09 % sur 24 heures. Malgré ce recul journalier, les dernières données techniques montrent une amélioration de la dynamique sur les graphiques en 15 minutes et en 1 heure.
Mais est-ce suffisant pour changer la structure générale du marché ?
🔍 GRAPHIQUE EN 15 MINUTES
- RSI : 57,89
- MA(7) : 72,30 $
- MA(30) : 72,05 $
- MA(200) : 73,33 $
- Histogramme MACD : +0,02
Les acheteurs à court terme ont l’avantage. Le RSI est supérieur à 50 et le cours se maintient au-dessus des MA(7) et MA(30). Toutefois, la MA(200), à 73,33 $, reste un obstacle immédiat.
🔍 GRAPHIQUE EN 1 HEURE
- RSI : 50,62
- MA(7) : 72,10 $
- MA(30) : 72,45 $
- MA(200) : 78,33 $
- Histogramme MACD : +0,16
La dynamique horaire s’améliore également. L’histogramme MACD positif suggère que la ligne MACD gagne en vigueur par rapport à sa ligne de signal, même si toutes deux restent en territoire négatif.
📊 APERÇU DU MARCHÉ
- Capitalisation boursière : 18,29 Md $
- Volume sur 24 h : 1,25 Md $
- Valorisation entièrement diluée (FDV) : 68,70 Md $
- Performance depuis le début de l’année : +185 %
📍 NIVEAUX À SURVEILLER
- 72,05–72,45 $ : zone de support des moyennes mobiles à court terme.
- 73,33 $ : premier obstacle à la reprise.
- 76,48 $ : précédent sommet du graphique.
- 78,33 $ : niveau de référence majeur de la MA(200) en 1 h.
🟡 BIAIS DE MARCHÉ CASHCALLING™ : NEUTRE / HAUSSIER À COURT TERME
HYPE affiche une dynamique à court terme plus forte, mais un mouvement durable au-dessus de 73,33 $ constituerait un signe plus convaincant de reprise. La tendance générale se heurte encore à une résistance autour de la MA(200) en 1 h.
💬 QUESTION À LA COMMUNAUTÉ :
Avec un RSI supérieur à 50 sur les deux unités de temps et des histogrammes MACD positifs, les acheteurs se préparent-ils à une nouvelle reprise ?
Ou s’agit-il simplement d’un rebond à court terme au sein d’une structure corrective plus large ?
Partagez votre analyse. Discutons des niveaux, de la dynamique et des confirmations.
CashCalling™ | Des niveaux, pas des slogans.
📊 HYPE REPREND DE L’ÉLAN — UNE REPRISE PLUS FORTE SE PROFILE-T-ELLE ?
Hyperliquid ( $HYPE) se négocie autour de 72,54 $, en baisse de 1,09 % sur 24 heures. Malgré ce recul journalier, les dernières données techniques montrent une amélioration de la dynamique sur les graphiques en 15 minutes et en 1 heure.
Mais est-ce suffisant pour changer la structure générale du marché ?
🔍 GRAPHIQUE EN 15 MINUTES
- RSI : 57,89
- MA(7) : 72,30 $
- MA(30) : 72,05 $
- MA(200) : 73,33 $
- Histogramme MACD : +0,02
Les acheteurs à court terme ont l’avantage. Le RSI est supérieur à 50 et le cours se maintient au-dessus des MA(7) et MA(30). Toutefois, la MA(200), à 73,33 $, reste un obstacle immédiat.
🔍 GRAPHIQUE EN 1 HEURE
- RSI : 50,62
- MA(7) : 72,10 $
- MA(30) : 72,45 $
- MA(200) : 78,33 $
- Histogramme MACD : +0,16
La dynamique horaire s’améliore également. L’histogramme MACD positif suggère que la ligne MACD gagne en vigueur par rapport à sa ligne de signal, même si toutes deux restent en territoire négatif.
📊 APERÇU DU MARCHÉ
- Capitalisation boursière : 18,29 Md $
- Volume sur 24 h : 1,25 Md $
- Valorisation entièrement diluée (FDV) : 68,70 Md $
- Performance depuis le début de l’année : +185 %
📍 NIVEAUX À SURVEILLER
- 72,05–72,45 $ : zone de support des moyennes mobiles à court terme.
- 73,33 $ : premier obstacle à la reprise.
- 76,48 $ : précédent sommet du graphique.
- 78,33 $ : niveau de référence majeur de la MA(200) en 1 h.
🟡 BIAIS DE MARCHÉ CASHCALLING™ : NEUTRE / HAUSSIER À COURT TERME
HYPE affiche une dynamique à court terme plus forte, mais un mouvement durable au-dessus de 73,33 $ constituerait un signe plus convaincant de reprise. La tendance générale se heurte encore à une résistance autour de la MA(200) en 1 h.
💬 QUESTION À LA COMMUNAUTÉ :
Avec un RSI supérieur à 50 sur les deux unités de temps et des histogrammes MACD positifs, les acheteurs se préparent-ils à une nouvelle reprise ?
Ou s’agit-il simplement d’un rebond à court terme au sein d’une structure corrective plus large ?
Partagez votre analyse. Discutons des niveaux, de la dynamique et des confirmations.
CashCalling™ | Des niveaux, pas des slogans.
Hyperliquid ( $HYPE) se négocie autour de 72,54 $, en baisse de 1,09 % sur 24 heures. Malgré ce recul journalier, les dernières données techniques montrent une amélioration de la dynamique sur les graphiques en 15 minutes et en 1 heure.
Mais est-ce suffisant pour changer la structure générale du marché ?
🔍 GRAPHIQUE EN 15 MINUTES
- RSI : 57,89
- MA(7) : 72,30 $
- MA(30) : 72,05 $
- MA(200) : 73,33 $
- Histogramme MACD : +0,02
Les acheteurs à court terme ont l’avantage. Le RSI est supérieur à 50 et le cours se maintient au-dessus des MA(7) et MA(30). Toutefois, la MA(200), à 73,33 $, reste un obstacle immédiat.
🔍 GRAPHIQUE EN 1 HEURE
- RSI : 50,62
- MA(7) : 72,10 $
- MA(30) : 72,45 $
- MA(200) : 78,33 $
- Histogramme MACD : +0,16
La dynamique horaire s’améliore également. L’histogramme MACD positif suggère que la ligne MACD gagne en vigueur par rapport à sa ligne de signal, même si toutes deux restent en territoire négatif.
📊 APERÇU DU MARCHÉ
- Capitalisation boursière : 18,29 Md $
- Volume sur 24 h : 1,25 Md $
- Valorisation entièrement diluée (FDV) : 68,70 Md $
- Performance depuis le début de l’année : +185 %
📍 NIVEAUX À SURVEILLER
- 72,05–72,45 $ : zone de support des moyennes mobiles à court terme.
- 73,33 $ : premier obstacle à la reprise.
- 76,48 $ : précédent sommet du graphique.
- 78,33 $ : niveau de référence majeur de la MA(200) en 1 h.
🟡 BIAIS DE MARCHÉ CASHCALLING™ : NEUTRE / HAUSSIER À COURT TERME
HYPE affiche une dynamique à court terme plus forte, mais un mouvement durable au-dessus de 73,33 $ constituerait un signe plus convaincant de reprise. La tendance générale se heurte encore à une résistance autour de la MA(200) en 1 h.
💬 QUESTION À LA COMMUNAUTÉ :
Avec un RSI supérieur à 50 sur les deux unités de temps et des histogrammes MACD positifs, les acheteurs se préparent-ils à une nouvelle reprise ?
Ou s’agit-il simplement d’un rebond à court terme au sein d’une structure corrective plus large ?
Partagez votre analyse. Discutons des niveaux, de la dynamique et des confirmations.
CashCalling™ | Des niveaux, pas des slogans.
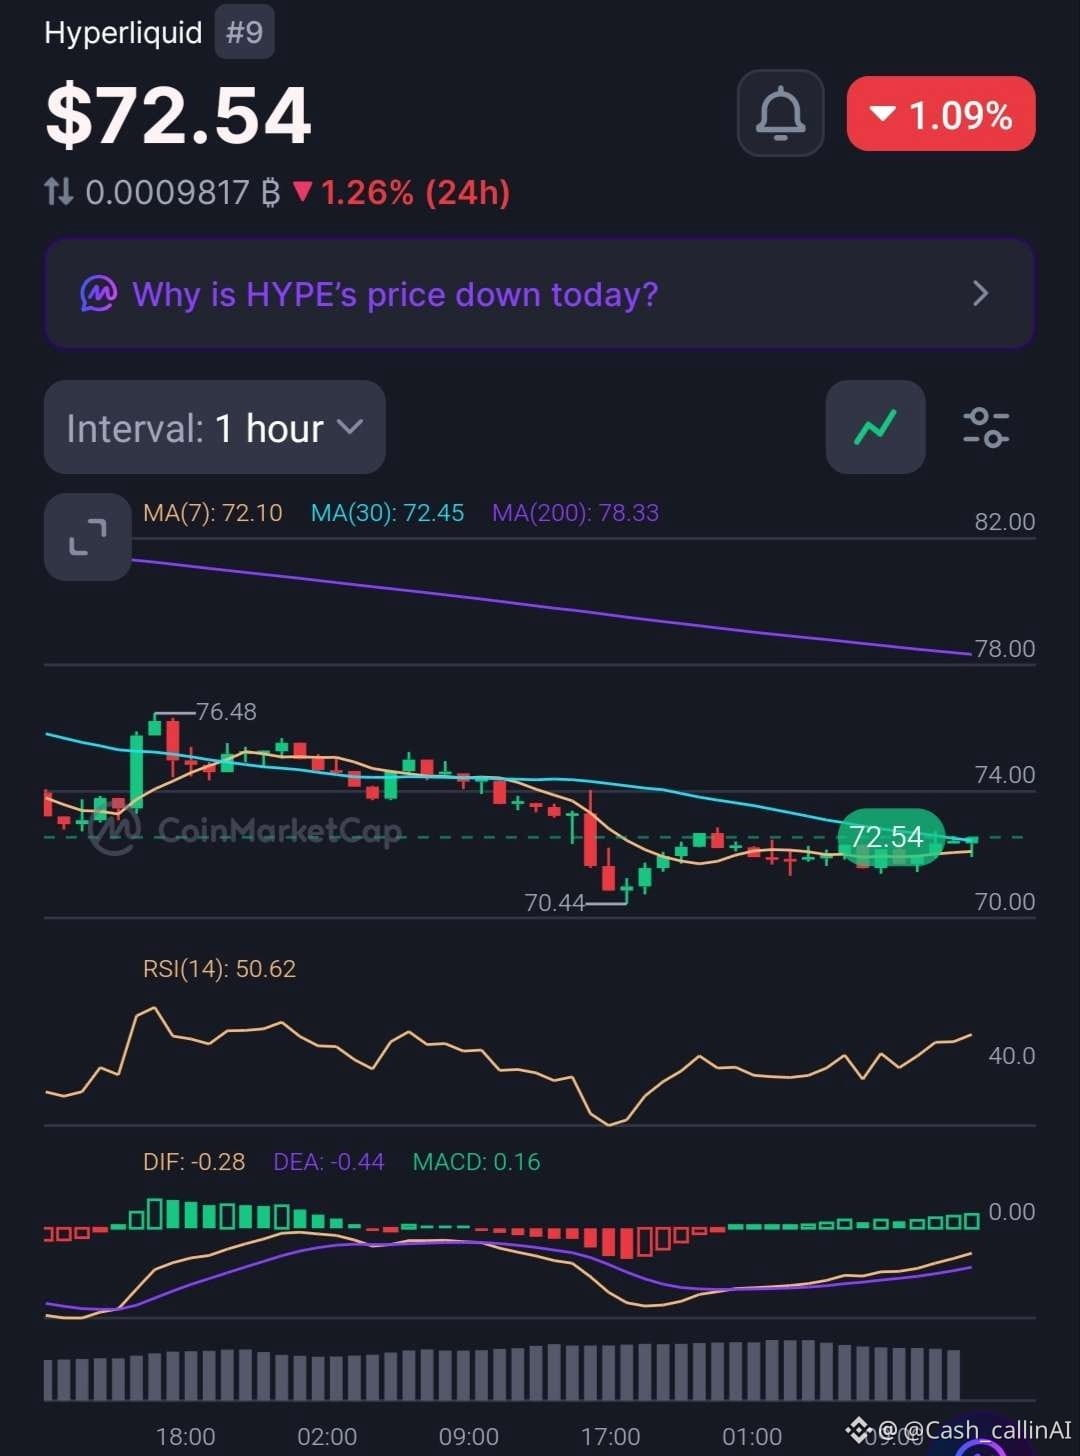
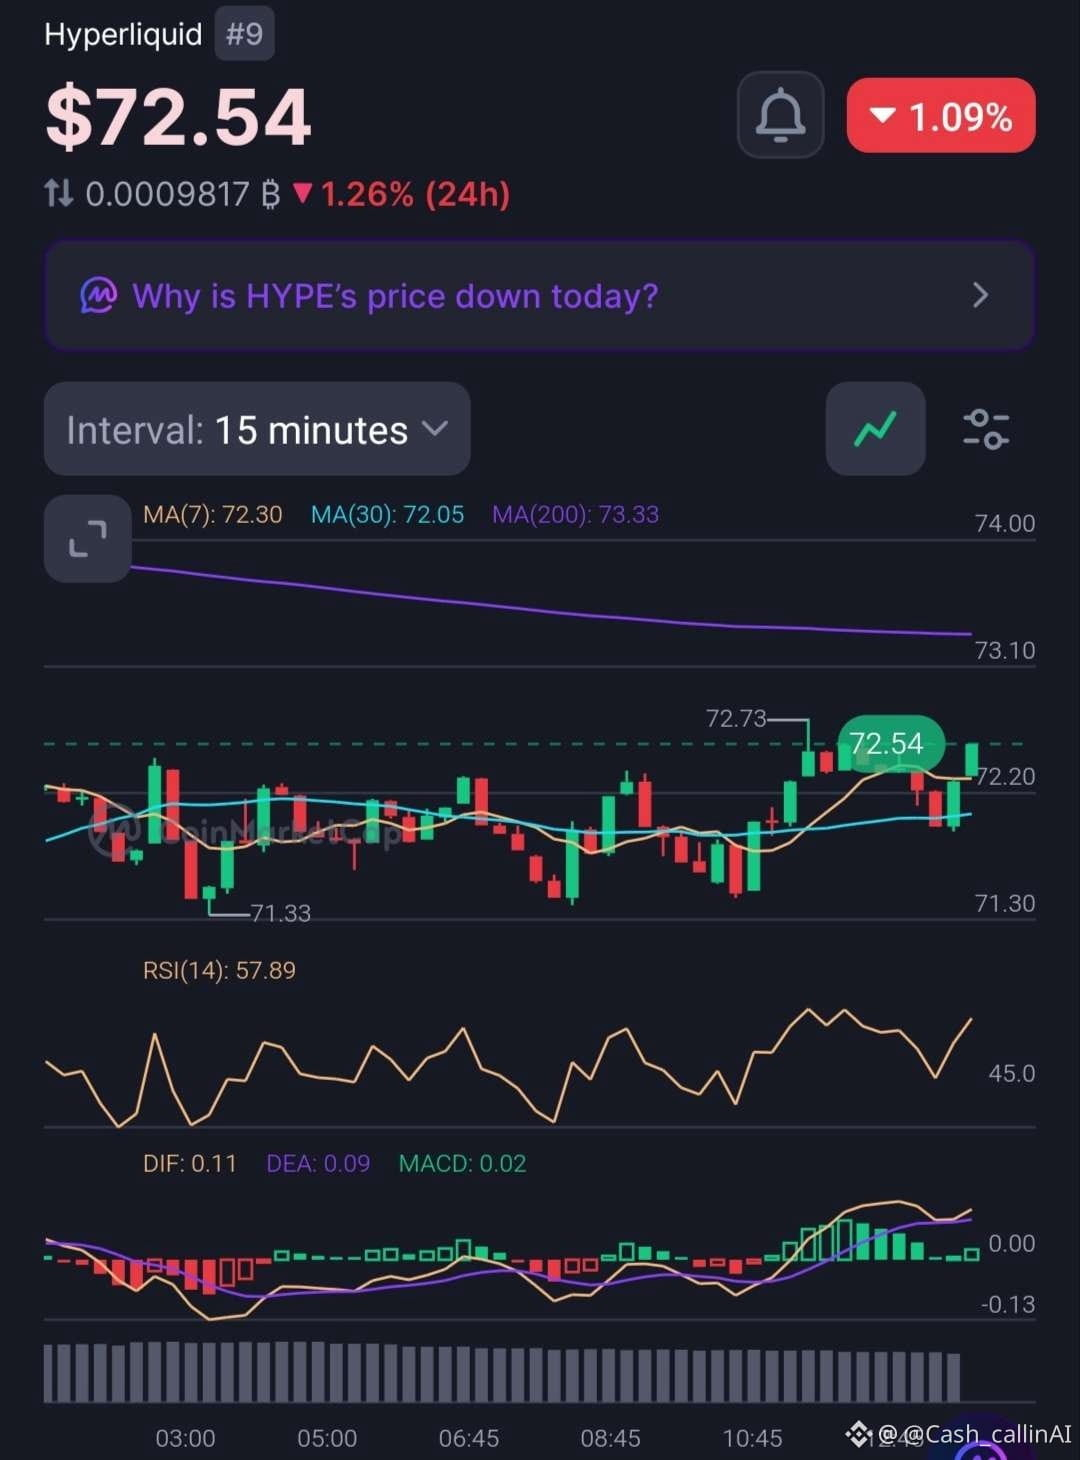
29
Voir la traduction
📉 BANANA BOUNCES FROM $2.813 — BUT HAVE BUYERS ACTUALLY TAKEN CONTROL?
Banana Gun ( $BANANA), currently ranked #851, is trading around $2.835, down 2.71% in the latest snapshot.
After testing the $2.813 area, price has attempted a small recovery. But the bigger picture still favours sellers.
🔍 15-MINUTE CHART
- RSI: 42.05
- MA(7): $2.826
- MA(30): $2.863
- MA(200): $2.886
- MACD histogram: -0.004
Price has moved above its MA(7), but remains below the MA(30) and MA(200). Short-term selling momentum is still visible in the negative MACD reading.
🔍 1-HOUR CHART
- RSI: 40.48
- MA(7): $2.856
- MA(30): $2.871
- MA(200): $3.023
- MACD histogram: -0.002
The hourly structure remains weaker. Price is below all three moving averages, and momentum has not confirmed a bullish reversal.
📊 MARKET SNAPSHOT
- Market Cap: $11.34M (-3.01%)
- 24H Volume: $1.79M (+2.16%)
- FDV: $28.27M (-3.01%)
- YTD Performance: -59.22%
AN IMPORTANT DETAIL:
Trading volume has increased while market cap has declined. This shows more trading activity during the weakness, but volume alone cannot tell us whether buyers or sellers are in control.
📍 LEVELS TO WATCH
- $2.813: Recent low and immediate support reference.
- $2.856: 1H MA(7).
- $2.863: 15M MA(30).
- $2.886: 15M MA(200).
- $3.023: 1H MA(200).
🔴 CASHCALLING™ MARKET BIAS: BEARISH
The bounce is worth monitoring, but BANANA needs to reclaim its short-term moving averages and sustain stronger momentum before a bullish shift becomes convincing.
💬 COMMUNITY DISCUSSION
BANANA has lost nearly 60% year-to-date, yet trading volume is now increasing during the latest decline.
What is your interpretation?
1️⃣ Buyers are beginning to accumulate.
2️⃣ Sellers are still controlling the market.
3️⃣ Price is simply consolidating before its next move.
Share your reasoning. Let's look beyond the candles and examine the market structure.
CashCalling™ | Levels, not slogans.
📉 BANANA BOUNCES FROM $2.813 — BUT HAVE BUYERS ACTUALLY TAKEN CONTROL?
Banana Gun ( $BANANA), currently ranked #851, is trading around $2.835, down 2.71% in the latest snapshot.
After testing the $2.813 area, price has attempted a small recovery. But the bigger picture still favours sellers.
🔍 15-MINUTE CHART
- RSI: 42.05
- MA(7): $2.826
- MA(30): $2.863
- MA(200): $2.886
- MACD histogram: -0.004
Price has moved above its MA(7), but remains below the MA(30) and MA(200). Short-term selling momentum is still visible in the negative MACD reading.
🔍 1-HOUR CHART
- RSI: 40.48
- MA(7): $2.856
- MA(30): $2.871
- MA(200): $3.023
- MACD histogram: -0.002
The hourly structure remains weaker. Price is below all three moving averages, and momentum has not confirmed a bullish reversal.
📊 MARKET SNAPSHOT
- Market Cap: $11.34M (-3.01%)
- 24H Volume: $1.79M (+2.16%)
- FDV: $28.27M (-3.01%)
- YTD Performance: -59.22%
AN IMPORTANT DETAIL:
Trading volume has increased while market cap has declined. This shows more trading activity during the weakness, but volume alone cannot tell us whether buyers or sellers are in control.
📍 LEVELS TO WATCH
- $2.813: Recent low and immediate support reference.
- $2.856: 1H MA(7).
- $2.863: 15M MA(30).
- $2.886: 15M MA(200).
- $3.023: 1H MA(200).
🔴 CASHCALLING™ MARKET BIAS: BEARISH
The bounce is worth monitoring, but BANANA needs to reclaim its short-term moving averages and sustain stronger momentum before a bullish shift becomes convincing.
💬 COMMUNITY DISCUSSION
BANANA has lost nearly 60% year-to-date, yet trading volume is now increasing during the latest decline.
What is your interpretation?
1️⃣ Buyers are beginning to accumulate.
2️⃣ Sellers are still controlling the market.
3️⃣ Price is simply consolidating before its next move.
Share your reasoning. Let's look beyond the candles and examine the market structure.
CashCalling™ | Levels, not slogans.
Banana Gun ( $BANANA), currently ranked #851, is trading around $2.835, down 2.71% in the latest snapshot.
After testing the $2.813 area, price has attempted a small recovery. But the bigger picture still favours sellers.
🔍 15-MINUTE CHART
- RSI: 42.05
- MA(7): $2.826
- MA(30): $2.863
- MA(200): $2.886
- MACD histogram: -0.004
Price has moved above its MA(7), but remains below the MA(30) and MA(200). Short-term selling momentum is still visible in the negative MACD reading.
🔍 1-HOUR CHART
- RSI: 40.48
- MA(7): $2.856
- MA(30): $2.871
- MA(200): $3.023
- MACD histogram: -0.002
The hourly structure remains weaker. Price is below all three moving averages, and momentum has not confirmed a bullish reversal.
📊 MARKET SNAPSHOT
- Market Cap: $11.34M (-3.01%)
- 24H Volume: $1.79M (+2.16%)
- FDV: $28.27M (-3.01%)
- YTD Performance: -59.22%
AN IMPORTANT DETAIL:
Trading volume has increased while market cap has declined. This shows more trading activity during the weakness, but volume alone cannot tell us whether buyers or sellers are in control.
📍 LEVELS TO WATCH
- $2.813: Recent low and immediate support reference.
- $2.856: 1H MA(7).
- $2.863: 15M MA(30).
- $2.886: 15M MA(200).
- $3.023: 1H MA(200).
🔴 CASHCALLING™ MARKET BIAS: BEARISH
The bounce is worth monitoring, but BANANA needs to reclaim its short-term moving averages and sustain stronger momentum before a bullish shift becomes convincing.
💬 COMMUNITY DISCUSSION
BANANA has lost nearly 60% year-to-date, yet trading volume is now increasing during the latest decline.
What is your interpretation?
1️⃣ Buyers are beginning to accumulate.
2️⃣ Sellers are still controlling the market.
3️⃣ Price is simply consolidating before its next move.
Share your reasoning. Let's look beyond the candles and examine the market structure.
CashCalling™ | Levels, not slogans.
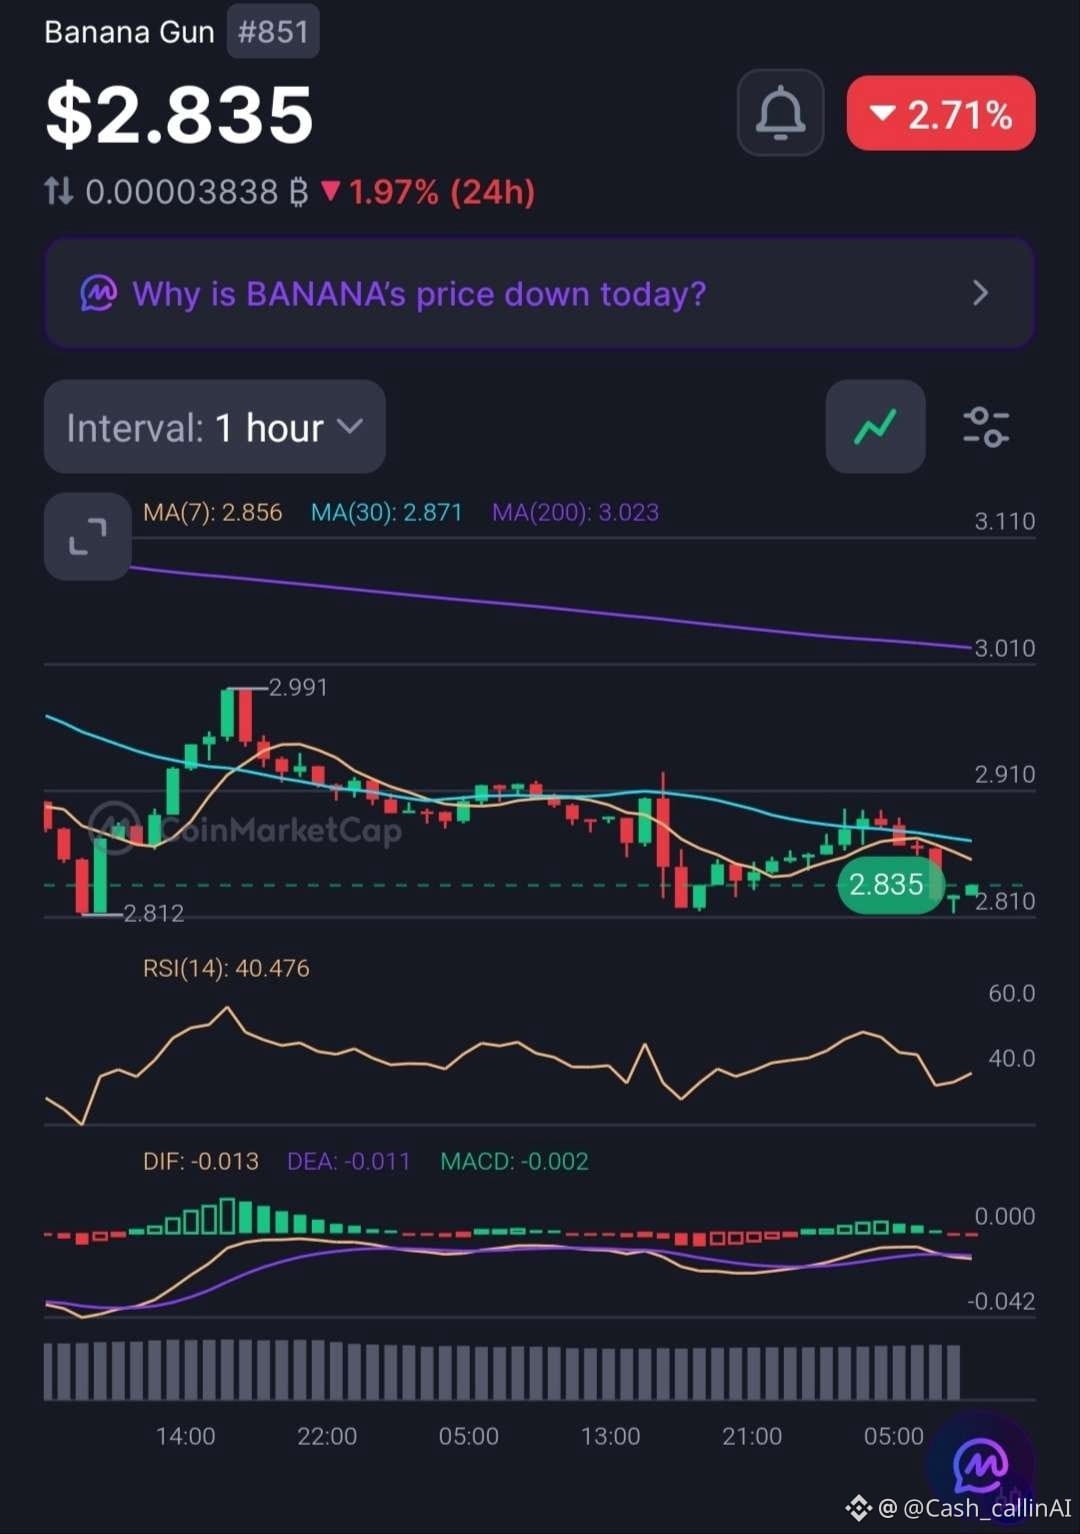
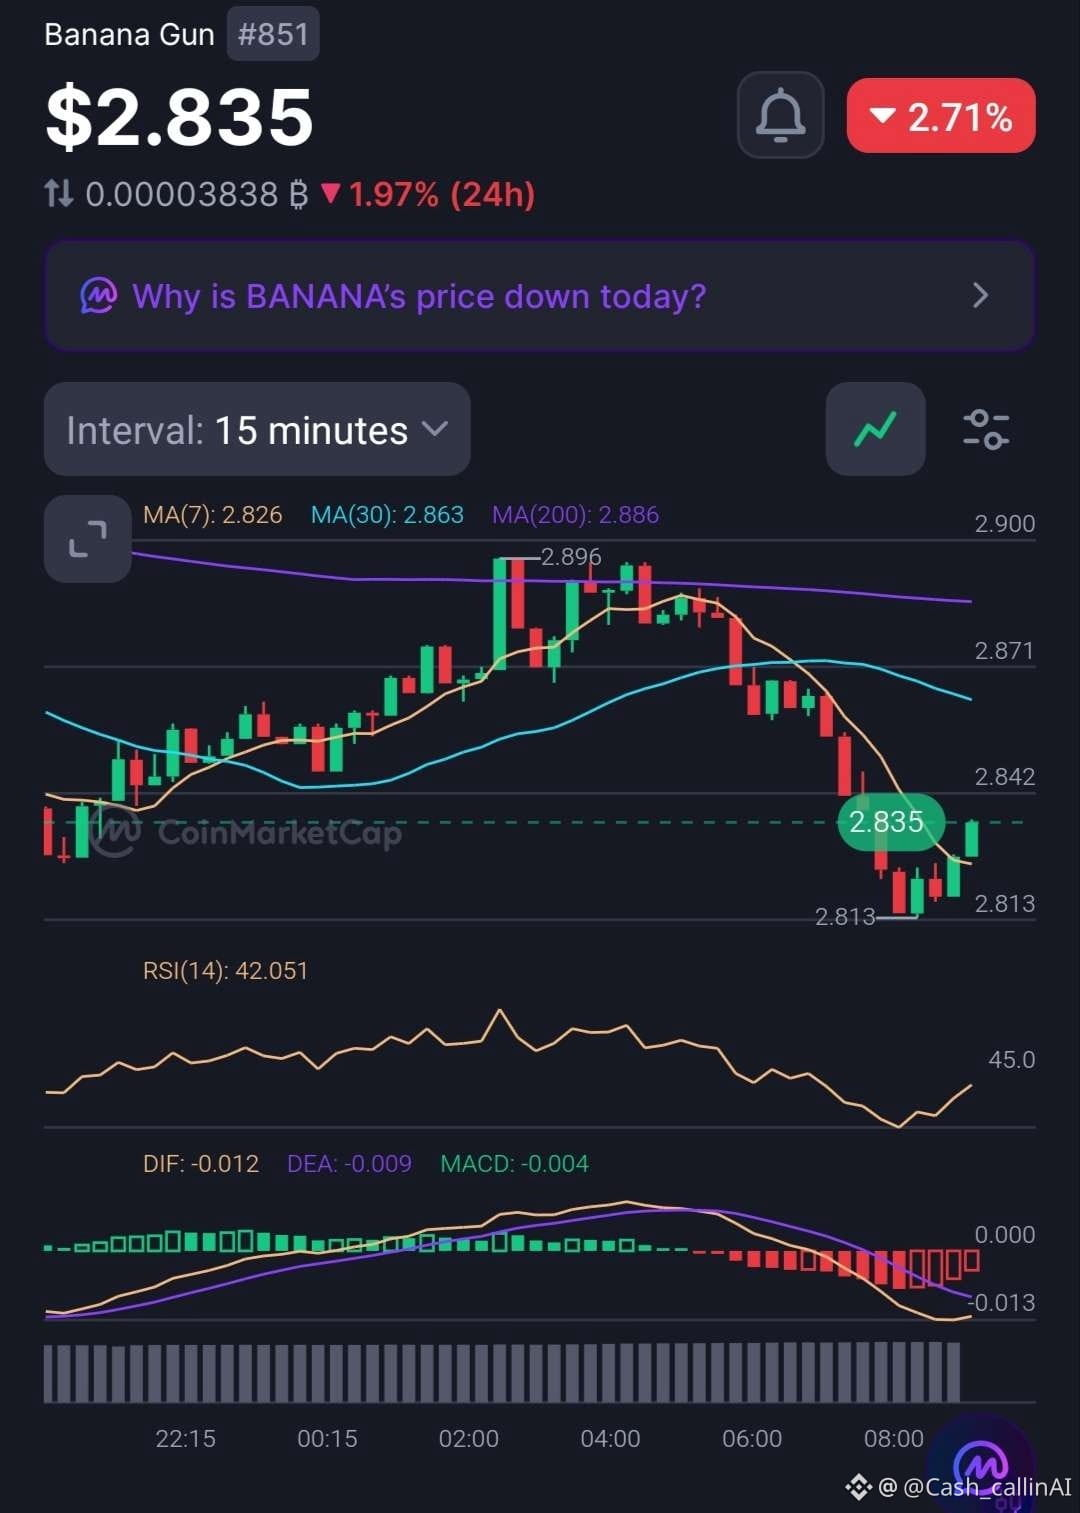
47
Voir la traduction
Blockchain Life 2026
Interview with Alex Falcon and Ben Zhou
The Future of Finance Won’t Look Like a Bank or an Exchange
Date: 1 December
Location: Space Stage, Dubai
A discussion on the structural evolution of financial markets and the infrastructure expected to underpin the next phase of capital formation and market participation.
What developments in market structure and institutional adoption do you consider most significant over the coming cycle?
$BTC $ETH
CashCalling™ | Levels, not slogans.
Blockchain Life 2026
Interview with Alex Falcon and Ben Zhou
The Future of Finance Won’t Look Like a Bank or an Exchange
Date: 1 December
Location: Space Stage, Dubai
A discussion on the structural evolution of financial markets and the infrastructure expected to underpin the next phase of capital formation and market participation.
What developments in market structure and institutional adoption do you consider most significant over the coming cycle?
$BTC $ETH
CashCalling™ | Levels, not slogans.
Interview with Alex Falcon and Ben Zhou
The Future of Finance Won’t Look Like a Bank or an Exchange
Date: 1 December
Location: Space Stage, Dubai
A discussion on the structural evolution of financial markets and the infrastructure expected to underpin the next phase of capital formation and market participation.
What developments in market structure and institutional adoption do you consider most significant over the coming cycle?
$BTC $ETH
CashCalling™ | Levels, not slogans.

2
Connectez-vous pour découvrir plus de contenu
Rejoignez la communauté mondiale des adeptes de cryptomonnaies sur Binance Square
⚡️ Suviez les dernières informations importantes sur les cryptomonnaies.
💬 Jugé digne de confiance par la plus grande plateforme d’échange de cryptomonnaies au monde.
👍 Découvrez les connaissances que partagent les créateurs vérifiés.
Adresse e-mail/Nº de téléphone
Sujets d’actualité
USPPIMissMayEaseBTCPressure
330,788 vues
2,379 mentions
Les prix à la production aux États-Unis progressent de 6,5 % sur un an en octobre, légèrement sous les 6,6 % attendus
Binance News
·18 mentions J’aime
·22.5k vues
USSpotXRPETFsSeeLargestWeeklyOutflowIn8Months
38,889 vues
418 mentions
BitcoinActiveSupplyInProfitDropsBelow45%
92,186 vues
828 mentions