

TEKT0NIC 1
1.4k Publications

TEKT0NIC 1
Signaler
Bloquer l’utilisateur
Passionate about crypto and blockchain | Crypto Enthusiastic | Technical Analysis | Fundamental News
0 Suivis
10 Abonnés
39 J’aime
Publications
·
--
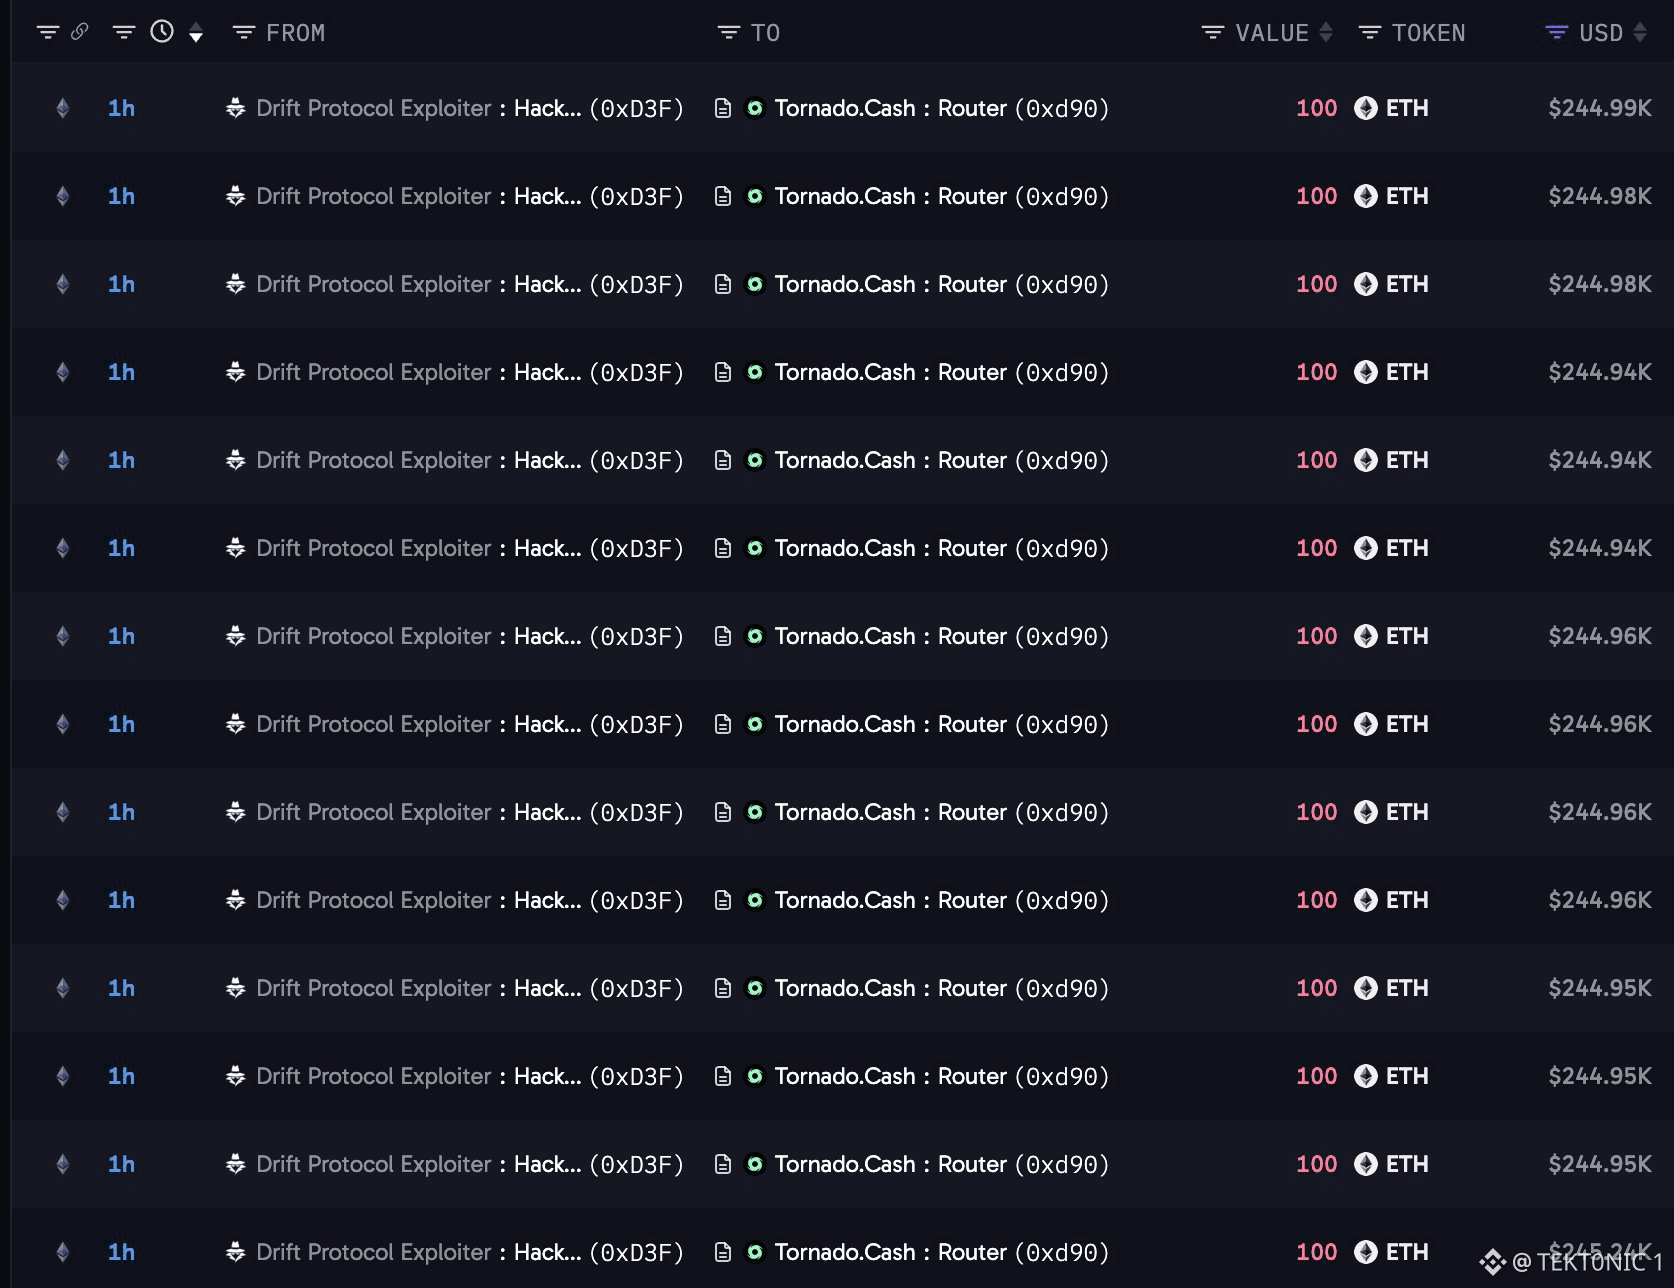
L’auteur de l’exploit visant Drift Protocol a déposé 24 885 $ETH supplémentaires, d’une valeur d’environ 61,3 millions de dollars, sur Tornado Cash. Les fonds ont été envoyés par lots répétés de 100 ETH. Lookonchain a suivi les dépôts et indiqué que les mêmes adresses détiennent toujours 56 569 ETH, évalués à environ 139,3 millions de dollars. Ces dépôts font suite à une première série de dépôts sur Tornado Cash en juillet. En avril, l’exploit initial avait siphonné plus de 270 millions de dollars de Drift Protocol, sur Solana. La plupart des actifs ont ensuite été échangés et transférés vers Ethereum. La société de cybersécurité Mandiant a attribué l’attaque à un groupe lié à la Corée du Nord. Les dépôts sur Tornado Cash rompent le lien direct entre l’adresse d’envoi et tout retrait ultérieur. Les 56 569 $ETH restants n’ont pas encore été transférés via le mélangeur. Drift a ouvert un fonds de récupération début octobre, mais les premières indemnisations ne représentaient qu’environ un centime par dollar de pertes vérifiées. Les derniers dépôts montrent que l’auteur de l’exploit continue de déplacer activement les fonds. Pour l’instant, le solde le plus important reste en dehors du mélangeur. La question de savoir si une plus grande partie des ETH restants empruntera la même voie déterminera quelle quantité restera traçable. #Analyse du prix du BTC# #Prévision du prix du Bitcoin : quel sera le prochain mouvement du Bitcoin ?# #Ethereum $BTC
L’auteur de l’exploit visant Drift Protocol a déposé 24 885 $ETH supplémentaires, d’une valeur d’environ 61,3 millions de dollars, sur Tornado Cash. Les fonds ont été envoyés par lots répétés de 100 ETH. Lookonchain a suivi les dépôts et indiqué que les mêmes adresses détiennent toujours 56 569 ETH, évalués à environ 139,3 millions de dollars. Ces dépôts font suite à une première série de dépôts sur Tornado Cash en juillet. En avril, l’exploit initial avait siphonné plus de 270 millions de dollars de Drift Protocol, sur Solana. La plupart des actifs ont ensuite été échangés et transférés vers Ethereum. La société de cybersécurité Mandiant a attribué l’attaque à un groupe lié à la Corée du Nord. Les dépôts sur Tornado Cash rompent le lien direct entre l’adresse d’envoi et tout retrait ultérieur. Les 56 569 $ETH restants n’ont pas encore été transférés via le mélangeur. Drift a ouvert un fonds de récupération début octobre, mais les premières indemnisations ne représentaient qu’environ un centime par dollar de pertes vérifiées. Les derniers dépôts montrent que l’auteur de l’exploit continue de déplacer activement les fonds. Pour l’instant, le solde le plus important reste en dehors du mélangeur. La question de savoir si une plus grande partie des ETH restants empruntera la même voie déterminera quelle quantité restera traçable. #Analyse du prix du BTC# #Prévision du prix du Bitcoin : quel sera le prochain mouvement du Bitcoin ?# #Ethereum $BTC
·
--
L’adoption des RWA s’étend au-delà des bons du Trésor tokenisés. Le marché des actifs du monde réel tokenisés a atteint 39,3 Md$, mais la demande provient de différents segments du marché. Bons du Trésor : avec 14,7 Md$, soit 37 % du marché, ils restent le segment le plus important. Matières premières : la valeur tokenisée a été multipliée par 2,6 cette année, pour atteindre environ 8 Md$, principalement grâce aux actifs adossés à l’or. Contrats perpétuels : le volume de trading des RWA a plus que doublé au T3, atteignant 2,57 billions de dollars, les traders ayant désormais davantage accès aux actions et aux matières premières. Actions tokenisées : elles ne représentent que 8 % de la valeur des actifs, mais sont à l’origine de 93 % du volume spot on-chain. Ce dernier chiffre mérite d’être suivi. Il laisse penser que les actions tokenisées attirent une activité de trading bien supérieure à leur part du marché total. La croissance des RWA ne consiste plus seulement à transférer des actifs traditionnels sur la blockchain. Il s’agit de la façon dont les gens les négocient, les détiennent et les utilisent sur les marchés crypto. #Analyse du prix du BTC# #Perspectives macroéconomiques# #RWA $BTC $PUMP
L’adoption des RWA s’étend au-delà des bons du Trésor tokenisés. Le marché des actifs du monde réel tokenisés a atteint 39,3 Md$, mais la demande provient de différents segments du marché. Bons du Trésor : avec 14,7 Md$, soit 37 % du marché, ils restent le segment le plus important. Matières premières : la valeur tokenisée a été multipliée par 2,6 cette année, pour atteindre environ 8 Md$, principalement grâce aux actifs adossés à l’or. Contrats perpétuels : le volume de trading des RWA a plus que doublé au T3, atteignant 2,57 billions de dollars, les traders ayant désormais davantage accès aux actions et aux matières premières. Actions tokenisées : elles ne représentent que 8 % de la valeur des actifs, mais sont à l’origine de 93 % du volume spot on-chain. Ce dernier chiffre mérite d’être suivi. Il laisse penser que les actions tokenisées attirent une activité de trading bien supérieure à leur part du marché total. La croissance des RWA ne consiste plus seulement à transférer des actifs traditionnels sur la blockchain. Il s’agit de la façon dont les gens les négocient, les détiennent et les utilisent sur les marchés crypto. #Analyse du prix du BTC# #Perspectives macroéconomiques# #RWA $BTC $PUMP
29
·
--
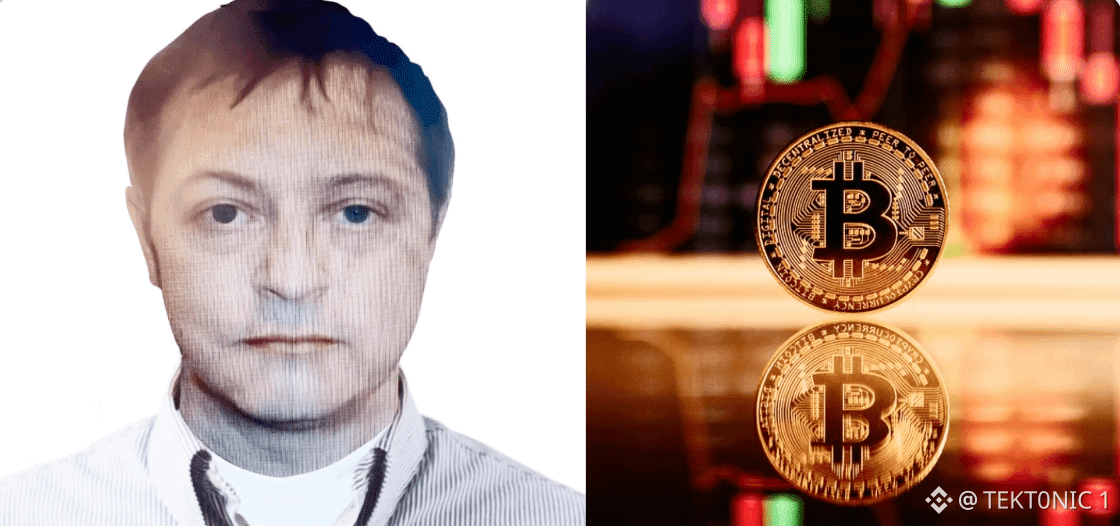
Un portefeuille Bitcoin lié au trafiquant de drogue irlandais condamné Clifton Collins a transféré 500 $BTC vers Coinbase Prime après être resté inactif pendant près d’une décennie. Lookonchain a évalué le transfert à 41,52 millions de dollars. L’adresse expéditrice était inactive depuis plus de dix ans. Il s’agit du cinquième transfert de 500 BTC provenant de portefeuilles liés à Collins en 2026, portant le total transféré cette année à 2 500 BTC. Ce dernier lot constitue le troisième transfert consécutif vers la même adresse de dépôt Coinbase Prime. Collins aurait accumulé environ 6 000 BTC en 2011 et 2012, puis réparti les bitcoins dans 12 portefeuilles contenant chacun 500 BTC. On pensait que l’accès était perdu après la disparition de clés privées imprimées, à la suite de son arrestation en 2017. Les autorités irlandaises, avec l’aide d’Europol, ont déjà saisi plusieurs lots de 500 BTC cette année. Le transfert montre que les bitcoins ont été envoyés vers Coinbase Prime. Il ne confirme ni une vente ni l’identité de la personne ayant autorisé le mouvement. Environ 3 500 $BTC restent dans les autres adresses liées au stock d’origine. La série de transferts répétés de 500 BTC s’est poursuivie tout au long de l’année. #Analyse du cours du BTC# #Prévision du cours du Bitcoin : quel sera le prochain mouvement du Bitcoin ?# $ZEC
Un portefeuille Bitcoin lié au trafiquant de drogue irlandais condamné Clifton Collins a transféré 500 $BTC vers Coinbase Prime après être resté inactif pendant près d’une décennie. Lookonchain a évalué le transfert à 41,52 millions de dollars. L’adresse expéditrice était inactive depuis plus de dix ans. Il s’agit du cinquième transfert de 500 BTC provenant de portefeuilles liés à Collins en 2026, portant le total transféré cette année à 2 500 BTC. Ce dernier lot constitue le troisième transfert consécutif vers la même adresse de dépôt Coinbase Prime. Collins aurait accumulé environ 6 000 BTC en 2011 et 2012, puis réparti les bitcoins dans 12 portefeuilles contenant chacun 500 BTC. On pensait que l’accès était perdu après la disparition de clés privées imprimées, à la suite de son arrestation en 2017. Les autorités irlandaises, avec l’aide d’Europol, ont déjà saisi plusieurs lots de 500 BTC cette année. Le transfert montre que les bitcoins ont été envoyés vers Coinbase Prime. Il ne confirme ni une vente ni l’identité de la personne ayant autorisé le mouvement. Environ 3 500 $BTC restent dans les autres adresses liées au stock d’origine. La série de transferts répétés de 500 BTC s’est poursuivie tout au long de l’année. #Analyse du cours du BTC# #Prévision du cours du Bitcoin : quel sera le prochain mouvement du Bitcoin ?# $ZEC
29
·
--
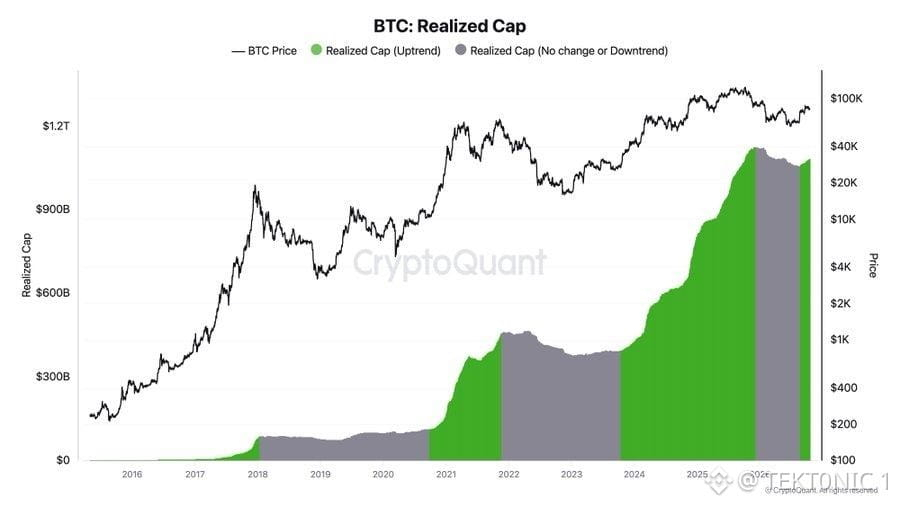
De nouveaux capitaux affluent vers Bitcoin, selon Ki Young Ju, PDG de CryptoQuant. Le graphique de CryptoQuant suit la capitalisation réalisée, qui évalue chaque pièce au prix auquel elle a été déplacée pour la dernière fois sur la chaîne. Les segments verts indiquent les périodes où la capitalisation réalisée augmente. La période la plus récente est en vert, et la courbe est remontée vers 1 100 milliards de dollars, tandis que $BTC s’échange autour de 83 000 $. La capitalisation réalisée augmente lorsque des pièces changent de mains à des prix plus élevés. Cela signifie que de nouveaux capitaux entrent sur le marché à des niveaux supérieurs au coût de revient moyen précédent. Ju souligne que cette tendance s’est historiquement manifestée lors des marchés haussiers plutôt que pendant les longues phases baissières. Cet indicateur ne montre ni le montant des entrées quotidiennes ni si les achats proviennent des ETF, des trésoreries d’entreprise ou d’autres détenteurs. Il indique uniquement que le coût de revient global du réseau augmente. Le prix peut encore reculer alors que la capitalisation réalisée continue de progresser, si les détenteurs actuels vendent à des acheteurs prêts à payer ces prix. La tendance haussière actuelle de la capitalisation réalisée est le signal que Ju met en évidence. Sa poursuite dépendra de l’arrivée de nouveaux capitaux à des prix plus élevés. Le graphique montre la hausse, mais pas combien de temps elle durera. #Analyse du prix du BTC# #Prévision du prix du Bitcoin : quel sera le prochain mouvement du Bitcoin ?# $BTC $ETH
De nouveaux capitaux affluent vers Bitcoin, selon Ki Young Ju, PDG de CryptoQuant. Le graphique de CryptoQuant suit la capitalisation réalisée, qui évalue chaque pièce au prix auquel elle a été déplacée pour la dernière fois sur la chaîne. Les segments verts indiquent les périodes où la capitalisation réalisée augmente. La période la plus récente est en vert, et la courbe est remontée vers 1 100 milliards de dollars, tandis que $BTC s’échange autour de 83 000 $. La capitalisation réalisée augmente lorsque des pièces changent de mains à des prix plus élevés. Cela signifie que de nouveaux capitaux entrent sur le marché à des niveaux supérieurs au coût de revient moyen précédent. Ju souligne que cette tendance s’est historiquement manifestée lors des marchés haussiers plutôt que pendant les longues phases baissières. Cet indicateur ne montre ni le montant des entrées quotidiennes ni si les achats proviennent des ETF, des trésoreries d’entreprise ou d’autres détenteurs. Il indique uniquement que le coût de revient global du réseau augmente. Le prix peut encore reculer alors que la capitalisation réalisée continue de progresser, si les détenteurs actuels vendent à des acheteurs prêts à payer ces prix. La tendance haussière actuelle de la capitalisation réalisée est le signal que Ju met en évidence. Sa poursuite dépendra de l’arrivée de nouveaux capitaux à des prix plus élevés. Le graphique montre la hausse, mais pas combien de temps elle durera. #Analyse du prix du BTC# #Prévision du prix du Bitcoin : quel sera le prochain mouvement du Bitcoin ?# $BTC $ETH
38
·
--
choses à faire MAINTENANT avant le prochain marché haussier des cryptos : > préservez votre capital : une mauvaise transaction ne devrait pas vous faire sortir du marché. > développez votre réseau : échangez avec des développeurs, des chercheurs et des personnes qui créent de la valeur réelle. > investissez progressivement dans des projets de qualité : établissez un plan au lieu d’acheter aveuglément à chaque baisse. > apprenez à prendre vos bénéfices : ne laissez pas des gains non réalisés se transformer en pertes faute de plan de sortie. > constituez votre liste de suivi : étudiez les projets, leur tokenomics, les déblocages de jetons et l’activité réelle des utilisateurs avant que l’engouement ne commence. > gardez des liquidités disponibles : vous n’avez pas besoin de dépenser chaque dollar simplement parce que les prix baissent. > fixez des objectifs d’entrée et de sortie : sachez ce qui vous inciterait à acheter, vendre ou changer d’avis. > étudiez les récits émergents : comprenez où vont les capitaux et les utilisateurs avant de suivre une tendance. > gérez les risques : la taille des positions, les ordres stop-loss et le fait d’éviter un effet de levier excessif comptent sur tous les marchés. le but n’est pas seulement de profiter du prochain marché haussier. c’est d’y entrer préparé, de protéger votre capital et de savoir quoi faire lorsque le marché bouge. #Analyse du cours de BTC# #Prévision du cours du Bitcoin : quel sera le prochain mouvement du Bitcoin ?# #Saison des altcoins# $BTC $ETH
choses à faire MAINTENANT avant le prochain marché haussier des cryptos : > préservez votre capital : une mauvaise transaction ne devrait pas vous faire sortir du marché. > développez votre réseau : échangez avec des développeurs, des chercheurs et des personnes qui créent de la valeur réelle. > investissez progressivement dans des projets de qualité : établissez un plan au lieu d’acheter aveuglément à chaque baisse. > apprenez à prendre vos bénéfices : ne laissez pas des gains non réalisés se transformer en pertes faute de plan de sortie. > constituez votre liste de suivi : étudiez les projets, leur tokenomics, les déblocages de jetons et l’activité réelle des utilisateurs avant que l’engouement ne commence. > gardez des liquidités disponibles : vous n’avez pas besoin de dépenser chaque dollar simplement parce que les prix baissent. > fixez des objectifs d’entrée et de sortie : sachez ce qui vous inciterait à acheter, vendre ou changer d’avis. > étudiez les récits émergents : comprenez où vont les capitaux et les utilisateurs avant de suivre une tendance. > gérez les risques : la taille des positions, les ordres stop-loss et le fait d’éviter un effet de levier excessif comptent sur tous les marchés. le but n’est pas seulement de profiter du prochain marché haussier. c’est d’y entrer préparé, de protéger votre capital et de savoir quoi faire lorsque le marché bouge. #Analyse du cours de BTC# #Prévision du cours du Bitcoin : quel sera le prochain mouvement du Bitcoin ?# #Saison des altcoins# $BTC $ETH

61
·
--
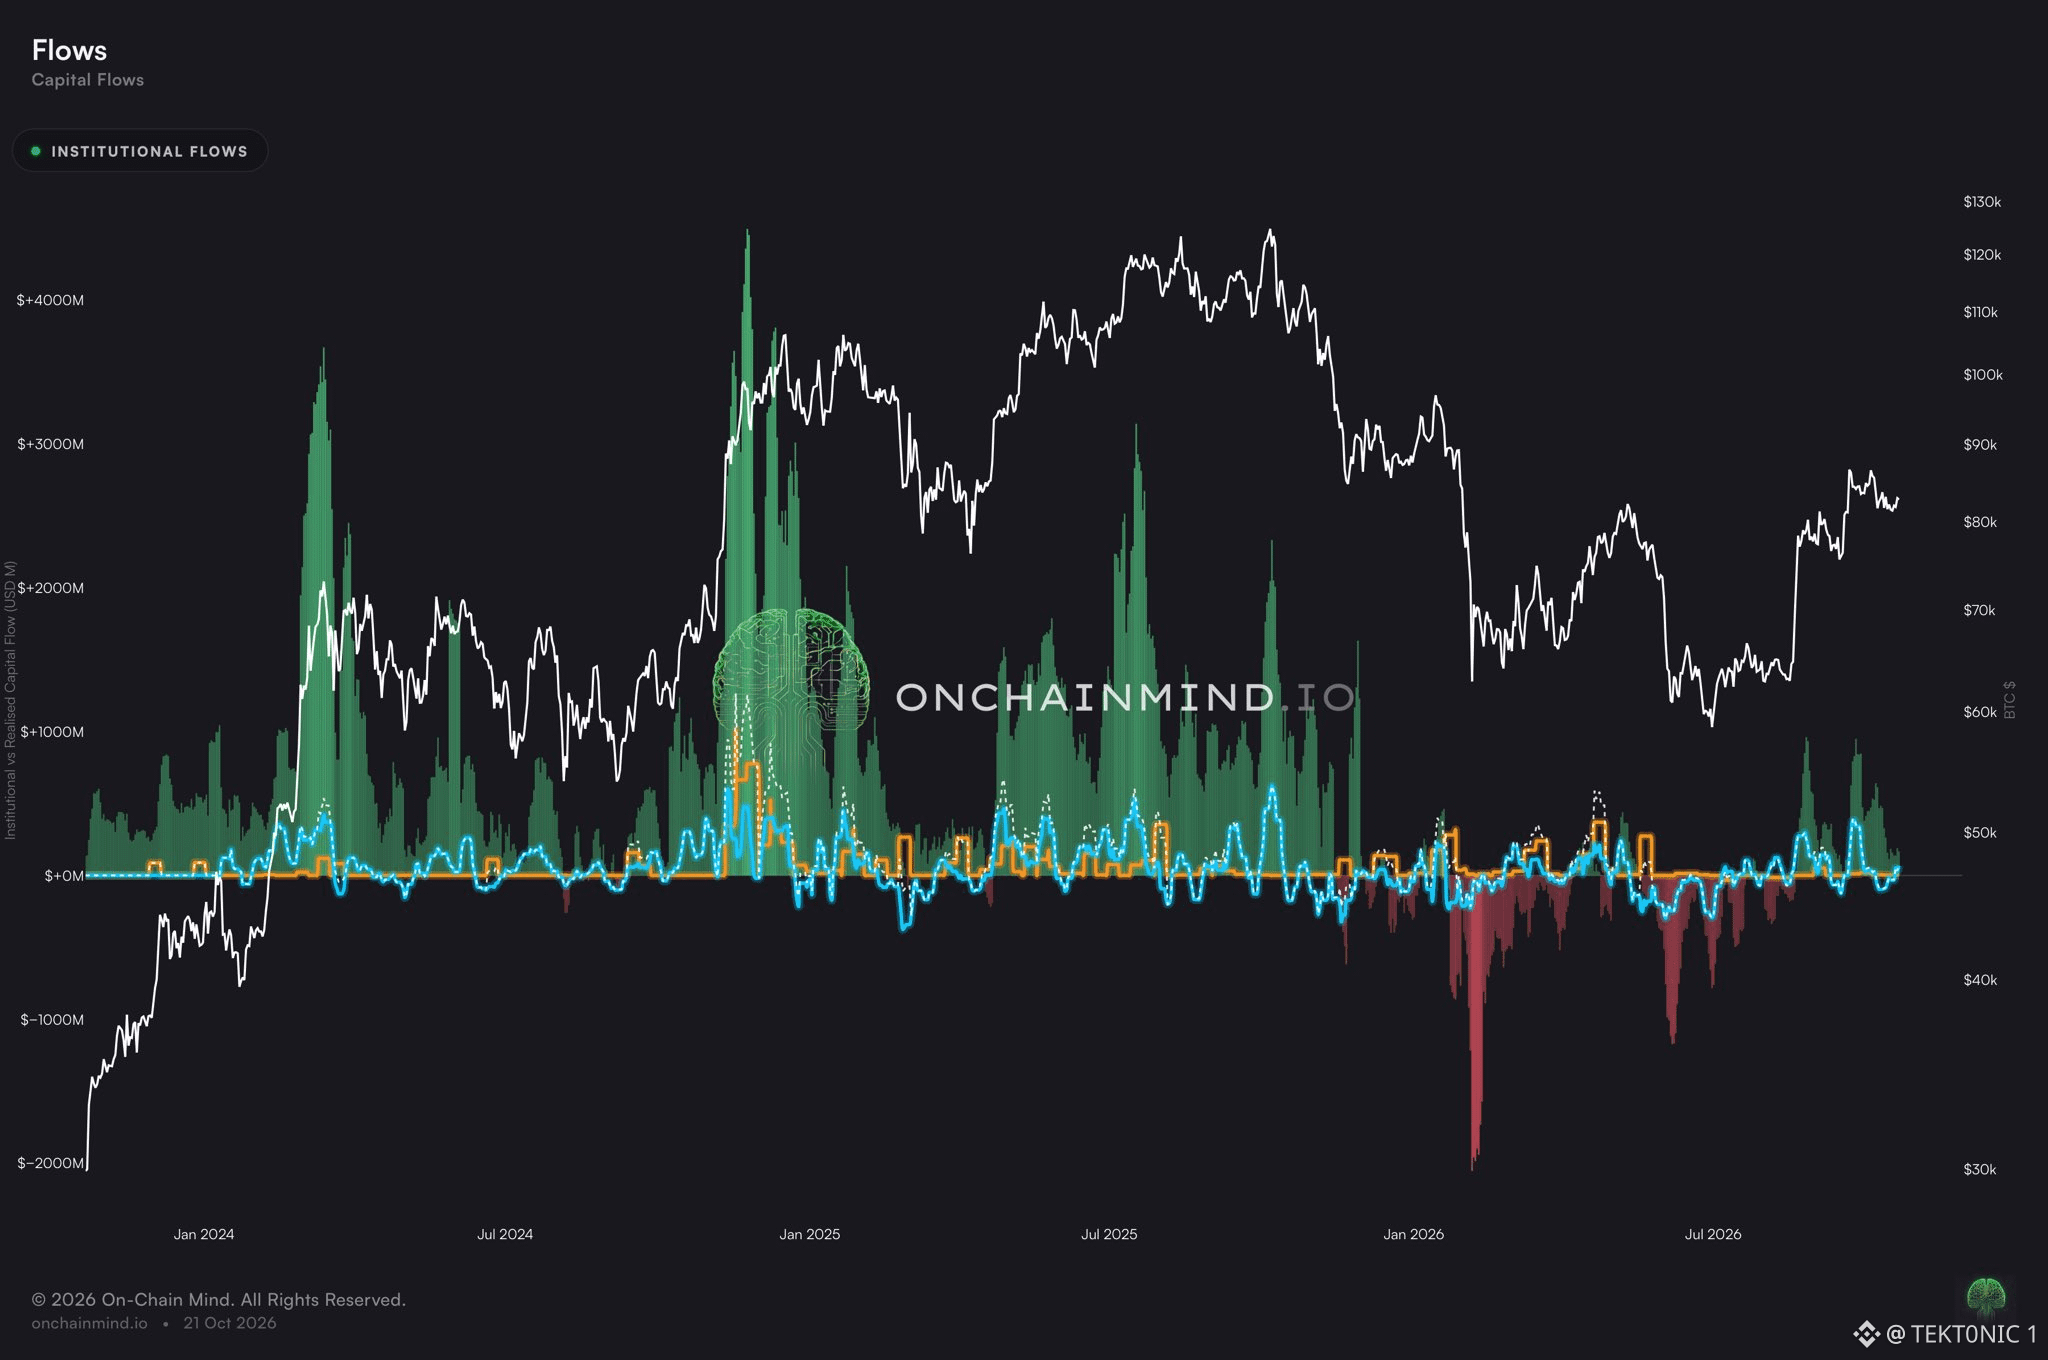
La demande institutionnelle représente désormais 42 % des flux de capitaux en Bitcoin cette semaine. Selon On-Chain Mind, les ETF au comptant ont contribué à hauteur de 68 millions de dollars cette semaine, tandis que la demande organique reste en tête avec 97 millions de dollars. Le graphique montre les flux institutionnels (en vert) comme une part croissante des flux totaux de capitaux réalisés, tandis que la ligne blanche suit le cours du Bitcoin sur la même période. Le chiffre de 42 % correspond à la part des entrées nettes de capitaux de cette semaine passées par des véhicules de la finance traditionnelle, plutôt que par des activités directement on-chain ou sur les plateformes d’échange. La demande organique reste la composante la plus importante, mais la part institutionnelle a progressé par rapport aux périodes précédentes de l’année, où les barres vertes étaient plus petites par rapport au total. Les flux des ETF au comptant correspondent aux créations et aux rachats de parts. Un chiffre positif signifie que des parts ont été créées et que les fonds ont acheté du bitcoin pour les adosser. Cela ne signifie pas qu’une seule société vend des bitcoins détenus dans son propre portefeuille. Les 68 millions de dollars restent modestes par rapport aux 97 millions de dollars de flux organiques, et une semaine ne suffit pas à établir une tendance. Les véhicules de la finance traditionnelle représentent une part plus importante des flux hebdomadaires que lors des périodes précédentes montrées sur ce graphique. La poursuite de cette hausse dépendra de la continuité des entrées dans les ETF et du maintien de la demande organique en tête. La répartition actuelle montre que les deux sources sont actives. #Analyse du cours du BTC# #Prévision du cours du Bitcoin : quel sera le prochain mouvement du Bitcoin ?# $BTC $ETH
La demande institutionnelle représente désormais 42 % des flux de capitaux en Bitcoin cette semaine. Selon On-Chain Mind, les ETF au comptant ont contribué à hauteur de 68 millions de dollars cette semaine, tandis que la demande organique reste en tête avec 97 millions de dollars. Le graphique montre les flux institutionnels (en vert) comme une part croissante des flux totaux de capitaux réalisés, tandis que la ligne blanche suit le cours du Bitcoin sur la même période. Le chiffre de 42 % correspond à la part des entrées nettes de capitaux de cette semaine passées par des véhicules de la finance traditionnelle, plutôt que par des activités directement on-chain ou sur les plateformes d’échange. La demande organique reste la composante la plus importante, mais la part institutionnelle a progressé par rapport aux périodes précédentes de l’année, où les barres vertes étaient plus petites par rapport au total. Les flux des ETF au comptant correspondent aux créations et aux rachats de parts. Un chiffre positif signifie que des parts ont été créées et que les fonds ont acheté du bitcoin pour les adosser. Cela ne signifie pas qu’une seule société vend des bitcoins détenus dans son propre portefeuille. Les 68 millions de dollars restent modestes par rapport aux 97 millions de dollars de flux organiques, et une semaine ne suffit pas à établir une tendance. Les véhicules de la finance traditionnelle représentent une part plus importante des flux hebdomadaires que lors des périodes précédentes montrées sur ce graphique. La poursuite de cette hausse dépendra de la continuité des entrées dans les ETF et du maintien de la demande organique en tête. La répartition actuelle montre que les deux sources sont actives. #Analyse du cours du BTC# #Prévision du cours du Bitcoin : quel sera le prochain mouvement du Bitcoin ?# $BTC $ETH
72
·
--
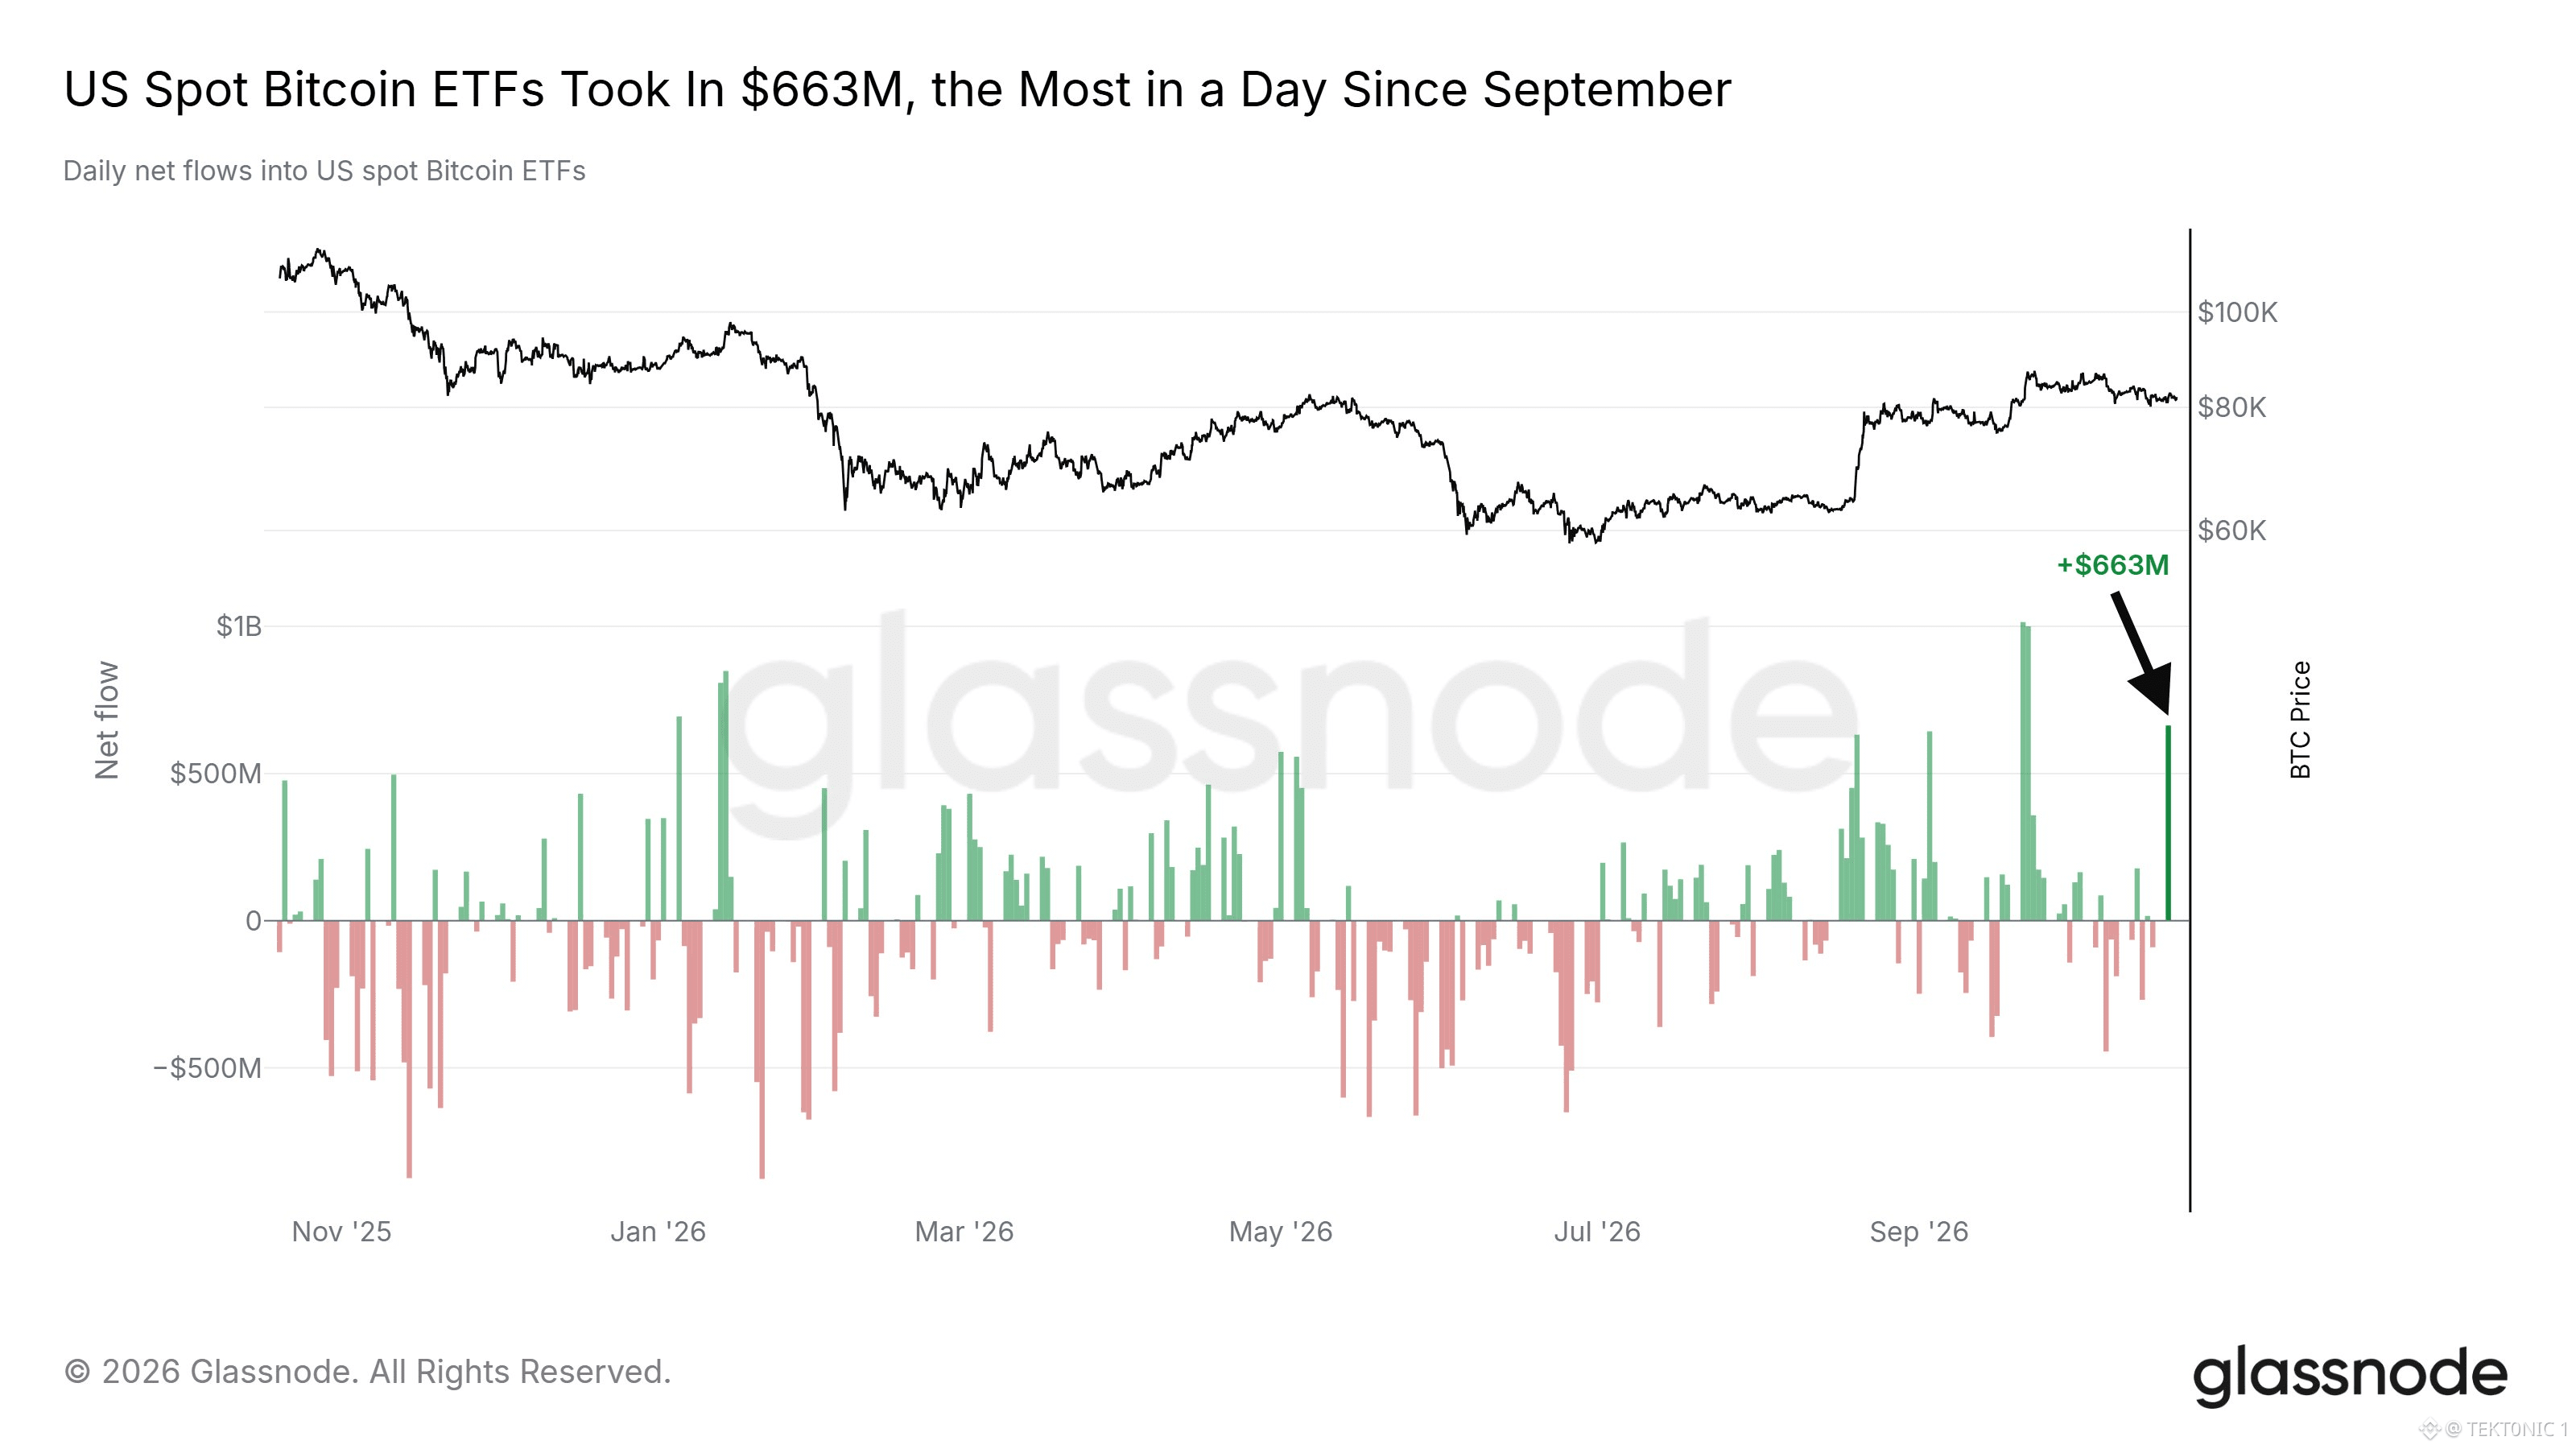
663 M$ d’entrées dans les ETF Bitcoin. La demande institutionnelle se réveille ? 👀 Les ETF Bitcoin au comptant américains ont enregistré leur plus forte entrée nette quotidienne depuis septembre, BlackRock’s IBIT attirant environ 665 M$ le 19 octobre. Mais il faut considérer l’ensemble du tableau : d’autres fonds ont enregistré des sorties, ce qui laisse le marché des ETF dans son ensemble avec 526,6 M$ d’entrées nettes. C’est un net retournement après des semaines de pression vendeuse, mais les flux cumulés des ETF en octobre restent négatifs. Les entrées dans les ETF comptent, car la création de parts peut apporter de nouveaux capitaux à des produits détenant du bitcoin réel, ajoutant ainsi une autre source de demande au comptant. Une journée solide est encourageante. Plusieurs jours consécutifs d’entrées nettes constitueraient un signe plus probant du retour de la demande institutionnelle. #Analyse du cours du BTC# #Prévision du cours du Bitcoin : quel sera le prochain mouvement du Bitcoin ?# #ETF $BTC $ETH
663 M$ d’entrées dans les ETF Bitcoin. La demande institutionnelle se réveille ? 👀 Les ETF Bitcoin au comptant américains ont enregistré leur plus forte entrée nette quotidienne depuis septembre, BlackRock’s IBIT attirant environ 665 M$ le 19 octobre. Mais il faut considérer l’ensemble du tableau : d’autres fonds ont enregistré des sorties, ce qui laisse le marché des ETF dans son ensemble avec 526,6 M$ d’entrées nettes. C’est un net retournement après des semaines de pression vendeuse, mais les flux cumulés des ETF en octobre restent négatifs. Les entrées dans les ETF comptent, car la création de parts peut apporter de nouveaux capitaux à des produits détenant du bitcoin réel, ajoutant ainsi une autre source de demande au comptant. Une journée solide est encourageante. Plusieurs jours consécutifs d’entrées nettes constitueraient un signe plus probant du retour de la demande institutionnelle. #Analyse du cours du BTC# #Prévision du cours du Bitcoin : quel sera le prochain mouvement du Bitcoin ?# #ETF $BTC $ETH
28
·
--
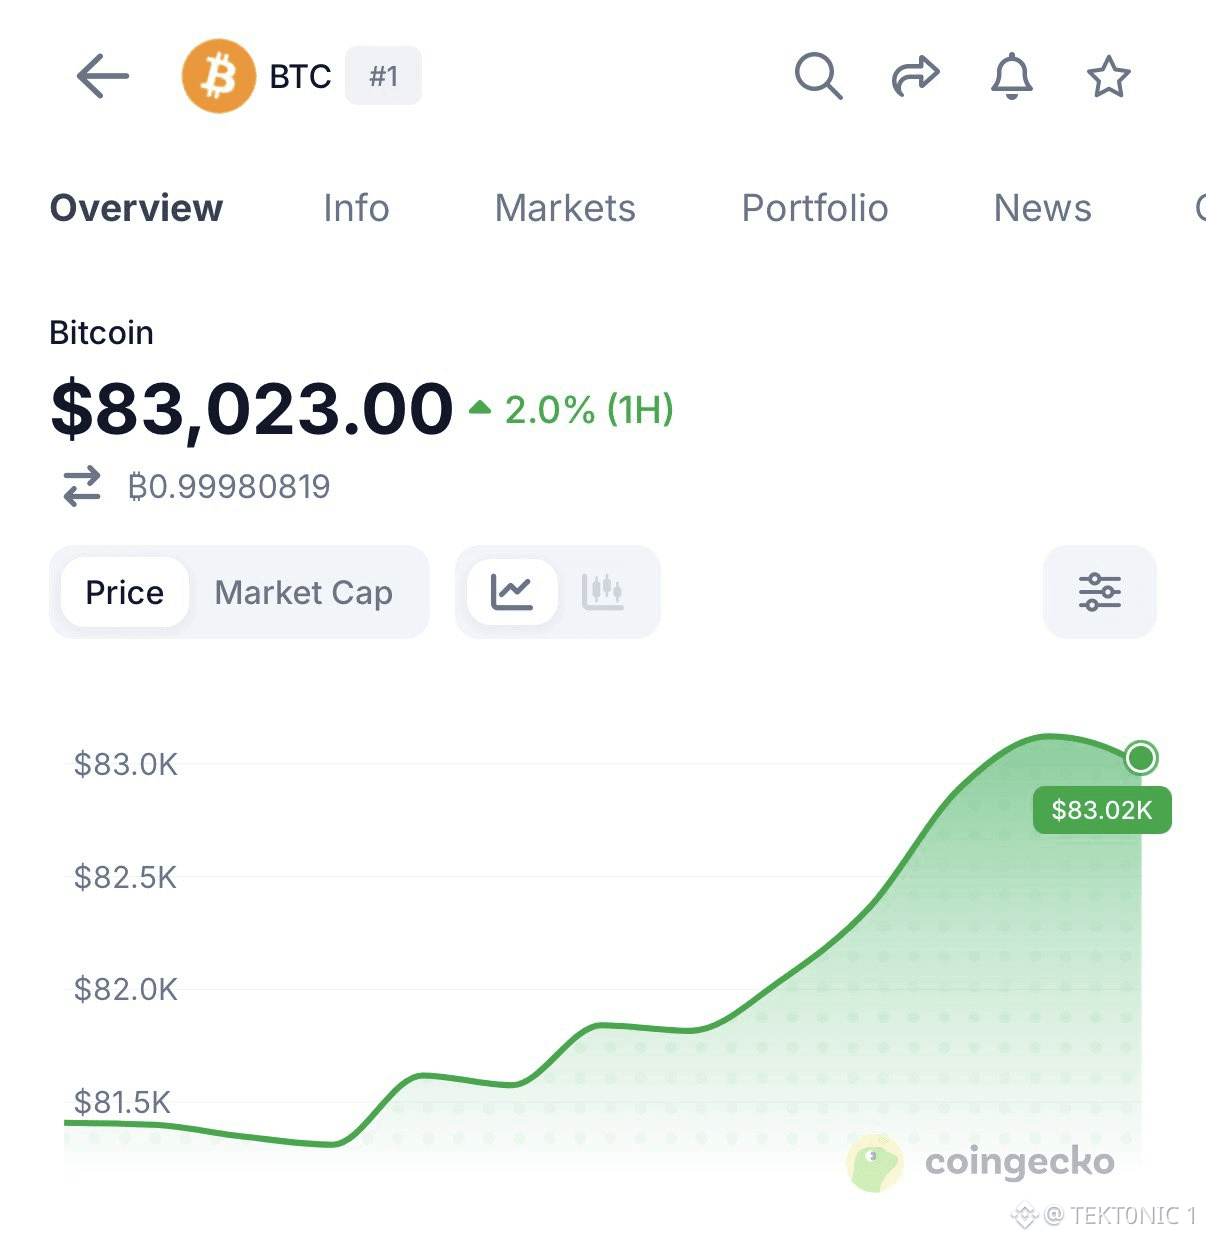
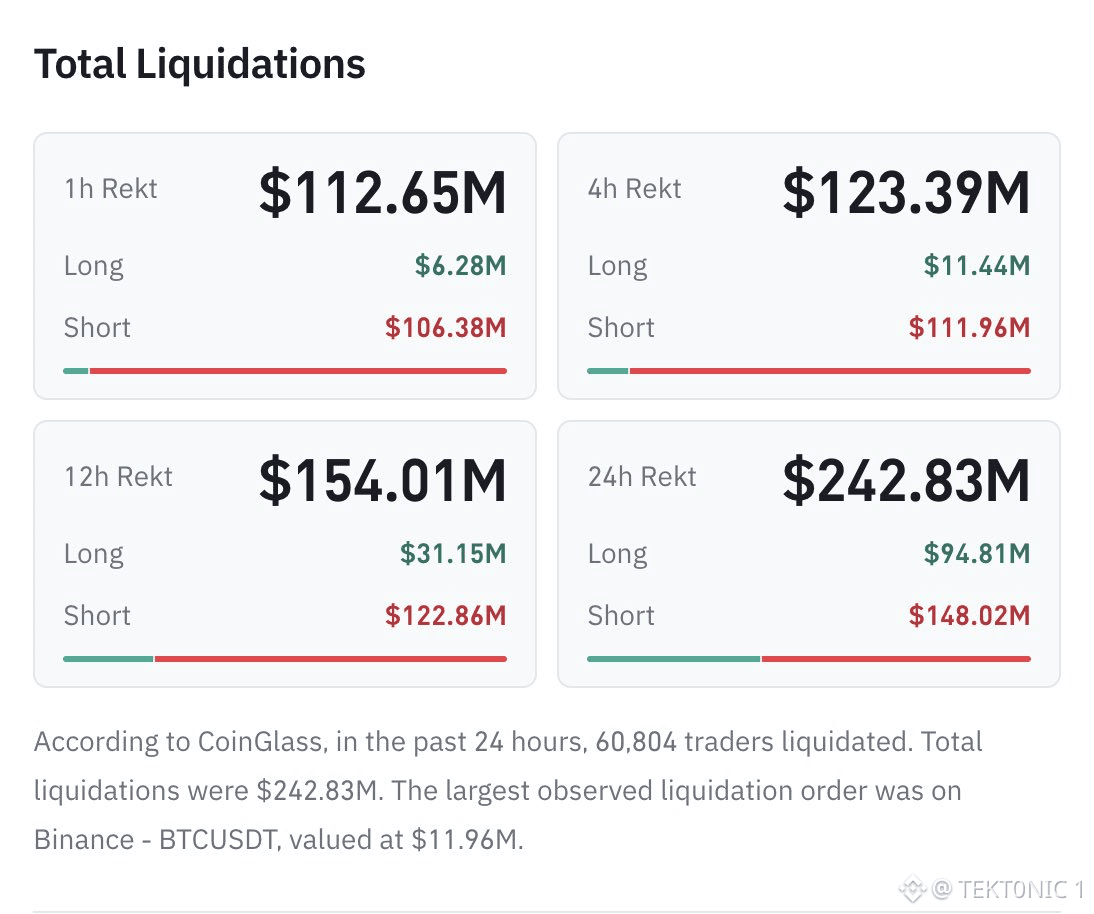
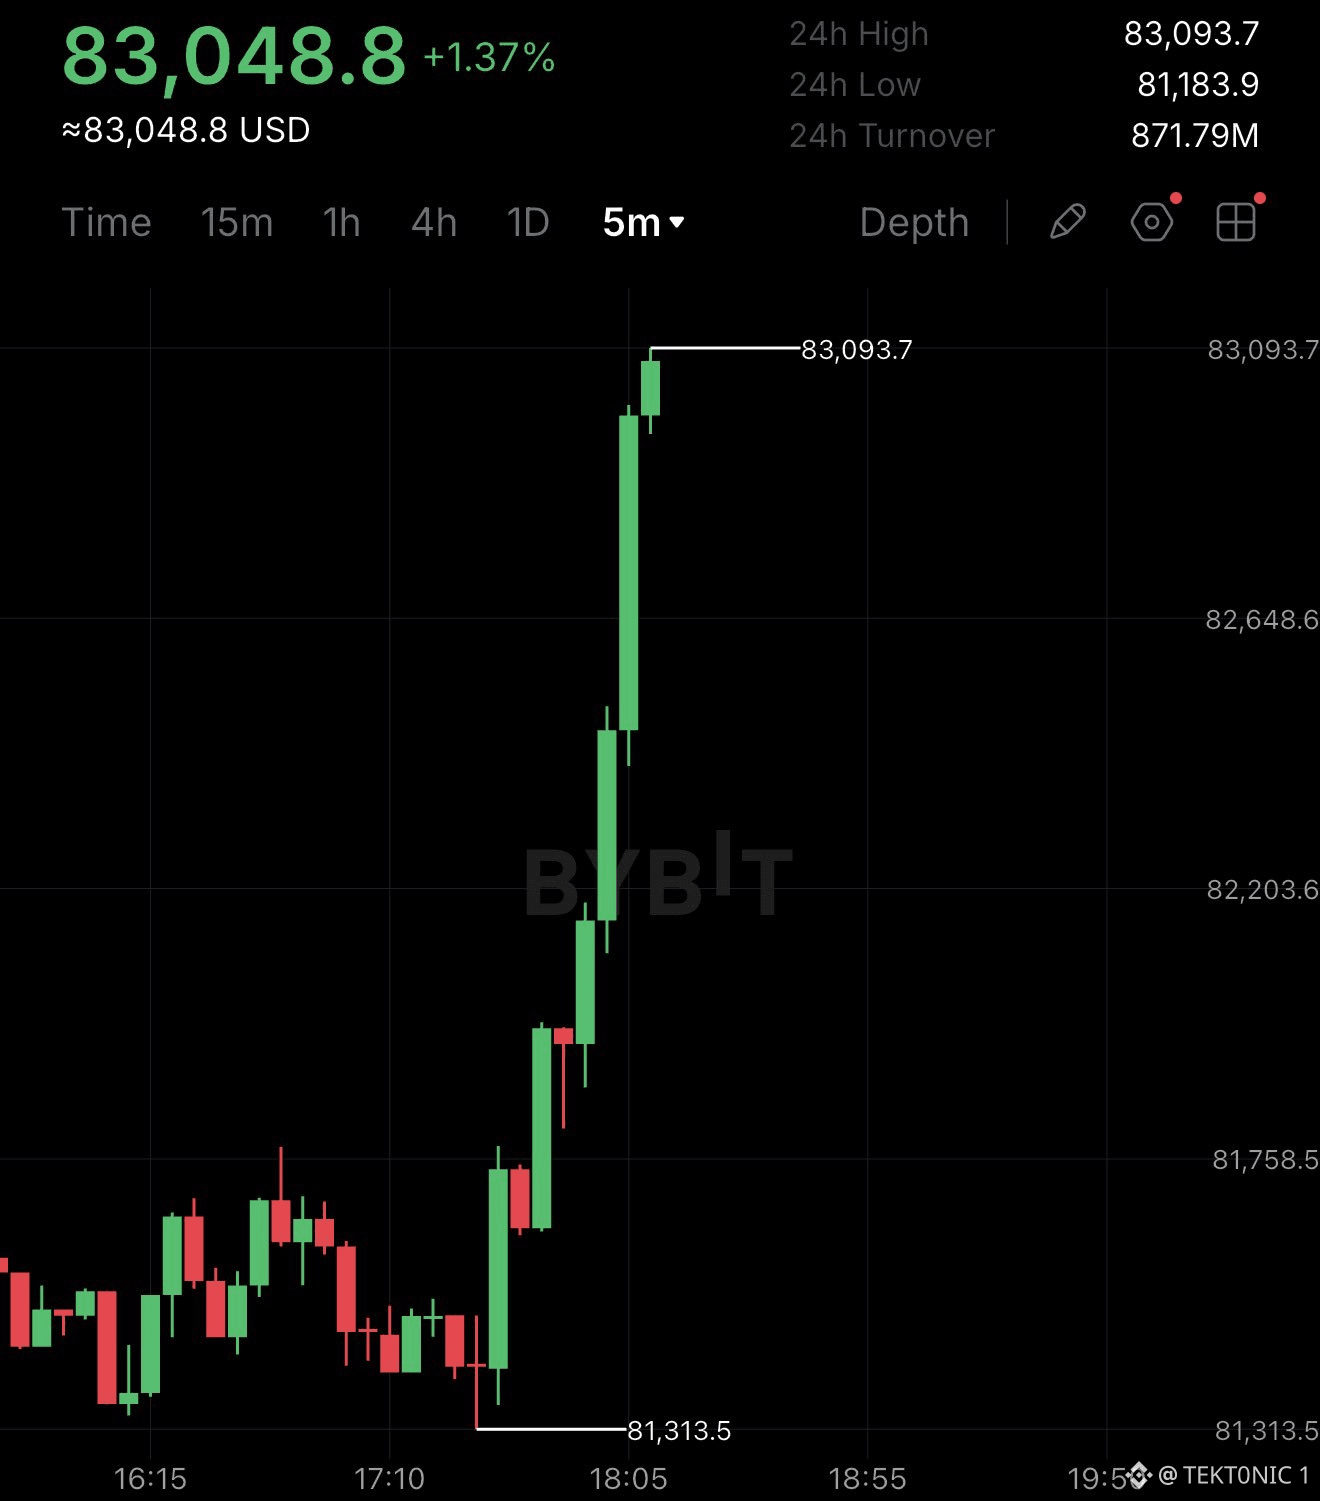
Le bitcoin dépasse les 83 000 $ et efface 106 millions de dollars de positions vendeuses en 60 minutes. 💔 Lorsque le $BTC évolue à l’opposé des vendeurs fortement endettés, les plateformes d’échange clôturent automatiquement leurs positions dès que les exigences de marge ne sont plus respectées. Ces clôtures forcées peuvent accentuer la pression acheteuse, faire grimper les prix et déclencher encore davantage de liquidations. Mais voici le hic : un short squeeze peut alimenter un rallye sans pour autant garantir un retournement durable de tendance. Pour le $BTC, la question importante est de savoir si les acheteurs au comptant prendront le relais pour soutenir le mouvement une fois que les achats forcés se seront estompés. Une heure assurément douloureuse pour les baissiers, mais les haussiers sauront-ils maintenir la dynamique ? #Analyse du prix du BTC# #Prévision du prix du Bitcoin : quel sera le prochain mouvement du Bitcoin ?# #Perspectives macroéconomiques# $ETH
Le bitcoin dépasse les 83 000 $ et efface 106 millions de dollars de positions vendeuses en 60 minutes. 💔 Lorsque le $BTC évolue à l’opposé des vendeurs fortement endettés, les plateformes d’échange clôturent automatiquement leurs positions dès que les exigences de marge ne sont plus respectées. Ces clôtures forcées peuvent accentuer la pression acheteuse, faire grimper les prix et déclencher encore davantage de liquidations. Mais voici le hic : un short squeeze peut alimenter un rallye sans pour autant garantir un retournement durable de tendance. Pour le $BTC, la question importante est de savoir si les acheteurs au comptant prendront le relais pour soutenir le mouvement une fois que les achats forcés se seront estompés. Une heure assurément douloureuse pour les baissiers, mais les haussiers sauront-ils maintenir la dynamique ? #Analyse du prix du BTC# #Prévision du prix du Bitcoin : quel sera le prochain mouvement du Bitcoin ?# #Perspectives macroéconomiques# $ETH
28
·
--
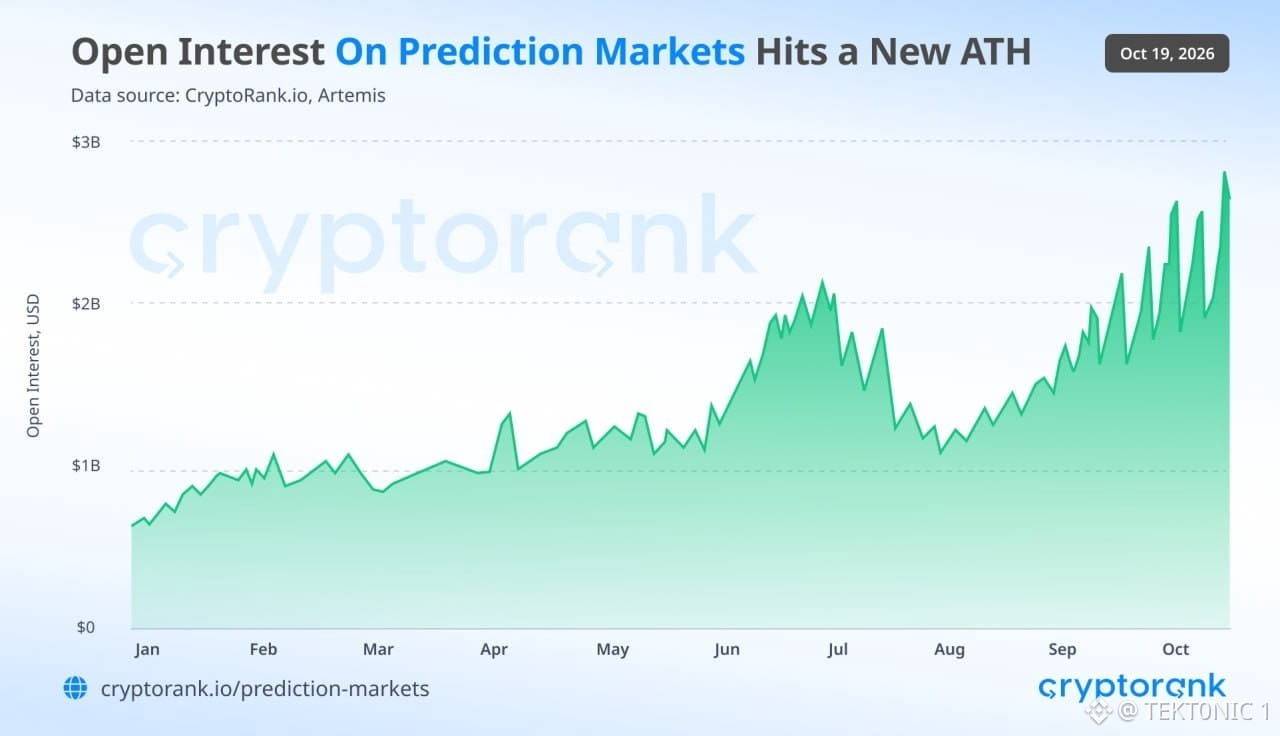
L’intérêt ouvert des marchés prédictifs atteint un nouveau record historique de 2,8 milliards de dollars. Depuis août, les capitaux immobilisés dans des positions actives sur les marchés prédictifs sont passés d’environ 1,1 milliard à 2,8 milliards de dollars. Le marché reste fortement concentré : > Kalshi : 71 % > Polymarket : 24 % À eux deux, ils représentent environ 95 % de l’intérêt ouvert total. L’intérêt ouvert mesure la valeur des positions qui restent actives, et non le montant des transactions effectuées sur une période donnée. Sa croissance indique que davantage de capitaux sont engagés dans la prédiction d’événements réels. Ces marchés couvrent désormais tout, des élections et du sport aux cours des cryptomonnaies et aux décisions de la Fed. Il faudra maintenant voir si cette croissance s’étend à d’autres plateformes ou si elle reste concentrée chez Kalshi et Polymarket. #Analyse du prix du BTC# #Prévision du prix du Bitcoin : quel sera le prochain mouvement du Bitcoin ?# $BTC $XRP
L’intérêt ouvert des marchés prédictifs atteint un nouveau record historique de 2,8 milliards de dollars. Depuis août, les capitaux immobilisés dans des positions actives sur les marchés prédictifs sont passés d’environ 1,1 milliard à 2,8 milliards de dollars. Le marché reste fortement concentré : > Kalshi : 71 % > Polymarket : 24 % À eux deux, ils représentent environ 95 % de l’intérêt ouvert total. L’intérêt ouvert mesure la valeur des positions qui restent actives, et non le montant des transactions effectuées sur une période donnée. Sa croissance indique que davantage de capitaux sont engagés dans la prédiction d’événements réels. Ces marchés couvrent désormais tout, des élections et du sport aux cours des cryptomonnaies et aux décisions de la Fed. Il faudra maintenant voir si cette croissance s’étend à d’autres plateformes ou si elle reste concentrée chez Kalshi et Polymarket. #Analyse du prix du BTC# #Prévision du prix du Bitcoin : quel sera le prochain mouvement du Bitcoin ?# $BTC $XRP
47
·
--
Strive a levé environ 630 millions de dollars grâce à une introduction en bourse d’actions privilégiées de taille supérieure aux prévisions. La société a vendu 7 millions d’actions privilégiées SATS à 15 %, au prix de 90 dollars chacune. C’est plus que les 5 millions d’actions initialement proposées. Le produit brut de l’émission s’élève à près de 630 millions de dollars, avant déduction des frais. Le règlement est prévu le 20 octobre. Les actions privilégiées versent un dividende fixe de 15 % sur une valeur nominale de 100 dollars. Au prix de 90 dollars, cela correspond à un rendement effectif d’environ 16,7 %. Elles sont de rang inférieur aux actions privilégiées SATA existantes de Strive et ne diluent pas les actions ordinaires. Les fonds sont destinés aux besoins généraux de l’entreprise, notamment à l’achat de bitcoins. Aux cours actuels, proches de 83 000 dollars, la totalité de cette somme permettrait d’acquérir environ 7 600 BTC supplémentaires. Strive détient déjà 36 818 $BTC. Il s’agit de nouveaux capitaux pour la trésorerie. Rien ne garantit que chaque dollar sera directement investi dans le bitcoin. Le prochain dépôt réglementaire indiquera quelle somme aura effectivement été déployée. #Analyse du cours du BTC# #Prévision du cours du bitcoin : quel sera le prochain mouvement du bitcoin ?# #Perspectives macroéconomiques# $BTC $ETH
Strive a levé environ 630 millions de dollars grâce à une introduction en bourse d’actions privilégiées de taille supérieure aux prévisions. La société a vendu 7 millions d’actions privilégiées SATS à 15 %, au prix de 90 dollars chacune. C’est plus que les 5 millions d’actions initialement proposées. Le produit brut de l’émission s’élève à près de 630 millions de dollars, avant déduction des frais. Le règlement est prévu le 20 octobre. Les actions privilégiées versent un dividende fixe de 15 % sur une valeur nominale de 100 dollars. Au prix de 90 dollars, cela correspond à un rendement effectif d’environ 16,7 %. Elles sont de rang inférieur aux actions privilégiées SATA existantes de Strive et ne diluent pas les actions ordinaires. Les fonds sont destinés aux besoins généraux de l’entreprise, notamment à l’achat de bitcoins. Aux cours actuels, proches de 83 000 dollars, la totalité de cette somme permettrait d’acquérir environ 7 600 BTC supplémentaires. Strive détient déjà 36 818 $BTC. Il s’agit de nouveaux capitaux pour la trésorerie. Rien ne garantit que chaque dollar sera directement investi dans le bitcoin. Le prochain dépôt réglementaire indiquera quelle somme aura effectivement été déployée. #Analyse du cours du BTC# #Prévision du cours du bitcoin : quel sera le prochain mouvement du bitcoin ?# #Perspectives macroéconomiques# $BTC $ETH

58
·
--
Le Bitcoin est repassé au-dessus de 83 000 $ alors que des informations indiquent que les États-Unis et l’Iran ont donné leur approbation préliminaire à une proposition de paix négociée par le Qatar et le Pakistan. Selon des sources citées par Al-Araby Al-Jadeed, les deux parties ont apporté leur soutien initial à un plan de compromis. Les conditions rapportées prévoient des inspections confidentielles de sites nucléaires iraniens par l’AIEA et le déblocage partiel d’environ 6 milliards de dollars de fonds iraniens gelés au Qatar. Ni Washington ni Téhéran n’ont confirmé officiellement ces informations. Le cours du $BTC évolue à la hausse alors que les prix du pétrole ont baissé et que les actifs risqués ont réagi à la dernière série de médiations. Le Bitcoin s’échangeait autour de 82 000 $ plus tôt dans la semaine et a dépassé les 83 000 $ à la suite de ces informations. Des déclarations antérieures des deux parties ont déjà fait bouger les marchés, notamment lorsque la Maison-Blanche a exclu toute frappe avant les élections de mi-mandat. Ces informations restent préliminaires. Les détails de la proposition et l’ampleur de tout accord restent limités, et les précédentes tentatives de médiation ont échoué. La réaction des cours montre que le marché suit de près la voie diplomatique. Elle ne confirme pas qu’un accord définitif a été conclu. #Analyse du cours du BTC# #Prévision du cours du Bitcoin : quelle sera la prochaine évolution du Bitcoin ?# $BTC $ETH
Le Bitcoin est repassé au-dessus de 83 000 $ alors que des informations indiquent que les États-Unis et l’Iran ont donné leur approbation préliminaire à une proposition de paix négociée par le Qatar et le Pakistan. Selon des sources citées par Al-Araby Al-Jadeed, les deux parties ont apporté leur soutien initial à un plan de compromis. Les conditions rapportées prévoient des inspections confidentielles de sites nucléaires iraniens par l’AIEA et le déblocage partiel d’environ 6 milliards de dollars de fonds iraniens gelés au Qatar. Ni Washington ni Téhéran n’ont confirmé officiellement ces informations. Le cours du $BTC évolue à la hausse alors que les prix du pétrole ont baissé et que les actifs risqués ont réagi à la dernière série de médiations. Le Bitcoin s’échangeait autour de 82 000 $ plus tôt dans la semaine et a dépassé les 83 000 $ à la suite de ces informations. Des déclarations antérieures des deux parties ont déjà fait bouger les marchés, notamment lorsque la Maison-Blanche a exclu toute frappe avant les élections de mi-mandat. Ces informations restent préliminaires. Les détails de la proposition et l’ampleur de tout accord restent limités, et les précédentes tentatives de médiation ont échoué. La réaction des cours montre que le marché suit de près la voie diplomatique. Elle ne confirme pas qu’un accord définitif a été conclu. #Analyse du cours du BTC# #Prévision du cours du Bitcoin : quelle sera la prochaine évolution du Bitcoin ?# $BTC $ETH
67
·
--
Soyons honnêtes : pourquoi payer en crypto reste-t-il plus compliqué que ça ne devrait l’être ? Vous pouvez détenir des USDC ou des USDT dans votre portefeuille, mais utiliser ces fonds pour régler vos achats du quotidien n’est pas toujours simple. @WalletConnect travaille à changer cela avec WalletConnect Pay, qui permet aux utilisateurs de payer en ligne ou en magasin directement depuis leurs portefeuilles existants. Les commerçants peuvent accepter des paiements depuis différents portefeuilles et avec différents actifs pris en charge grâce à une seule intégration, sans avoir à créer un système distinct pour chaque portefeuille. WalletConnect a pour objectif de faciliter l’utilisation des paiements en stablecoins dans le commerce au quotidien, tout en offrant aux commerçants davantage de possibilités pour accepter les paiements. Détenir des cryptos, c’est une chose. Pouvoir les dépenser là où vous faites vos achats, c’en est une autre. #Analyse du cours du BTC# #Prévision du cours du Bitcoin : quel sera le prochain mouvement du Bitcoin ?# $BTC $ETH
Soyons honnêtes : pourquoi payer en crypto reste-t-il plus compliqué que ça ne devrait l’être ? Vous pouvez détenir des USDC ou des USDT dans votre portefeuille, mais utiliser ces fonds pour régler vos achats du quotidien n’est pas toujours simple. @WalletConnect travaille à changer cela avec WalletConnect Pay, qui permet aux utilisateurs de payer en ligne ou en magasin directement depuis leurs portefeuilles existants. Les commerçants peuvent accepter des paiements depuis différents portefeuilles et avec différents actifs pris en charge grâce à une seule intégration, sans avoir à créer un système distinct pour chaque portefeuille. WalletConnect a pour objectif de faciliter l’utilisation des paiements en stablecoins dans le commerce au quotidien, tout en offrant aux commerçants davantage de possibilités pour accepter les paiements. Détenir des cryptos, c’est une chose. Pouvoir les dépenser là où vous faites vos achats, c’en est une autre. #Analyse du cours du BTC# #Prévision du cours du Bitcoin : quel sera le prochain mouvement du Bitcoin ?# $BTC $ETH

27
·
--
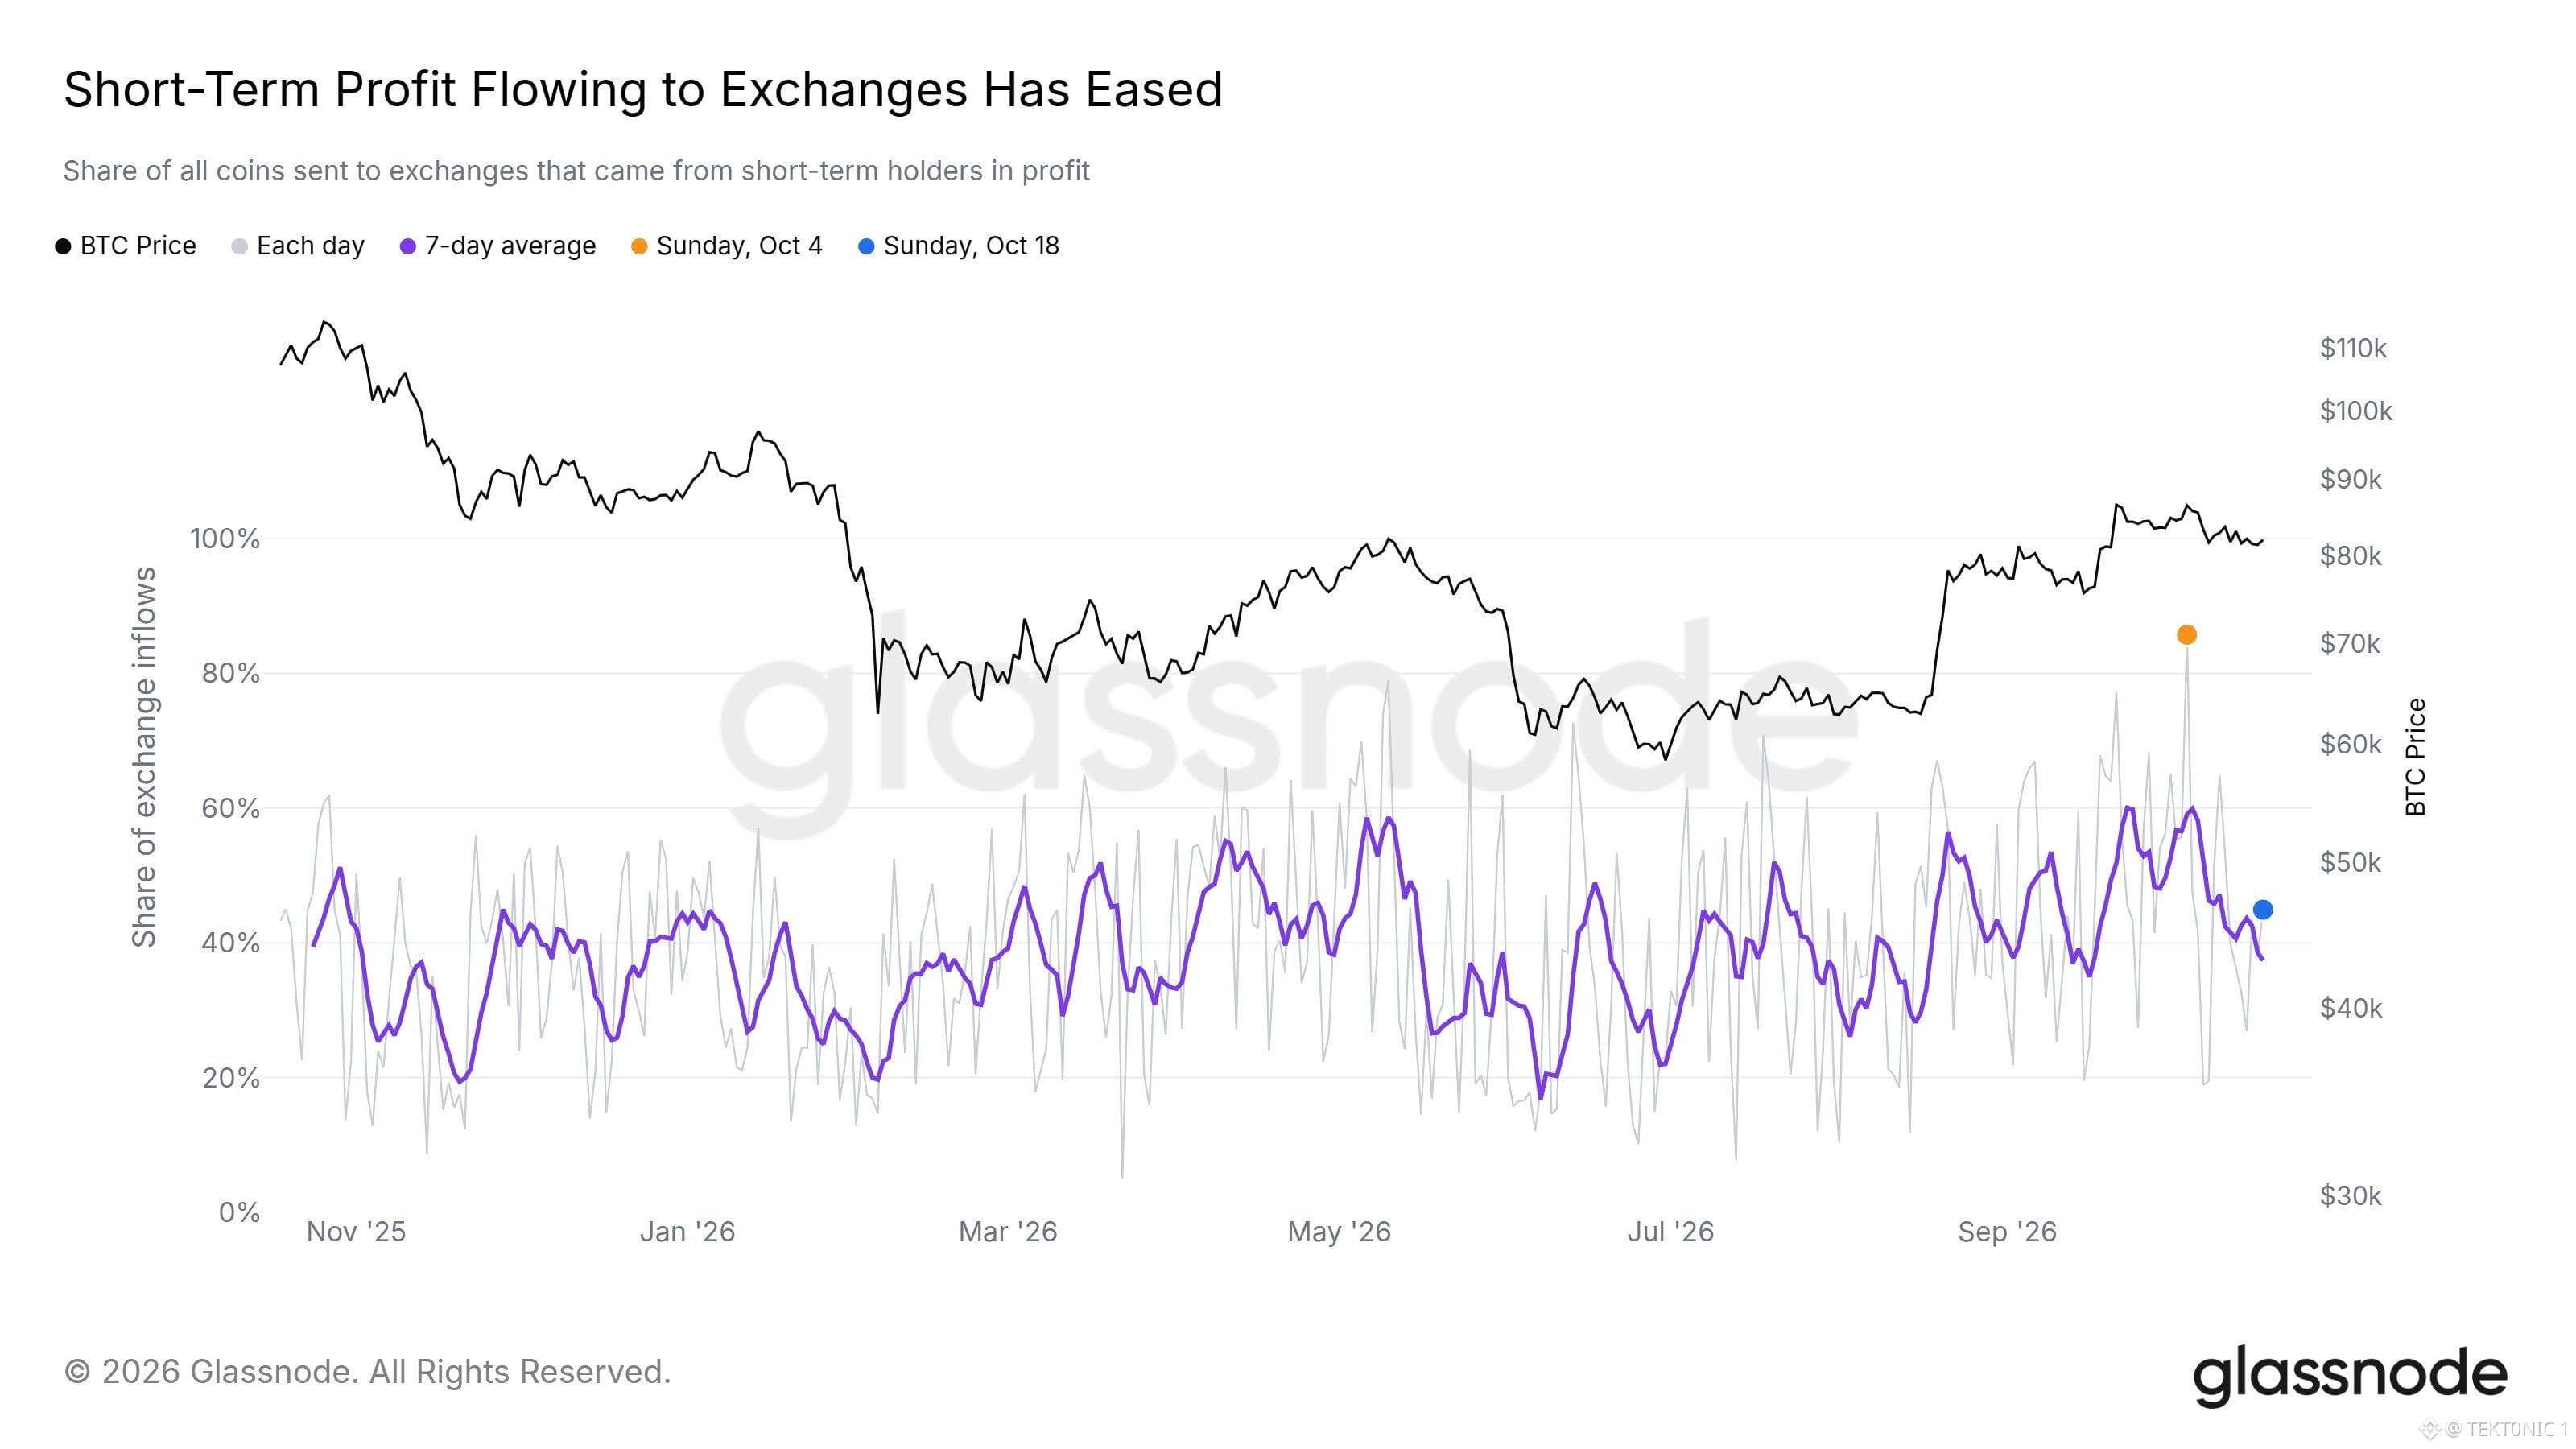
Il y a deux semaines, les détenteurs à court terme en plus-value représentaient la plus grande part des entrées sur les plateformes d’échange depuis un an. Selon Glassnode, la part des coins envoyés vers les plateformes d’échange provenant de détenteurs à court terme en plus-value a atteint un sommet proche du haut de la fourchette récente, le 4 octobre. La moyenne sur 7 jours était également élevée à ce moment-là. Ces flux correspondaient à la pression qui a empêché le $BTC de se maintenir dans le haut de la fourchette des 80 000 $. Cette même mesure a maintenant diminué. La valeur du 18 octobre se situe près du milieu du graphique, et la moyenne sur 7 jours est revenue près du niveau où elle a évolué pendant la majeure partie de l’année écoulée. Les valeurs quotidiennes fluctuent encore, mais la période de niveaux élevés s’est atténuée. Cette part indique quelle proportion des coins arrivant sur les plateformes d’échange provenait de détenteurs à court terme en plus-value. Une part plus élevée signifie qu’une plus grande quantité de ces ventes pesait sur le marché. Une part plus faible signifie que cette source d’offre particulière s’est réduite. Elle ne montre pas le total des entrées sur les plateformes d’échange ni ce que font les détenteurs à long terme. Les flux de vente des détenteurs à court terme en plus-value sont revenus vers leur niveau habituel. Reste à savoir s’ils y resteront : cela dépendra de la capacité de la prochaine hausse à déclencher à nouveau les mêmes ventes. #Analyse du prix du BTC# #Prévision du prix du Bitcoin : quel sera le prochain mouvement du Bitcoin ?# $BTC $ETH
Il y a deux semaines, les détenteurs à court terme en plus-value représentaient la plus grande part des entrées sur les plateformes d’échange depuis un an. Selon Glassnode, la part des coins envoyés vers les plateformes d’échange provenant de détenteurs à court terme en plus-value a atteint un sommet proche du haut de la fourchette récente, le 4 octobre. La moyenne sur 7 jours était également élevée à ce moment-là. Ces flux correspondaient à la pression qui a empêché le $BTC de se maintenir dans le haut de la fourchette des 80 000 $. Cette même mesure a maintenant diminué. La valeur du 18 octobre se situe près du milieu du graphique, et la moyenne sur 7 jours est revenue près du niveau où elle a évolué pendant la majeure partie de l’année écoulée. Les valeurs quotidiennes fluctuent encore, mais la période de niveaux élevés s’est atténuée. Cette part indique quelle proportion des coins arrivant sur les plateformes d’échange provenait de détenteurs à court terme en plus-value. Une part plus élevée signifie qu’une plus grande quantité de ces ventes pesait sur le marché. Une part plus faible signifie que cette source d’offre particulière s’est réduite. Elle ne montre pas le total des entrées sur les plateformes d’échange ni ce que font les détenteurs à long terme. Les flux de vente des détenteurs à court terme en plus-value sont revenus vers leur niveau habituel. Reste à savoir s’ils y resteront : cela dépendra de la capacité de la prochaine hausse à déclencher à nouveau les mêmes ventes. #Analyse du prix du BTC# #Prévision du prix du Bitcoin : quel sera le prochain mouvement du Bitcoin ?# $BTC $ETH
39
·
--
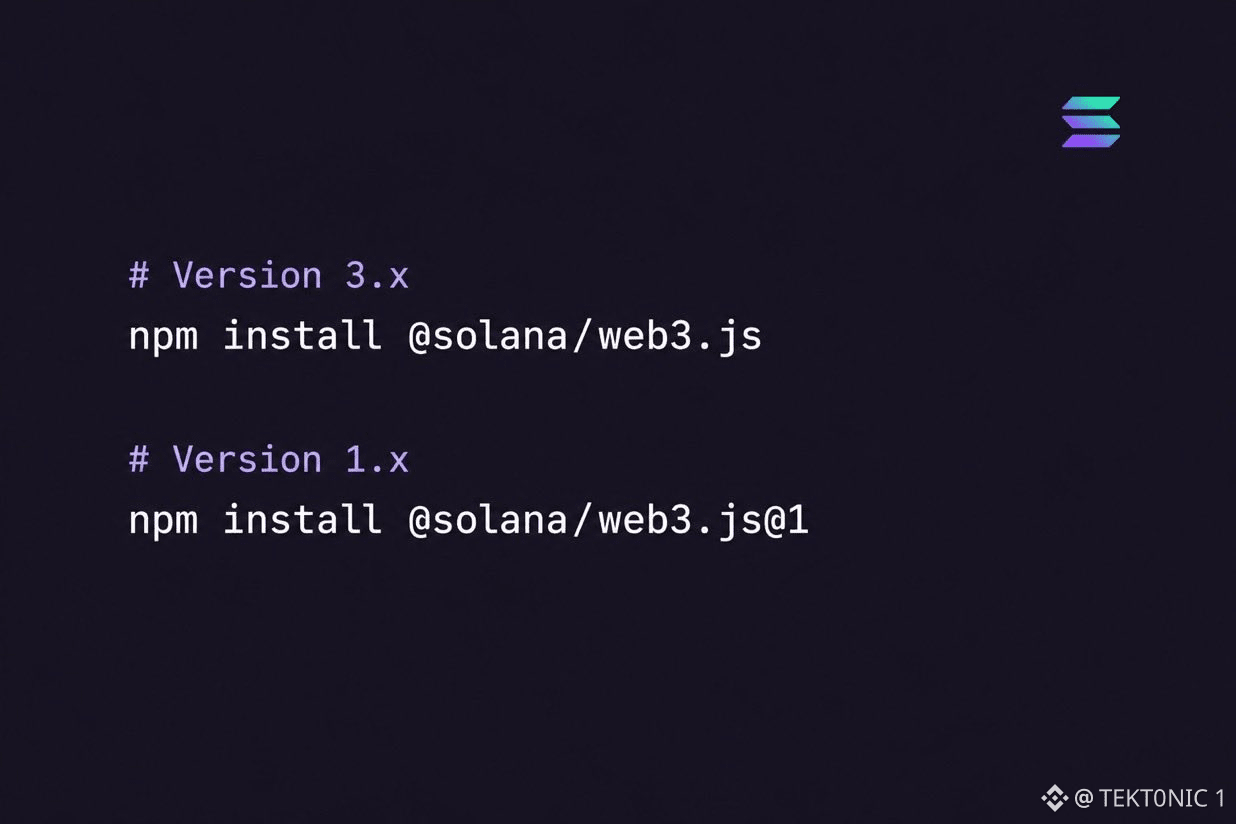
Développer sur Solana vient de bénéficier d’une mise à jour côté développeurs. Solana a publié la version 3, qui reconstruit son populaire SDK JavaScript sur Solana Kit. L’objectif est de simplifier le développement en regroupant des outils et des interfaces communs, en réduisant les dépendances inutiles et en permettant aux développeurs de créer des bundles d’applications plus légers. Pourquoi est-ce important ? Des bundles plus légers peuvent réduire la quantité de code que les utilisateurs doivent télécharger, tandis qu’un SDK plus cohérent facilite le travail des développeurs avec les portefeuilles, les signataires et les transactions. Cette mise à jour offre également aux développeurs qui utilisent déjà web3.js une voie vers l’architecture plus récente de Kit, sans les obliger à renoncer entièrement à l’API qu’ils connaissent. De meilleurs outils pour les développeurs peuvent faciliter la création sur Solana, mais le véritable test sera de voir avec quelle fluidité les équipes adopteront la nouvelle version. #AnalyseDuPrixDuBTC# #PerspectivesMacroéconomiques# #SaisonDesAltcoins# $BTC $SOL
Développer sur Solana vient de bénéficier d’une mise à jour côté développeurs. Solana a publié la version 3, qui reconstruit son populaire SDK JavaScript sur Solana Kit. L’objectif est de simplifier le développement en regroupant des outils et des interfaces communs, en réduisant les dépendances inutiles et en permettant aux développeurs de créer des bundles d’applications plus légers. Pourquoi est-ce important ? Des bundles plus légers peuvent réduire la quantité de code que les utilisateurs doivent télécharger, tandis qu’un SDK plus cohérent facilite le travail des développeurs avec les portefeuilles, les signataires et les transactions. Cette mise à jour offre également aux développeurs qui utilisent déjà web3.js une voie vers l’architecture plus récente de Kit, sans les obliger à renoncer entièrement à l’API qu’ils connaissent. De meilleurs outils pour les développeurs peuvent faciliter la création sur Solana, mais le véritable test sera de voir avec quelle fluidité les équipes adopteront la nouvelle version. #AnalyseDuPrixDuBTC# #PerspectivesMacroéconomiques# #SaisonDesAltcoins# $BTC $SOL
56
·
--
Metaplanet devrait prendre une participation de 93,7 % dans Super League, cotée au Nasdaq, dans le cadre d’un accord prévoyant un apport de 2 100 $BTC et de 2,5 millions de dollars en espèces. Les actionnaires de Super League ont approuvé la transaction le 16 octobre. Metaplanet recevra 44,86 millions d’actions ordinaires au prix de 3,00 $ chacune, ainsi que des actions privilégiées et des bons de souscription. À la clôture, la société sera rebaptisée Superplanet et sera négociée sous le symbole boursier SUPA. Les actions ordinaires de Metaplanet seront soumises à une période de blocage de cinq ans. Les 2 100 BTC représentent moins de 5 % des quelque 44 000 $BTC détenus dans la trésorerie de Metaplanet. Cet apport permet de conserver les pièces au sein d’un groupe consolidé plutôt que de les vendre. L’activité existante de Super League dans la publicité et les médias se poursuivra en tant que segment distinct. Cela donne à Metaplanet un véhicule de trésorerie en bitcoins coté aux États-Unis, en plus de sa cotation à Tokyo. La clôture reste soumise aux conditions habituelles et est attendue au quatrième trimestre. L’approbation franchit l’étape de l’accord des actionnaires. Elle ne finalise pas le transfert. #Analyse du prix du BTC# #Prévision du prix du Bitcoin : quelle sera la prochaine évolution du Bitcoin ?# #Perspectives macroéconomiques# $ETH
Metaplanet devrait prendre une participation de 93,7 % dans Super League, cotée au Nasdaq, dans le cadre d’un accord prévoyant un apport de 2 100 $BTC et de 2,5 millions de dollars en espèces. Les actionnaires de Super League ont approuvé la transaction le 16 octobre. Metaplanet recevra 44,86 millions d’actions ordinaires au prix de 3,00 $ chacune, ainsi que des actions privilégiées et des bons de souscription. À la clôture, la société sera rebaptisée Superplanet et sera négociée sous le symbole boursier SUPA. Les actions ordinaires de Metaplanet seront soumises à une période de blocage de cinq ans. Les 2 100 BTC représentent moins de 5 % des quelque 44 000 $BTC détenus dans la trésorerie de Metaplanet. Cet apport permet de conserver les pièces au sein d’un groupe consolidé plutôt que de les vendre. L’activité existante de Super League dans la publicité et les médias se poursuivra en tant que segment distinct. Cela donne à Metaplanet un véhicule de trésorerie en bitcoins coté aux États-Unis, en plus de sa cotation à Tokyo. La clôture reste soumise aux conditions habituelles et est attendue au quatrième trimestre. L’approbation franchit l’étape de l’accord des actionnaires. Elle ne finalise pas le transfert. #Analyse du prix du BTC# #Prévision du prix du Bitcoin : quelle sera la prochaine évolution du Bitcoin ?# #Perspectives macroéconomiques# $ETH

80
·
--
Les États-Unis allègent la pression sur la Russie alors que Trump tente de ramener Poutine à la table des négociations de paix sur l’Ukraine. Trump a conclu avec la Russie un accord d’exportation de diesel portant sur une première livraison de plus de 300 000 tonnes, d’autres expéditions étant prévues en novembre et au-delà. L’administration a également reporté de nouvelles sanctions visant la Russie, accordant aux responsables jusqu’à 60 jours pour en évaluer les effets économiques. L’objectif est d’accroître l’offre mondiale de carburant, de faire baisser les prix de l’énergie et d’inciter Moscou à reprendre les négociations. Mais l’Ukraine a critiqué cette décision, estimant qu’un assouplissement des sanctions sans contreparties pourrait renforcer la position de la Russie. Pour les marchés mondiaux, une baisse des prix de l’énergie pourrait contribuer à atténuer les pressions inflationnistes et ainsi améliorer les conditions pour les actifs à risque comme $BTC. La question essentielle est de savoir si l’accord fera réellement baisser les coûts de l’énergie et permettra des avancées concrètes vers la paix, ou s’il donnera simplement davantage de marge de manœuvre à la Russie. #Analyse du prix du BTC# #Prévision du prix du Bitcoin : quel sera le prochain mouvement du Bitcoin ?# #Perspectives macroéconomiques# $BTC $XRP
Les États-Unis allègent la pression sur la Russie alors que Trump tente de ramener Poutine à la table des négociations de paix sur l’Ukraine. Trump a conclu avec la Russie un accord d’exportation de diesel portant sur une première livraison de plus de 300 000 tonnes, d’autres expéditions étant prévues en novembre et au-delà. L’administration a également reporté de nouvelles sanctions visant la Russie, accordant aux responsables jusqu’à 60 jours pour en évaluer les effets économiques. L’objectif est d’accroître l’offre mondiale de carburant, de faire baisser les prix de l’énergie et d’inciter Moscou à reprendre les négociations. Mais l’Ukraine a critiqué cette décision, estimant qu’un assouplissement des sanctions sans contreparties pourrait renforcer la position de la Russie. Pour les marchés mondiaux, une baisse des prix de l’énergie pourrait contribuer à atténuer les pressions inflationnistes et ainsi améliorer les conditions pour les actifs à risque comme $BTC. La question essentielle est de savoir si l’accord fera réellement baisser les coûts de l’énergie et permettra des avancées concrètes vers la paix, ou s’il donnera simplement davantage de marge de manœuvre à la Russie. #Analyse du prix du BTC# #Prévision du prix du Bitcoin : quel sera le prochain mouvement du Bitcoin ?# #Perspectives macroéconomiques# $BTC $XRP

1
·
--
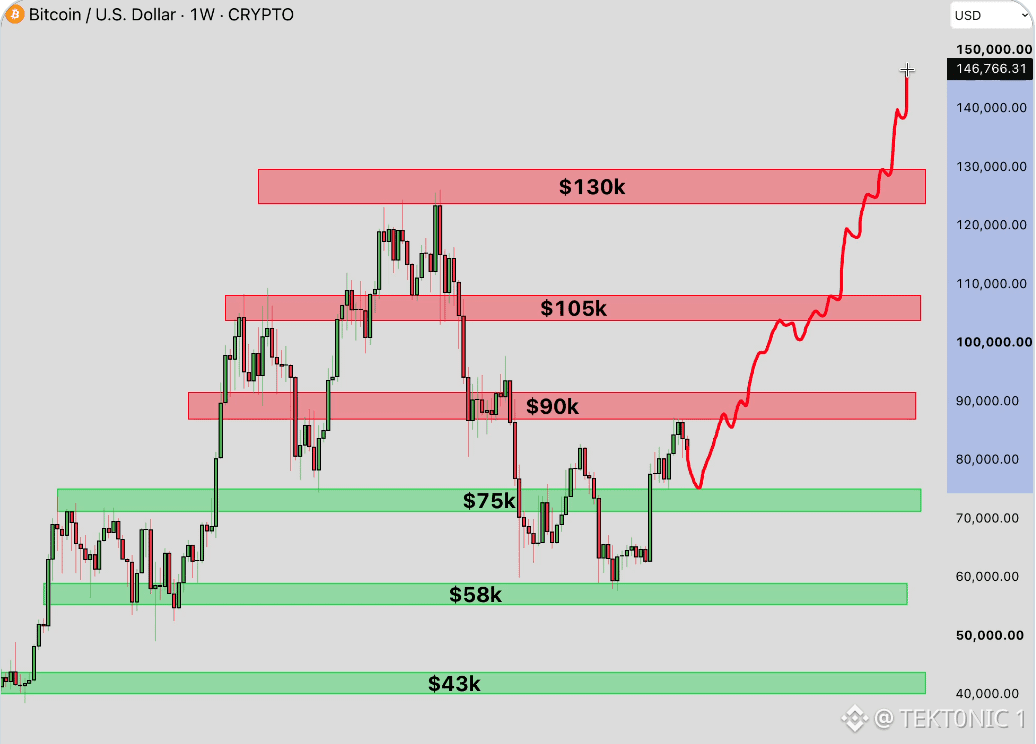
Le graphique hebdomadaire du $BTC indique trois zones de support et trois zones de résistance qui ont compté au cours de ce cycle. Le support se situe autour de 75 000 $, 58 000 $ et 43 000 $. La résistance se situe autour de 90 000 $, 105 000 $ et 130 000 $. Le cours évolue actuellement juste au-dessus de la zone des 75 000 $, après avoir reculé depuis des niveaux plus élevés. Chacune de ces zones horizontales a déjà tenu lorsque le cours l’a testée depuis l’autre côté. Les franchissements d’une zone de résistance ont ensuite entraîné le cours vers la suivante, tandis que les rebonds sur les supports ont préservé la structure générale. La projection rouge sur le graphique montre une trajectoire qui franchit les 90 000 $ et les 105 000 $ avant de tester la zone des 130 000 $. Cette trajectoire suppose que les zones rouges supérieures soient franchies plutôt que rejetées. Atteindre les 130 000 $ nécessiterait des achats soutenus au-delà des deux niveaux intermédiaires. À l’inverse, une clôture hebdomadaire du $BTC sous les 75 000 $ ouvrirait la voie aux zones vertes inférieures, autour de 58 000 $ et 43 000 $. Ces niveaux correspondent à des zones où le cours a marqué une pause ou trouvé des acheteurs par le passé. Ils ne garantissent rien. Le volume, la conjoncture macroéconomique et les tests répétés peuvent toujours modifier la réaction du cours lorsqu’il les atteint. La carte indique les zones. Elle ne dicte pas le prochain mouvement. #Analyse du cours du BTC# #Prévision du cours du Bitcoin : quel sera le prochain mouvement du Bitcoin ?# $XRP
Le graphique hebdomadaire du $BTC indique trois zones de support et trois zones de résistance qui ont compté au cours de ce cycle. Le support se situe autour de 75 000 $, 58 000 $ et 43 000 $. La résistance se situe autour de 90 000 $, 105 000 $ et 130 000 $. Le cours évolue actuellement juste au-dessus de la zone des 75 000 $, après avoir reculé depuis des niveaux plus élevés. Chacune de ces zones horizontales a déjà tenu lorsque le cours l’a testée depuis l’autre côté. Les franchissements d’une zone de résistance ont ensuite entraîné le cours vers la suivante, tandis que les rebonds sur les supports ont préservé la structure générale. La projection rouge sur le graphique montre une trajectoire qui franchit les 90 000 $ et les 105 000 $ avant de tester la zone des 130 000 $. Cette trajectoire suppose que les zones rouges supérieures soient franchies plutôt que rejetées. Atteindre les 130 000 $ nécessiterait des achats soutenus au-delà des deux niveaux intermédiaires. À l’inverse, une clôture hebdomadaire du $BTC sous les 75 000 $ ouvrirait la voie aux zones vertes inférieures, autour de 58 000 $ et 43 000 $. Ces niveaux correspondent à des zones où le cours a marqué une pause ou trouvé des acheteurs par le passé. Ils ne garantissent rien. Le volume, la conjoncture macroéconomique et les tests répétés peuvent toujours modifier la réaction du cours lorsqu’il les atteint. La carte indique les zones. Elle ne dicte pas le prochain mouvement. #Analyse du cours du BTC# #Prévision du cours du Bitcoin : quel sera le prochain mouvement du Bitcoin ?# $XRP
3
·
--
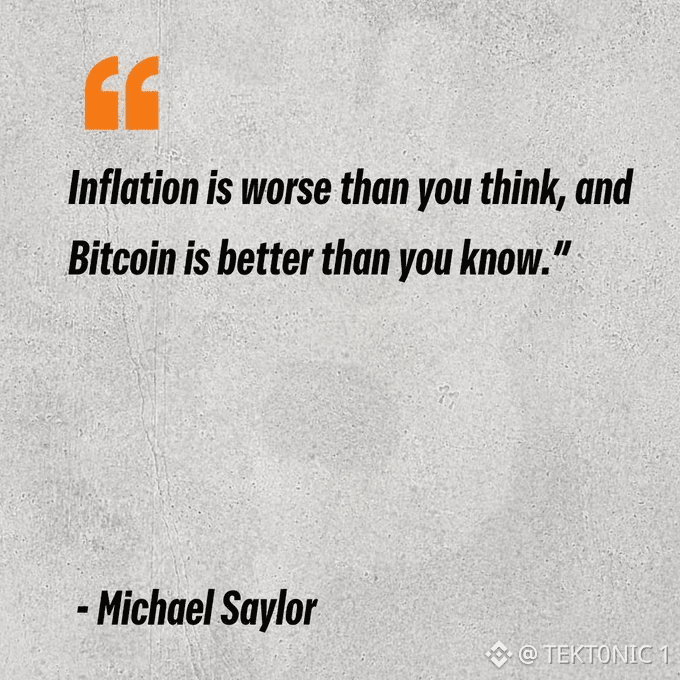
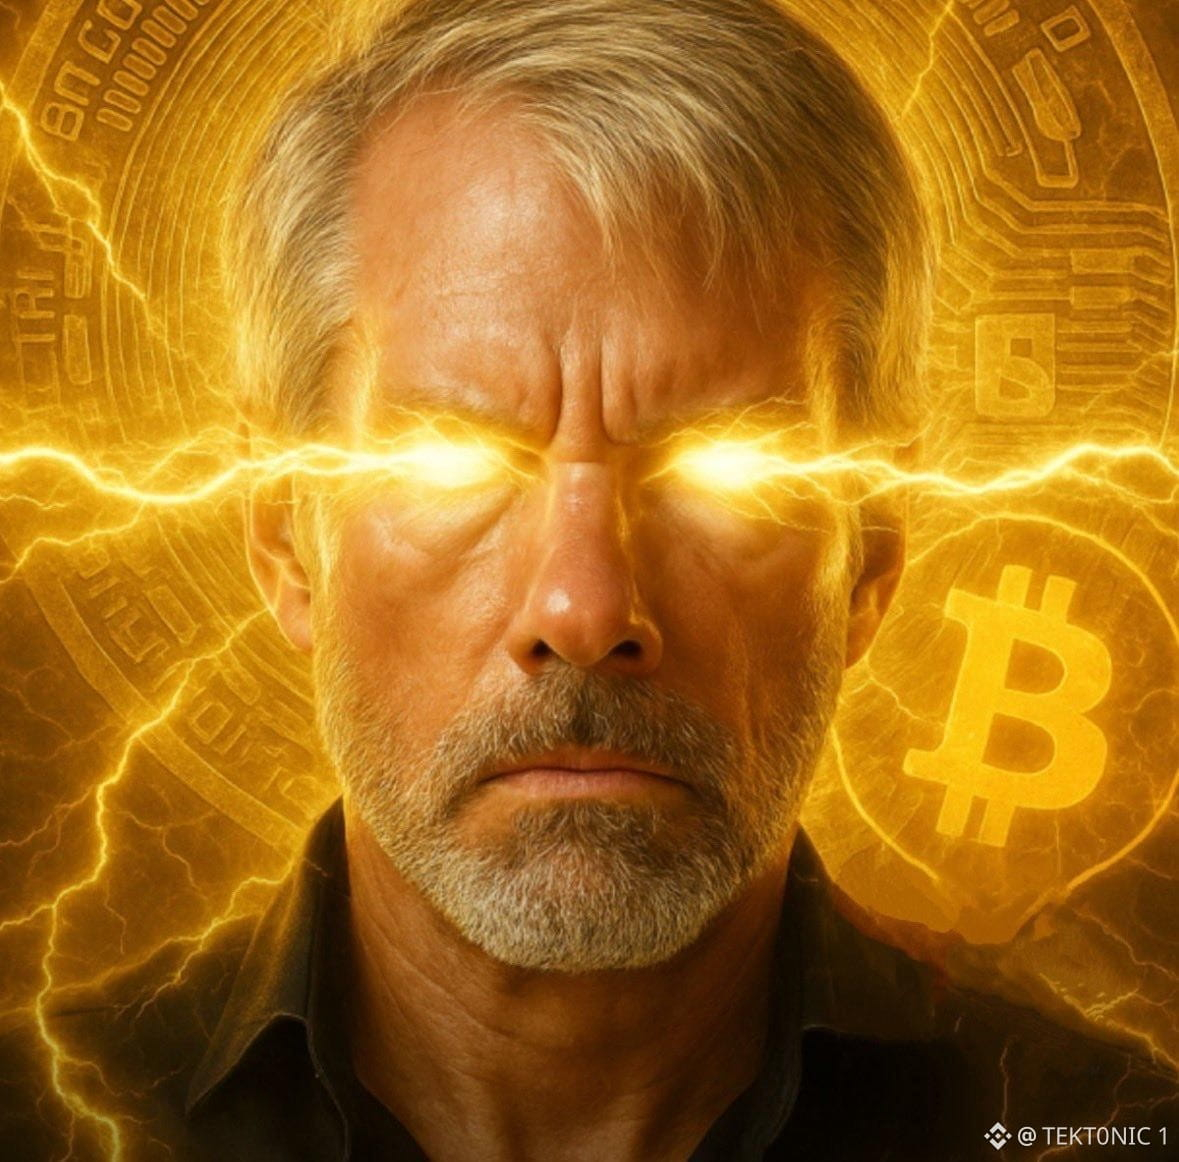
Michael Saylor estime que l’inflation est un problème plus important que la plupart des gens ne le pensent, et que le bitcoin pourrait faire partie de la solution. Son argument va au-delà de la hausse du coût de l’alimentation, du logement et des dépenses quotidiennes. À mesure que le pouvoir d’achat diminue avec le temps, détenir des liquidités devient moins intéressant, surtout lorsque les salaires et l’épargne ne suivent pas le rythme de l’inflation. C’est là que le $BTC entre en jeu. Contrairement aux monnaies fiduciaires, le bitcoin a une offre maximale fixe de 21 millions de jetons, et les nouvelles émissions diminuent lors des halvings, qui ont lieu environ tous les quatre ans. Saylor considère cette rareté comme un avantage pour préserver son patrimoine à long terme. Cependant, l’offre limitée de bitcoins n’élimine pas la volatilité des prix, et leur performance en tant que protection contre l’inflation peut varier considérablement à court terme. La question essentielle est de savoir si la rareté du bitcoin peut se traduire par un pouvoir d’achat accru dans les années à venir. #Analyse du cours du BTC# #Prévision du cours du bitcoin : quel sera le prochain mouvement du bitcoin ?# $BTC $ETH
Michael Saylor estime que l’inflation est un problème plus important que la plupart des gens ne le pensent, et que le bitcoin pourrait faire partie de la solution. Son argument va au-delà de la hausse du coût de l’alimentation, du logement et des dépenses quotidiennes. À mesure que le pouvoir d’achat diminue avec le temps, détenir des liquidités devient moins intéressant, surtout lorsque les salaires et l’épargne ne suivent pas le rythme de l’inflation. C’est là que le $BTC entre en jeu. Contrairement aux monnaies fiduciaires, le bitcoin a une offre maximale fixe de 21 millions de jetons, et les nouvelles émissions diminuent lors des halvings, qui ont lieu environ tous les quatre ans. Saylor considère cette rareté comme un avantage pour préserver son patrimoine à long terme. Cependant, l’offre limitée de bitcoins n’élimine pas la volatilité des prix, et leur performance en tant que protection contre l’inflation peut varier considérablement à court terme. La question essentielle est de savoir si la rareté du bitcoin peut se traduire par un pouvoir d’achat accru dans les années à venir. #Analyse du cours du BTC# #Prévision du cours du bitcoin : quel sera le prochain mouvement du bitcoin ?# $BTC $ETH
14
·
--
Les détenteurs de Bitcoin qui ont acheté il y a 6 à 12 mois ont presque cessé d’envoyer leurs pièces vers les plateformes d’échange. Selon CryptoQuant, la part de leurs transferts destinée aux plateformes d’échange est passée de 40,4 % à la mi-juin à seulement 4,4 % à la mi-octobre. Ces pièces proviennent en grande partie d’acheteurs ayant investi près du sommet de 2025 ou après celui-ci. Le montant total de Bitcoin transféré par ce groupe n’a pas diminué. Il est resté entre environ 144K et 217K $BTC par période de 30 jours, et la dernière mesure était en fait supérieure à celle de juin. Seule la destination a changé. Le volume de cette cohorte envoyé vers les plateformes d’échange est passé d’environ 63,8K BTC en juin à 9,1K $BTC en octobre. Cela élimine une source potentielle de pression vendeuse provenant d’un groupe qui a souvent réagi rapidement aux variations de prix. La baisse des transferts vers les plateformes d’échange de la part de ces détenteurs réduit la pression sur l’offre à court terme. Elle ne garantit pas une hausse des prix. Le marché a toujours besoin de nouveaux acheteurs pour progresser, et cette demande ne s’est pas encore manifestée à grande échelle. Les pièces sont moins souvent transférées vers les plateformes d’échange, mais elles continuent de circuler. #Analyse du prix du BTC# #Prévision du prix du Bitcoin : quel sera le prochain mouvement du Bitcoin ?# #Perspectives macroéconomiques# $ETH
Les détenteurs de Bitcoin qui ont acheté il y a 6 à 12 mois ont presque cessé d’envoyer leurs pièces vers les plateformes d’échange. Selon CryptoQuant, la part de leurs transferts destinée aux plateformes d’échange est passée de 40,4 % à la mi-juin à seulement 4,4 % à la mi-octobre. Ces pièces proviennent en grande partie d’acheteurs ayant investi près du sommet de 2025 ou après celui-ci. Le montant total de Bitcoin transféré par ce groupe n’a pas diminué. Il est resté entre environ 144K et 217K $BTC par période de 30 jours, et la dernière mesure était en fait supérieure à celle de juin. Seule la destination a changé. Le volume de cette cohorte envoyé vers les plateformes d’échange est passé d’environ 63,8K BTC en juin à 9,1K $BTC en octobre. Cela élimine une source potentielle de pression vendeuse provenant d’un groupe qui a souvent réagi rapidement aux variations de prix. La baisse des transferts vers les plateformes d’échange de la part de ces détenteurs réduit la pression sur l’offre à court terme. Elle ne garantit pas une hausse des prix. Le marché a toujours besoin de nouveaux acheteurs pour progresser, et cette demande ne s’est pas encore manifestée à grande échelle. Les pièces sont moins souvent transférées vers les plateformes d’échange, mais elles continuent de circuler. #Analyse du prix du BTC# #Prévision du prix du Bitcoin : quel sera le prochain mouvement du Bitcoin ?# #Perspectives macroéconomiques# $ETH

24
·
--
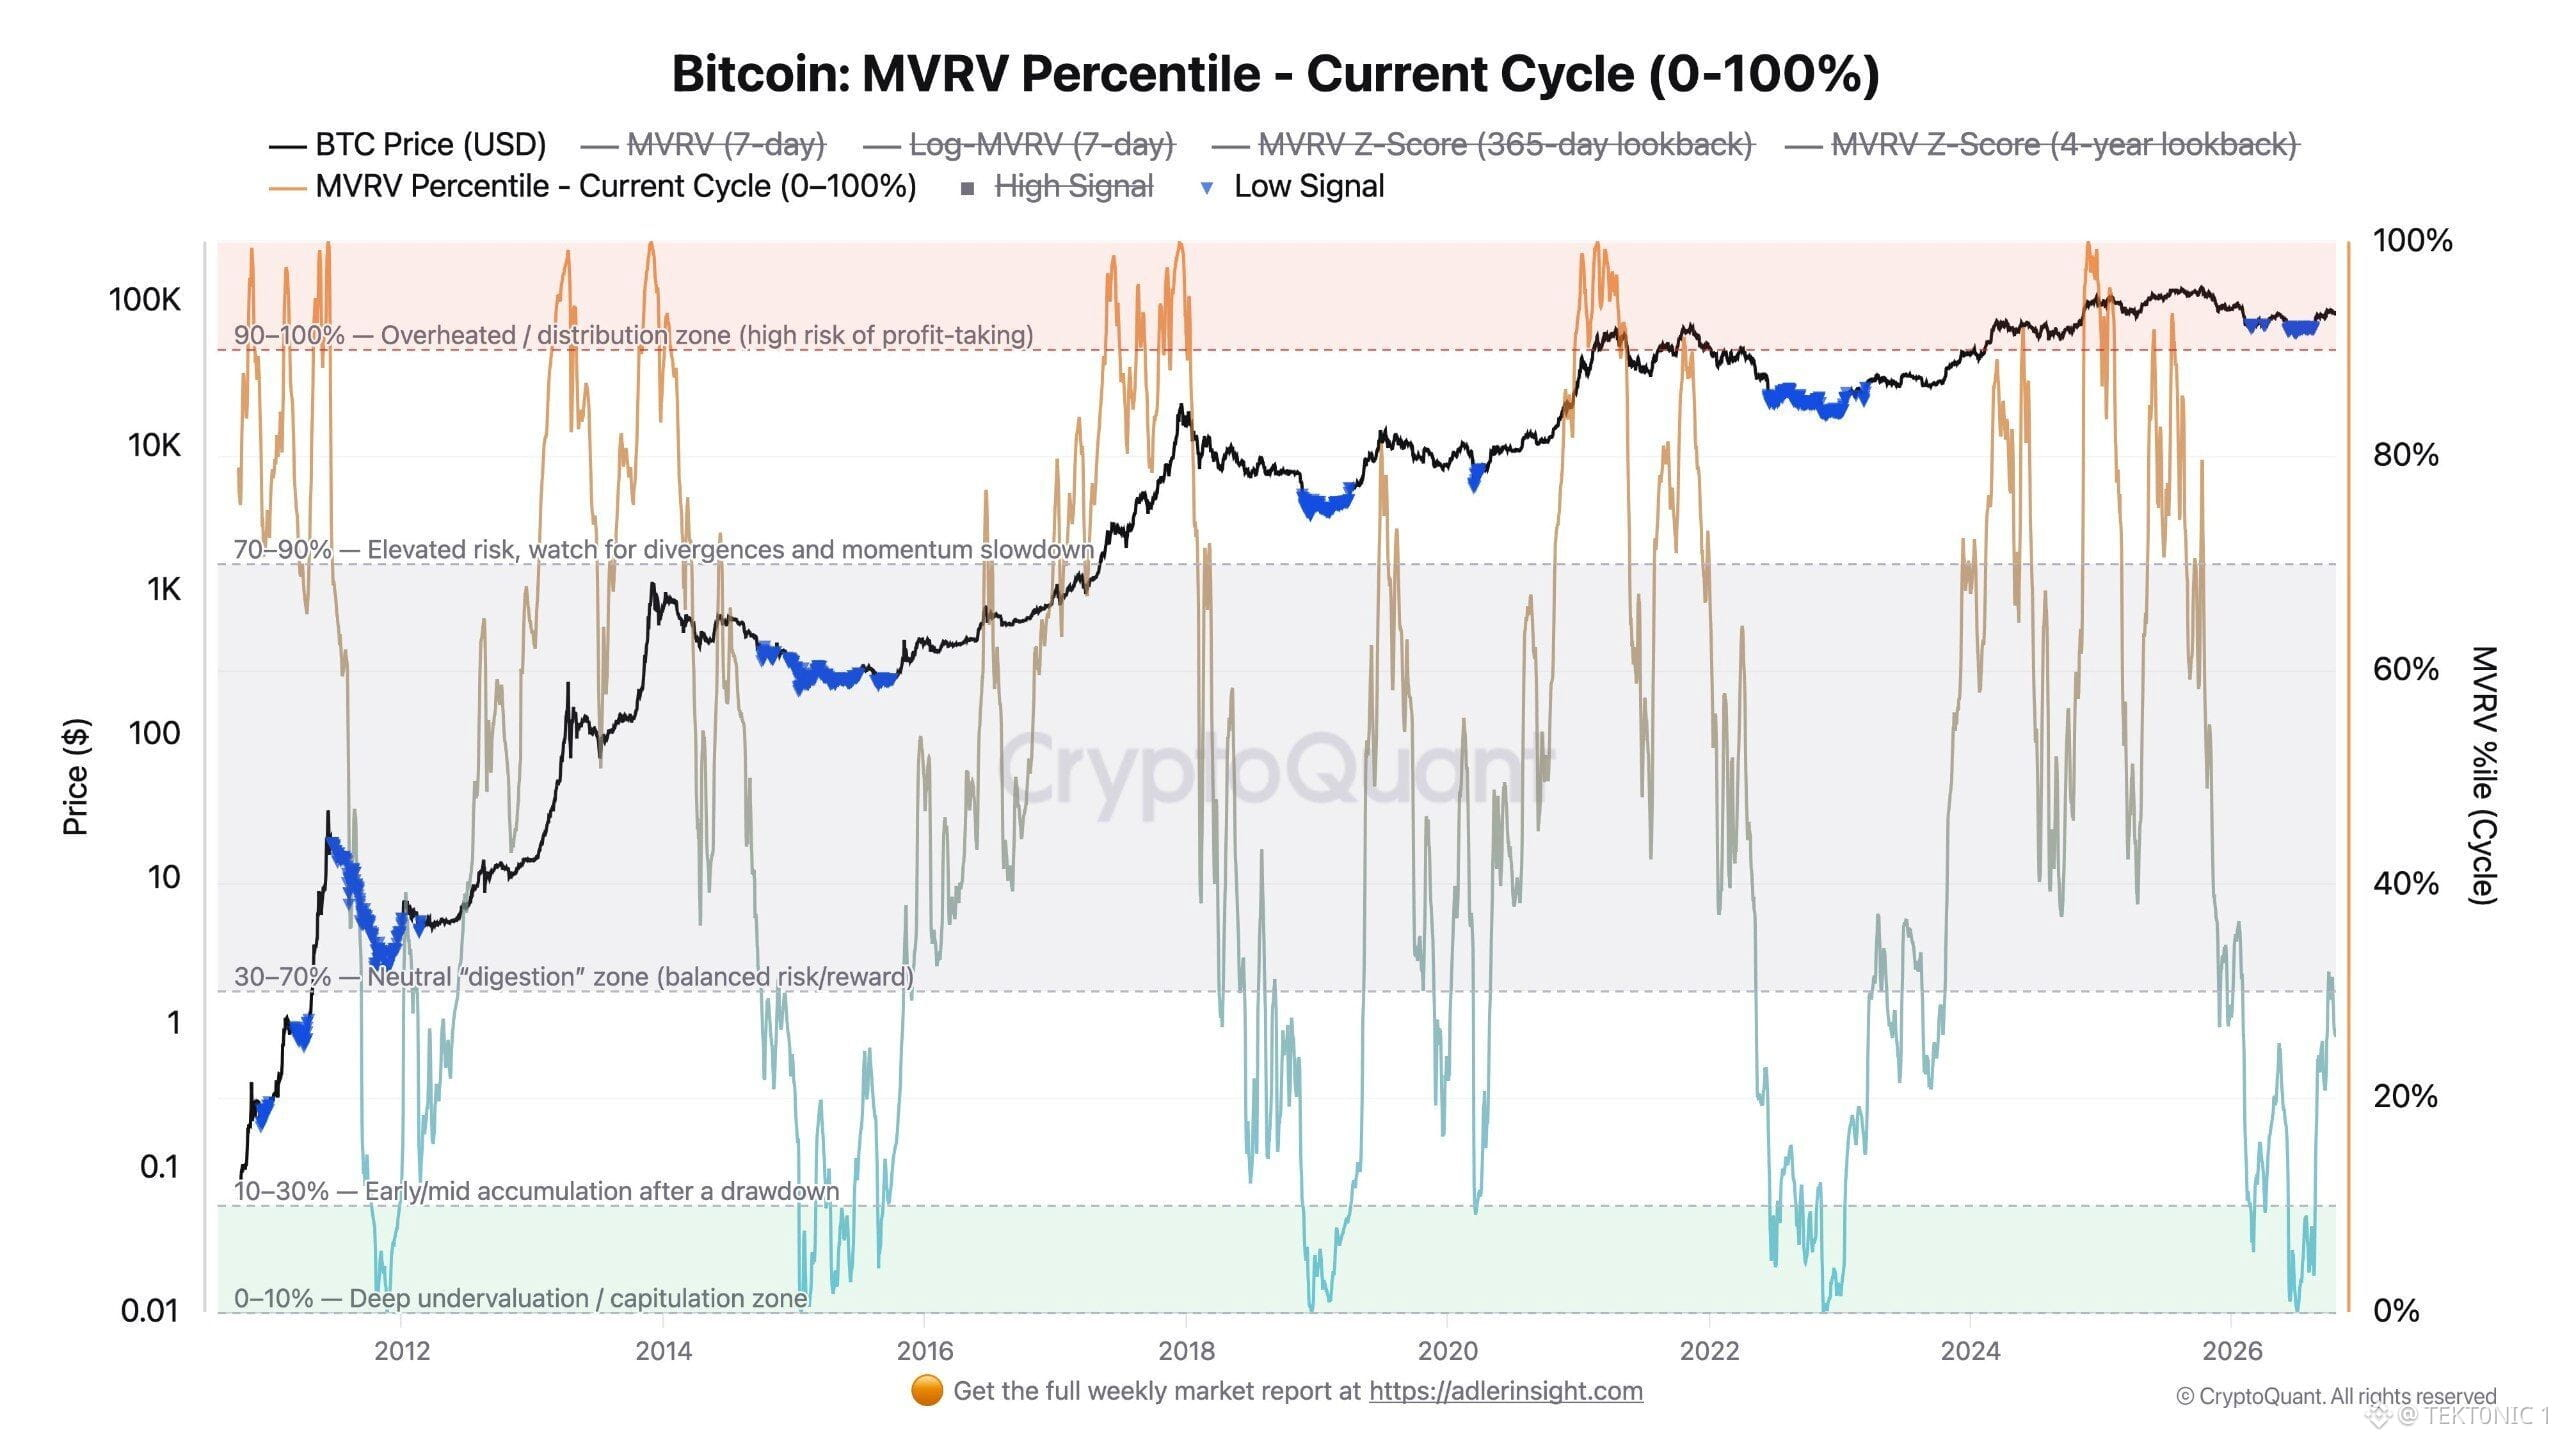
Le Bitcoin a été rejeté près de 87 000 $ et son percentile MVRV est depuis retombé sous le 30e percentile historique. Selon l’analyse de Darkfost, il se situe maintenant autour de 25,7 %, ce qui le place dans la zone d’accumulation du début au milieu du cycle sur le graphique. Le percentile montre comment le MVRV actuel se compare à ses niveaux passés. Le ratio MVRV brut lui-même reste proche de 1,51–1,53, ce qui signifie que le marché dans son ensemble demeure modérément en profit par rapport au prix moyen auquel les pièces ont été déplacées pour la dernière fois. Le $BTC n’a passé qu’environ 25 % de son historique à cette valorisation relative. Les niveaux sous le 30e percentile ont souvent coïncidé avec des phases d’accumulation après des replis, sans toutefois correspondre aux zones de sous-évaluation extrême qui se sont historiquement situées sous les 10 %. Le prix se situe actuellement autour de 81 000–82 000 $, bien en dessous du sommet d’octobre 2025, proche de 126 000 $, et l’indicateur s’est refroidi après la récente tentative de remontée vers 87 000 $. Le graphique indique que la valorisation est entrée dans cette fourchette basse. Cela ne garantit pas un rebond cette semaine. Une seule séance vigoureuse peut encore faire remonter la moyenne, même si les autres journées se terminent en baisse. Le percentile est de retour en zone d’accumulation, mais pas aux plus bas historiques. #Analyse du prix du BTC# #Prévision du prix du Bitcoin : quel sera le prochain mouvement du Bitcoin ?# $BTC $ETH
Le Bitcoin a été rejeté près de 87 000 $ et son percentile MVRV est depuis retombé sous le 30e percentile historique. Selon l’analyse de Darkfost, il se situe maintenant autour de 25,7 %, ce qui le place dans la zone d’accumulation du début au milieu du cycle sur le graphique. Le percentile montre comment le MVRV actuel se compare à ses niveaux passés. Le ratio MVRV brut lui-même reste proche de 1,51–1,53, ce qui signifie que le marché dans son ensemble demeure modérément en profit par rapport au prix moyen auquel les pièces ont été déplacées pour la dernière fois. Le $BTC n’a passé qu’environ 25 % de son historique à cette valorisation relative. Les niveaux sous le 30e percentile ont souvent coïncidé avec des phases d’accumulation après des replis, sans toutefois correspondre aux zones de sous-évaluation extrême qui se sont historiquement situées sous les 10 %. Le prix se situe actuellement autour de 81 000–82 000 $, bien en dessous du sommet d’octobre 2025, proche de 126 000 $, et l’indicateur s’est refroidi après la récente tentative de remontée vers 87 000 $. Le graphique indique que la valorisation est entrée dans cette fourchette basse. Cela ne garantit pas un rebond cette semaine. Une seule séance vigoureuse peut encore faire remonter la moyenne, même si les autres journées se terminent en baisse. Le percentile est de retour en zone d’accumulation, mais pas aux plus bas historiques. #Analyse du prix du BTC# #Prévision du prix du Bitcoin : quel sera le prochain mouvement du Bitcoin ?# $BTC $ETH
34
Connectez-vous pour découvrir plus de contenu
Rejoignez la communauté mondiale des adeptes de cryptomonnaies sur Binance Square
⚡️ Suviez les dernières informations importantes sur les cryptomonnaies.
💬 Jugé digne de confiance par la plus grande plateforme d’échange de cryptomonnaies au monde.
👍 Découvrez les connaissances que partagent les créateurs vérifiés.
Adresse e-mail/Nº de téléphone
Sujets d’actualité
BinancePick
3M vues
152,171 mentions
Rejoignez la #SaisonDesRésultats : prévoyez les résultats sur Binance Pick et partagez votre avis sur Binance Square !
Binance Square Official
·409 mentions J’aime
·342.7k vues
EarningsSeason
5.3M vues
25,852 mentions
AnthropicTTMRevenueGrewAbout1200%
23,672 vues
358 mentions