

ScalpingX TG Channel
4k Publications

ScalpingX TG Channel
Signaler
Bloquer l’utilisateur
1 scalper with unconventional mindset, loves big risks with big profits. Don't ask about the leverage I use, it's always maximum!
0 Suivis
11 Abonnés
9 J’aime
Publications
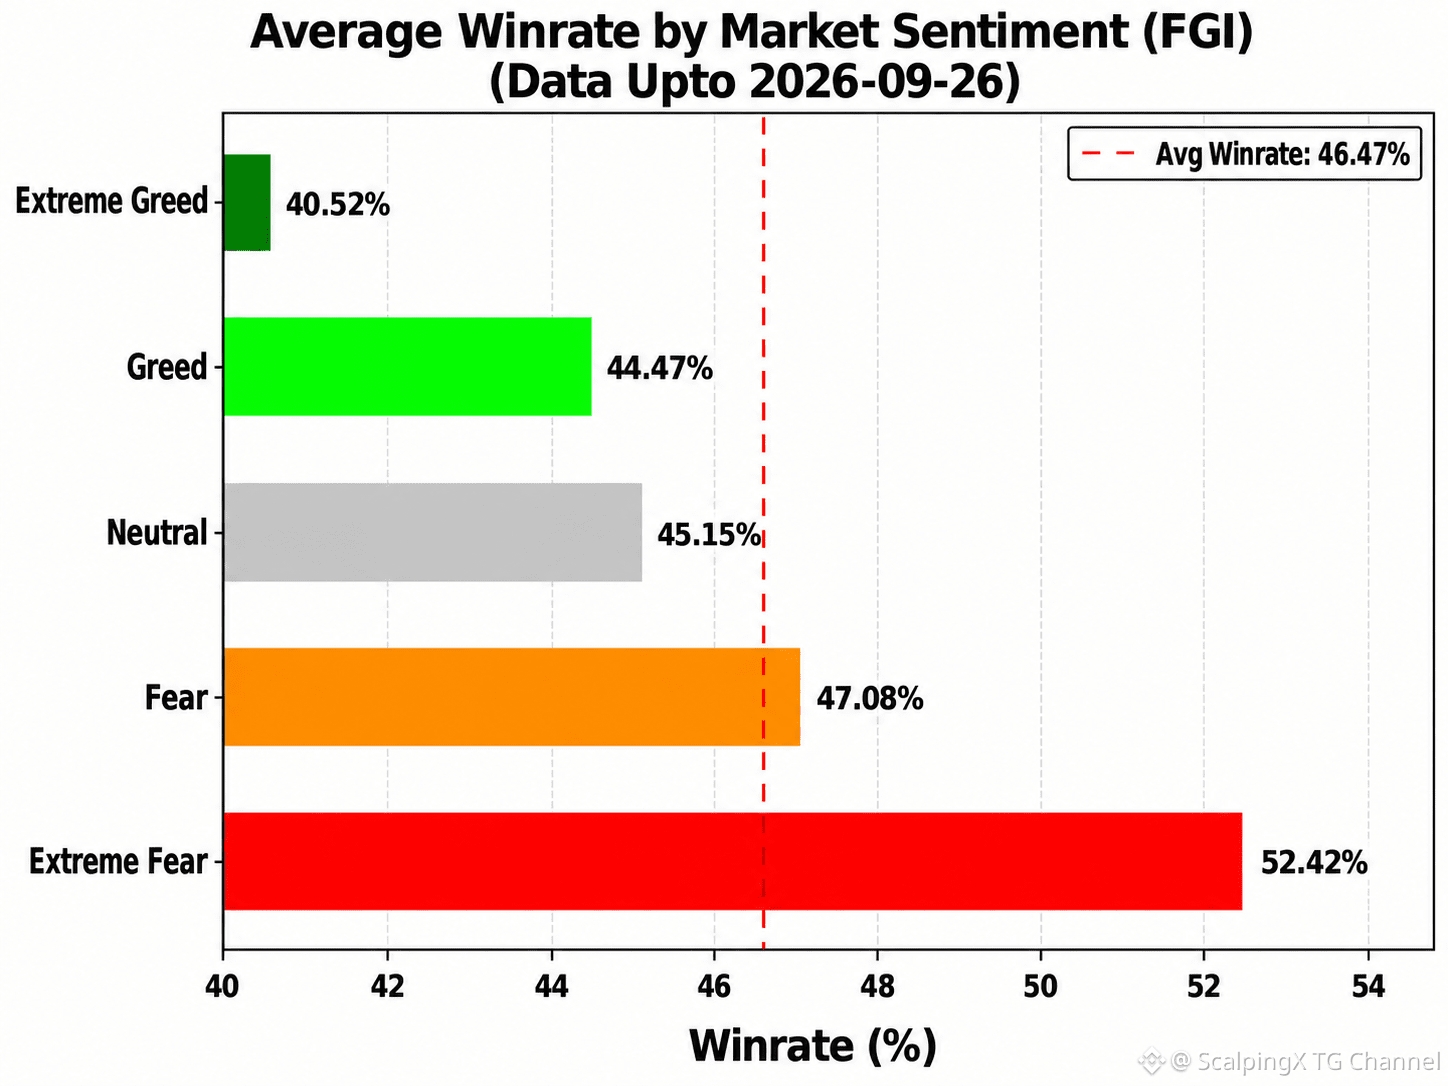
📊 PERFORMANCE DE TRADING ET INDICE DE SENTIMENT DU MARCHÉ (FGI) — RAPPORT MIS À JOUR LE 26/09/2026 Les dernières statistiques montrent que la corrélation entre le FGI et le taux de réussite (Win Rate) reste faible et négative, avec r ≈ -0.304. Cela suggère que le FGI n’est pas adapté comme outil autonome pour déterminer les entrées de trades, mais qu’il peut néanmoins être utile pour quantifier le risque. La performance de trading a généralement tendance à s’affaiblir lorsque le sentiment du marché évolue vers une optimisme extrême, ce qui rend le FGI plus utile comme indicateur précoce d’alerte sur le risque que comme signal pour augmenter les attentes de profit. Voici un résumé du Win Rate (WR), du R:R minimal pour l’équilibre (break-even) et du nombre de jours enregistrés (n) pour chaque zone de sentiment : 🤑 Dérive d’Excès (≥80) : WR 40.5% • R:R=1:1.47 • n=25 😌 Optimisme (60–80) : WR 44.5% • R:R=1:1.25 • n=248 😐 Neutre (40–60) : WR 45.2% • R:R=1:1.21 • n=157 😰 Peur (20–40) : WR 47.1% • R:R=1:1.12 • n=271 😱 Peur Extrême (<20) : WR 52.4% • R:R=1:0.91 • n=115 Pourcentage de jours dépassant le Win Rate global moyen de 46.47% dans chaque zone : 🤑 Dérive d’Excès : 8.0% 😌 Optimisme : 34.7% 😐 Neutre : 38.2% 😰 Peur : 55.7% 😱 Peur Extrême : 67.8% ➤ Les traders à court terme peuvent utiliser le FGI comme référence pour ajuster les objectifs de profit attendus lors de l’entrée en trades : 📈 Lorsque le FGI est élevé, des objectifs de profit plus élevés peuvent être nécessaires pour maintenir un R:R suffisamment favorable et compenser le Win Rate observé plus faible. 📉 Lorsque le FGI est faible, les objectifs de profit peuvent être réduits afin d’accélérer la rotation du capital et de faciliter la concrétisation des profits. #TradingInsights $BTC $ETH $SOL
📊 PERFORMANCE DE TRADING ET INDICE DE SENTIMENT DU MARCHÉ (FGI) — RAPPORT MIS À JOUR LE 26/09/2026 Les dernières statistiques montrent que la corrélation entre le FGI et le taux de réussite (Win Rate) reste faible et négative, avec r ≈ -0.304. Cela suggère que le FGI n’est pas adapté comme outil autonome pour déterminer les entrées de trades, mais qu’il peut néanmoins être utile pour quantifier le risque. La performance de trading a généralement tendance à s’affaiblir lorsque le sentiment du marché évolue vers une optimisme extrême, ce qui rend le FGI plus utile comme indicateur précoce d’alerte sur le risque que comme signal pour augmenter les attentes de profit. Voici un résumé du Win Rate (WR), du R:R minimal pour l’équilibre (break-even) et du nombre de jours enregistrés (n) pour chaque zone de sentiment : 🤑 Dérive d’Excès (≥80) : WR 40.5% • R:R=1:1.47 • n=25 😌 Optimisme (60–80) : WR 44.5% • R:R=1:1.25 • n=248 😐 Neutre (40–60) : WR 45.2% • R:R=1:1.21 • n=157 😰 Peur (20–40) : WR 47.1% • R:R=1:1.12 • n=271 😱 Peur Extrême (<20) : WR 52.4% • R:R=1:0.91 • n=115 Pourcentage de jours dépassant le Win Rate global moyen de 46.47% dans chaque zone : 🤑 Dérive d’Excès : 8.0% 😌 Optimisme : 34.7% 😐 Neutre : 38.2% 😰 Peur : 55.7% 😱 Peur Extrême : 67.8% ➤ Les traders à court terme peuvent utiliser le FGI comme référence pour ajuster les objectifs de profit attendus lors de l’entrée en trades : 📈 Lorsque le FGI est élevé, des objectifs de profit plus élevés peuvent être nécessaires pour maintenir un R:R suffisamment favorable et compenser le Win Rate observé plus faible. 📉 Lorsque le FGI est faible, les objectifs de profit peuvent être réduits afin d’accélérer la rotation du capital et de faciliter la concrétisation des profits. #TradingInsights $BTC $ETH $SOL
33
Voir la traduction
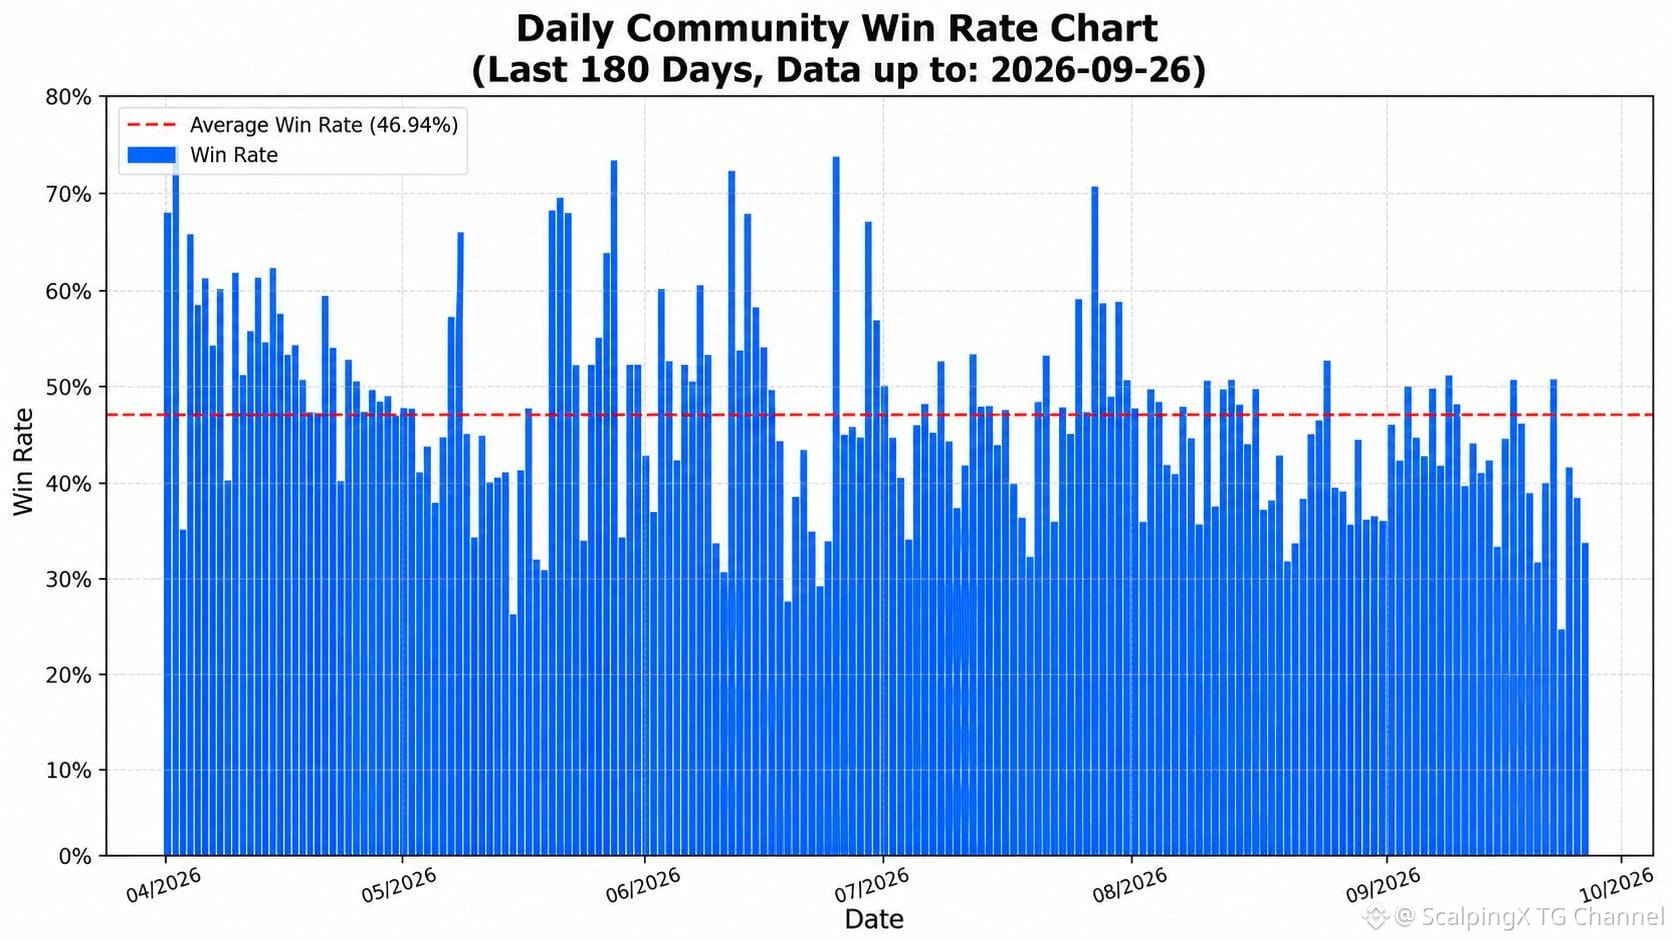
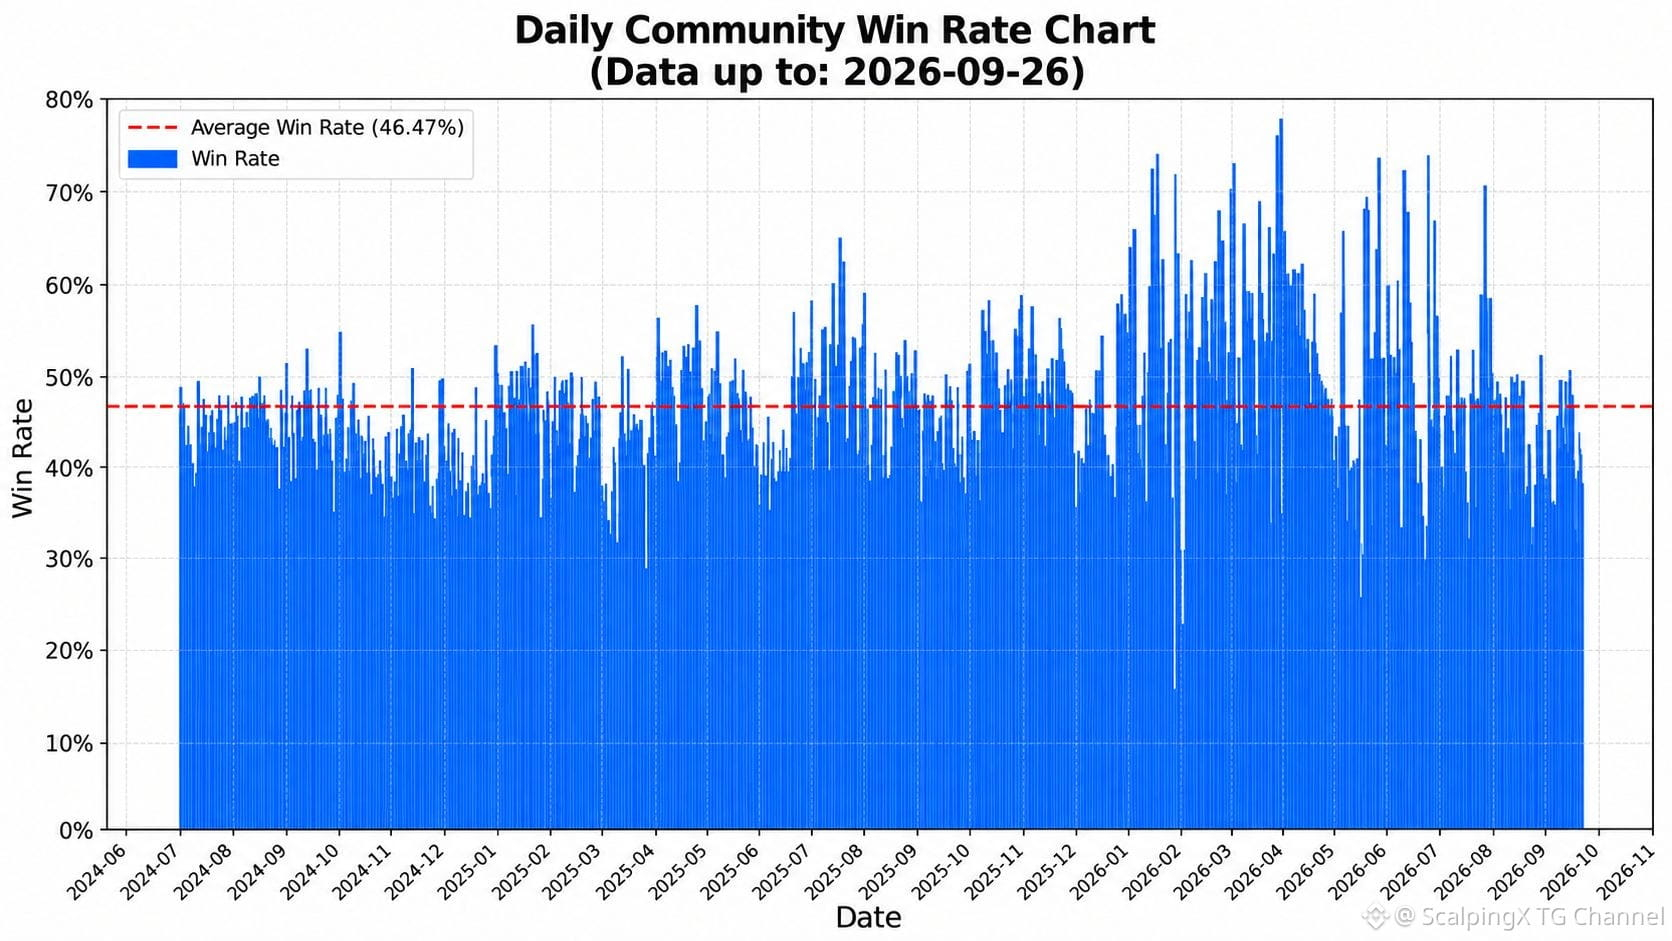
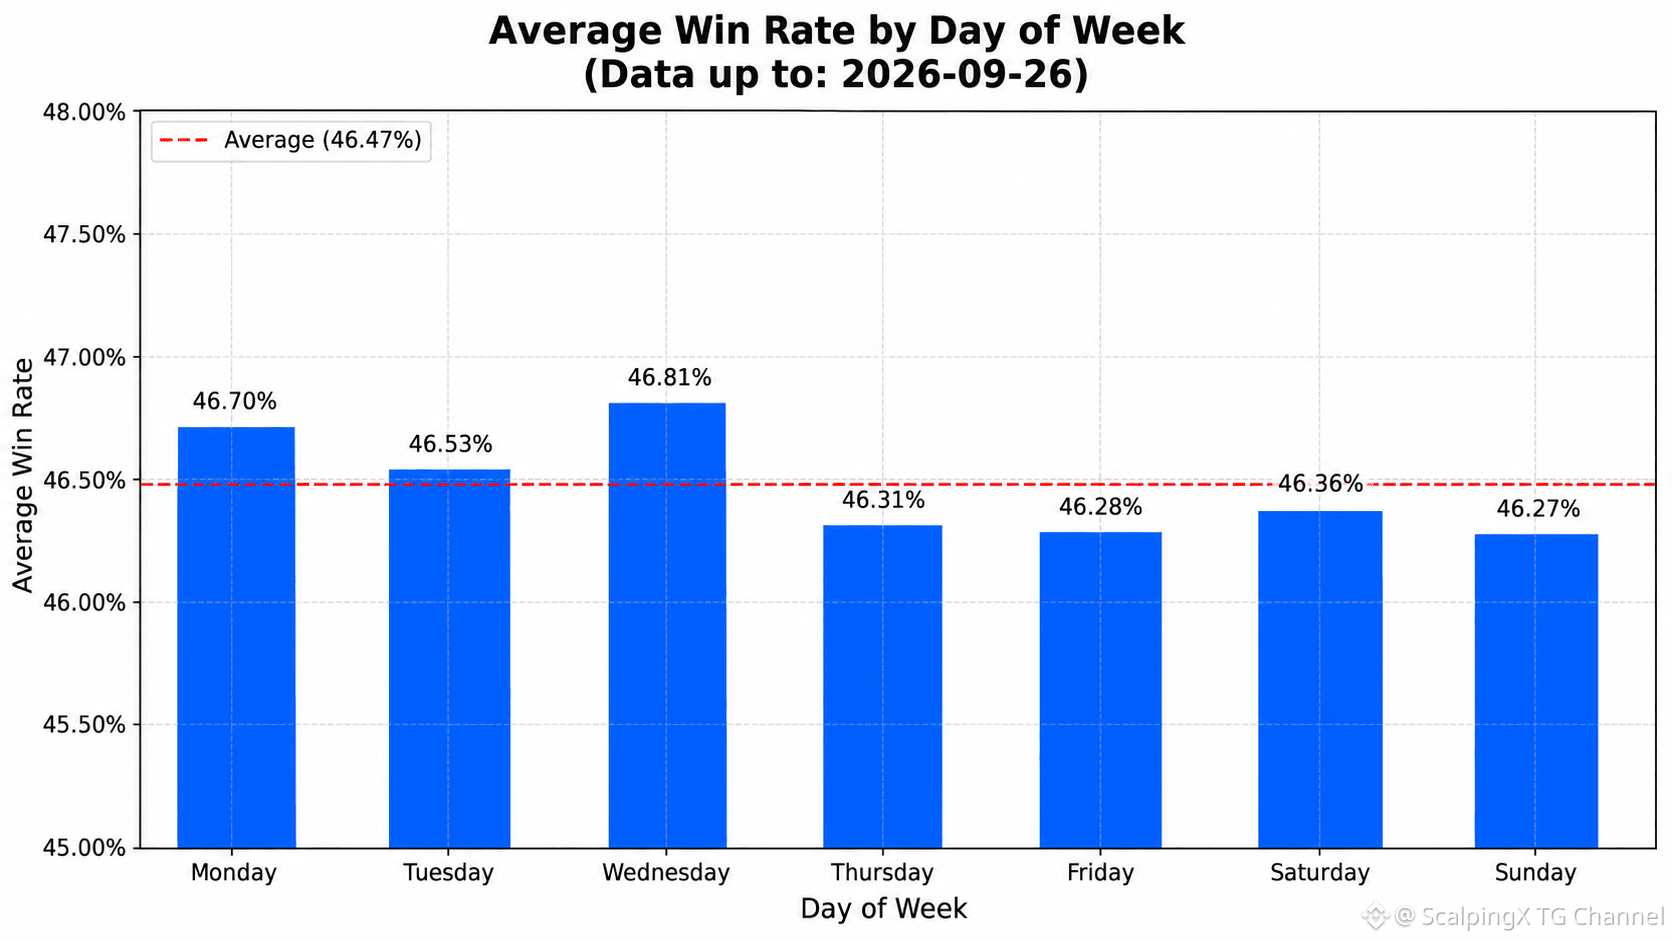
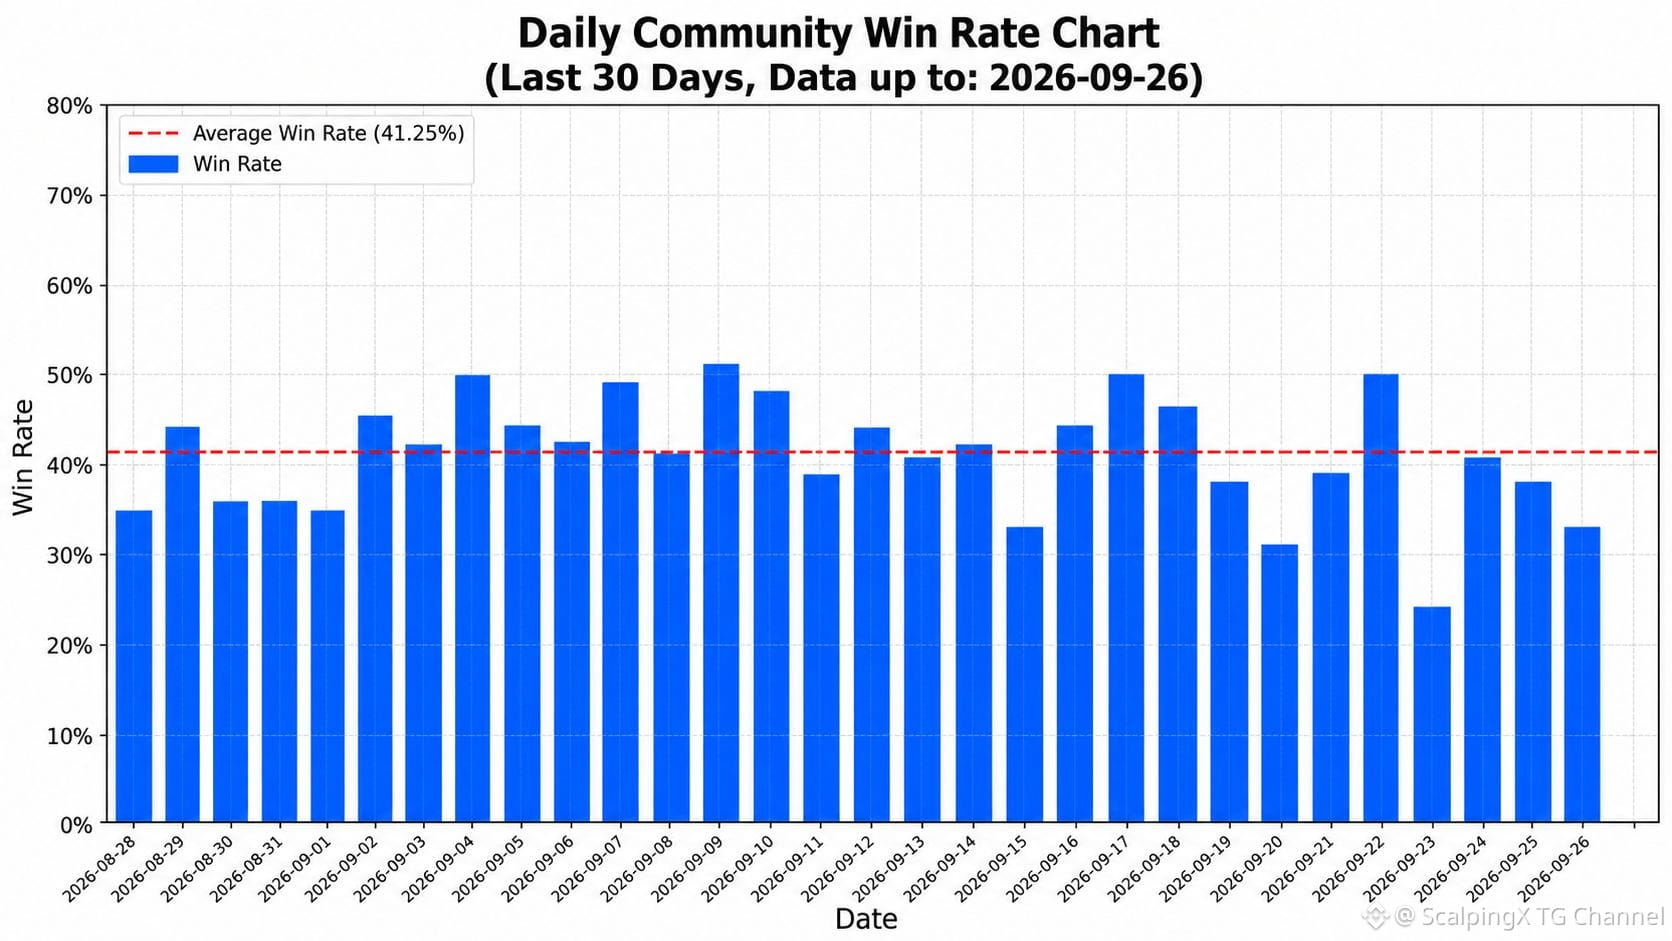
Updated 2026-09-26, community-wide trading data: 📊 The average win rate is 46.47% 🏆 The highest daily win rate was 78.08% on 2026-04-01. The lowest was 15.69% on 2026-01-25 📅 Wednesday has the highest average win rate at 46.81%. Sunday has the lowest average win rate at 46.27% ⏱️ The highest 7-day average win rate was 63.27% for the period ending 2026-04-05. The lowest was 35.60% for the period ending 2026-06-24 ⚖️ There were 377 days with a win rate above the overall average and 439 days with a win rate at or below the average 📈 There were 224 days with a win rate above 50%, 436 days between 40% and 50%, and 156 days below 40% #TradingStats $GRAM
Updated 2026-09-26, community-wide trading data: 📊 The average win rate is 46.47% 🏆 The highest daily win rate was 78.08% on 2026-04-01. The lowest was 15.69% on 2026-01-25 📅 Wednesday has the highest average win rate at 46.81%. Sunday has the lowest average win rate at 46.27% ⏱️ The highest 7-day average win rate was 63.27% for the period ending 2026-04-05. The lowest was 35.60% for the period ending 2026-06-24 ⚖️ There were 377 days with a win rate above the overall average and 439 days with a win rate at or below the average 📈 There were 224 days with a win rate above 50%, 436 days between 40% and 50%, and 156 days below 40% #TradingStats $GRAM
29
Voir la traduction
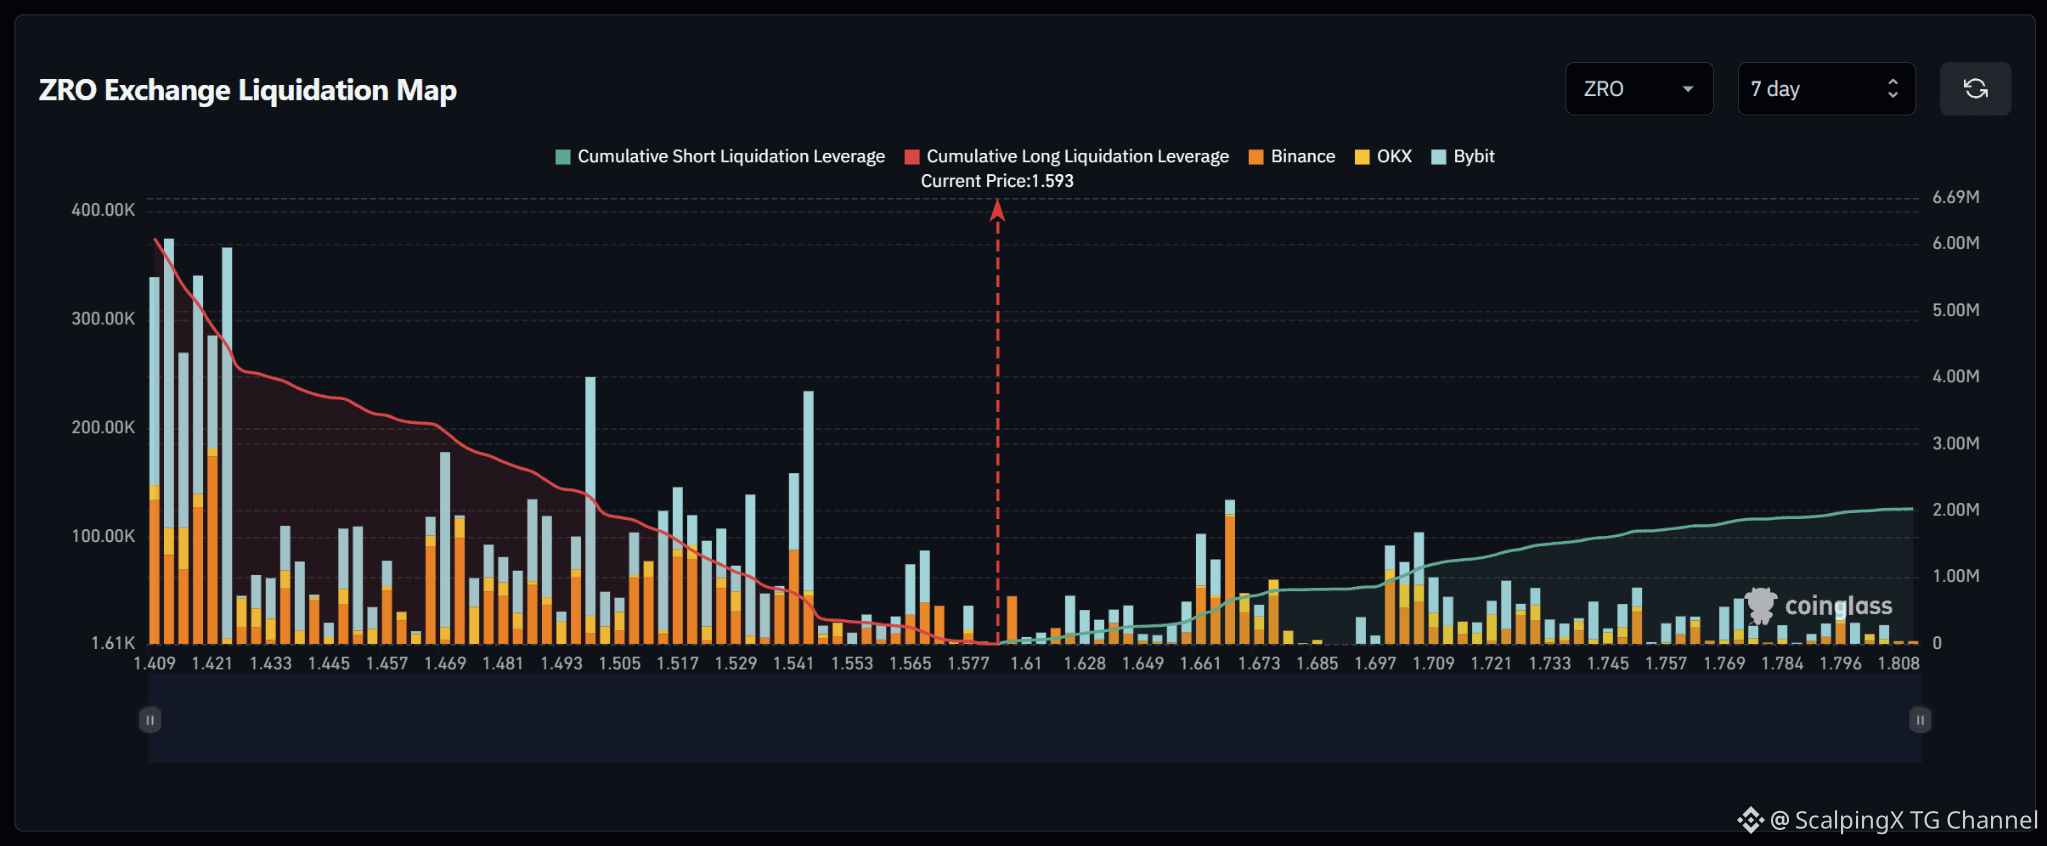
$ZRO – Liquidation Map (7 Days) – Current Price 1.593 🔎 The 7-day liquidation map shows roughly 6 million USD in long liquidations below the current price, significantly exceeding approximately 2 million USD in short liquidations above. The liquidity structure therefore clearly tilts to the downside, with around three times more cumulative liquidity below the market. 📉 Below the market, long-liquidation liquidity is broadly distributed across 1.41–1.55. The strongest cluster sits around 1.409–1.423 with several bars near 0.27–0.38 million USD, while 1.493–1.505 and 1.535–1.543 also contain notable bars around 0.23–0.25 million USD. Losing 1.577 would shift attention toward 1.565–1.541 and then 1.517–1.493. 📈 Above the market, short-liquidation liquidity is generally thinner. The nearest notable cluster sits around 1.658–1.667 with a bar near 0.13 million USD, while 1.697–1.709 contains several bars around 0.09–0.10 million USD. Beyond 1.72, liquidity becomes increasingly dispersed. 🧭 The broader setup favors the downside because long-liquidation exposure below clearly dominates. Losing 1.577 would increase the probability of a sweep toward 1.565–1.541, followed by 1.517–1.493. Breaking above 1.61 would instead expose 1.658–1.667 and then 1.697–1.709.
$ZRO – Liquidation Map (7 Days) – Current Price 1.593 🔎 The 7-day liquidation map shows roughly 6 million USD in long liquidations below the current price, significantly exceeding approximately 2 million USD in short liquidations above. The liquidity structure therefore clearly tilts to the downside, with around three times more cumulative liquidity below the market. 📉 Below the market, long-liquidation liquidity is broadly distributed across 1.41–1.55. The strongest cluster sits around 1.409–1.423 with several bars near 0.27–0.38 million USD, while 1.493–1.505 and 1.535–1.543 also contain notable bars around 0.23–0.25 million USD. Losing 1.577 would shift attention toward 1.565–1.541 and then 1.517–1.493. 📈 Above the market, short-liquidation liquidity is generally thinner. The nearest notable cluster sits around 1.658–1.667 with a bar near 0.13 million USD, while 1.697–1.709 contains several bars around 0.09–0.10 million USD. Beyond 1.72, liquidity becomes increasingly dispersed. 🧭 The broader setup favors the downside because long-liquidation exposure below clearly dominates. Losing 1.577 would increase the probability of a sweep toward 1.565–1.541, followed by 1.517–1.493. Breaking above 1.61 would instead expose 1.658–1.667 and then 1.697–1.709.
41
Voir la traduction
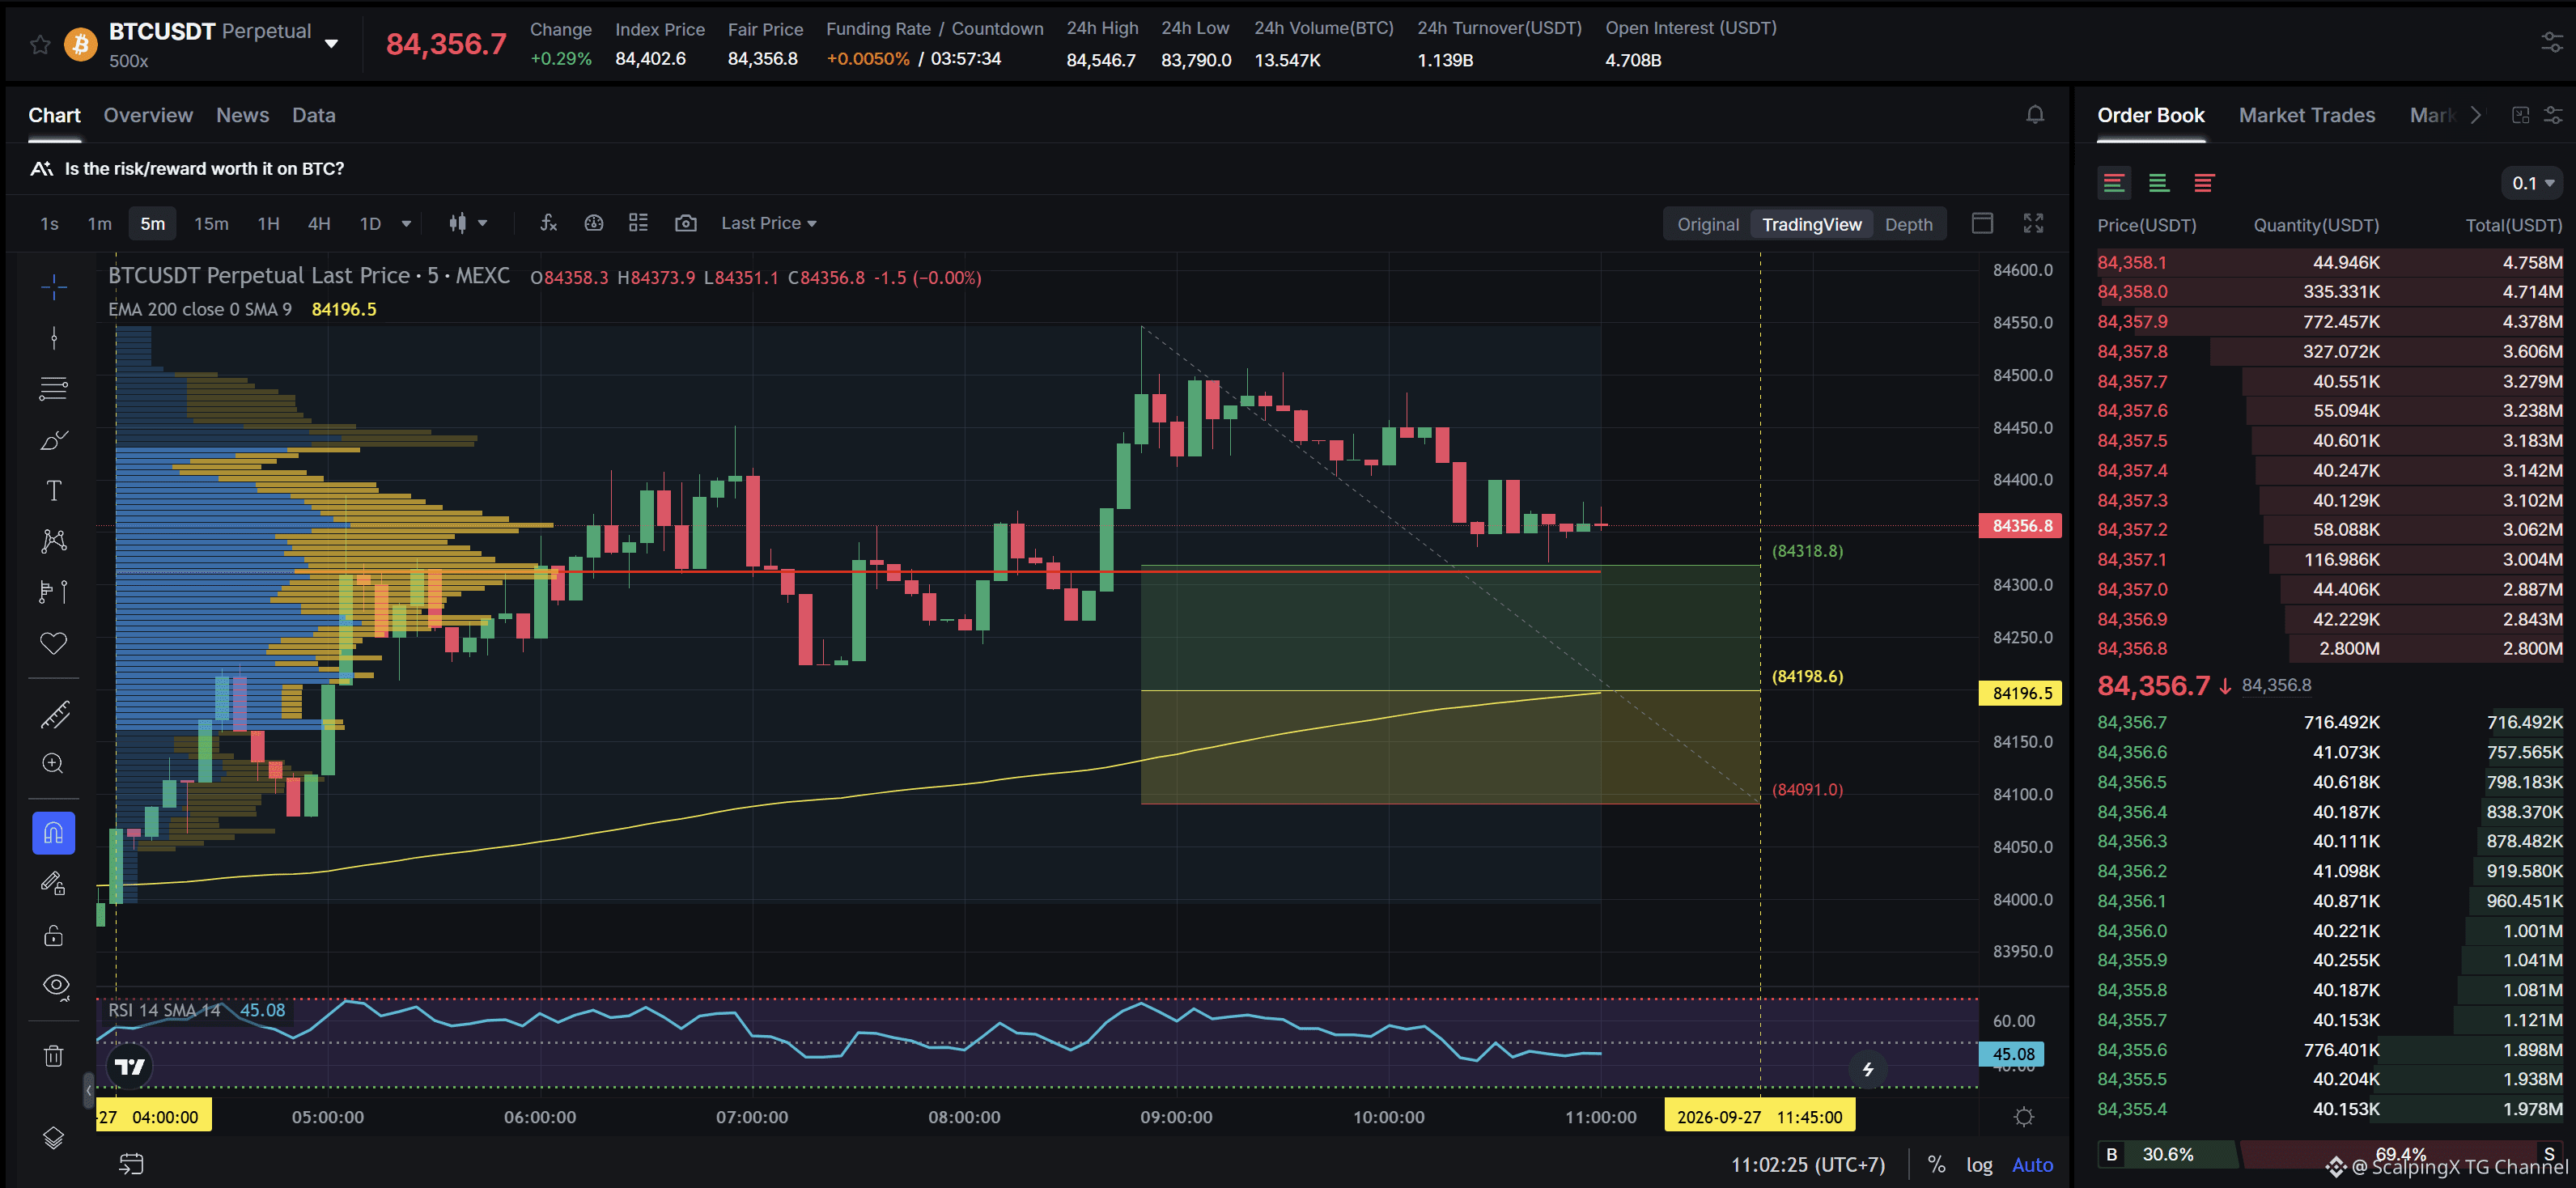
$BTC - Mcap 1.69T$ - 24h Sentiment +2.97 Bullish SC02 M5 - pending Long order. Entry lies within LVN + not affected by any weak zone, the current support zone is approximately 0.13% wide. The uptrend has lasted 7 hours, with a maximum recorded price increase of 0.64%. If price loses this support zone, the trend is highly likely to reverse downward.
$BTC - Mcap 1.69T$ - 24h Sentiment +2.97 Bullish SC02 M5 - pending Long order. Entry lies within LVN + not affected by any weak zone, the current support zone is approximately 0.13% wide. The uptrend has lasted 7 hours, with a maximum recorded price increase of 0.64%. If price loses this support zone, the trend is highly likely to reverse downward.
44
Voir la traduction
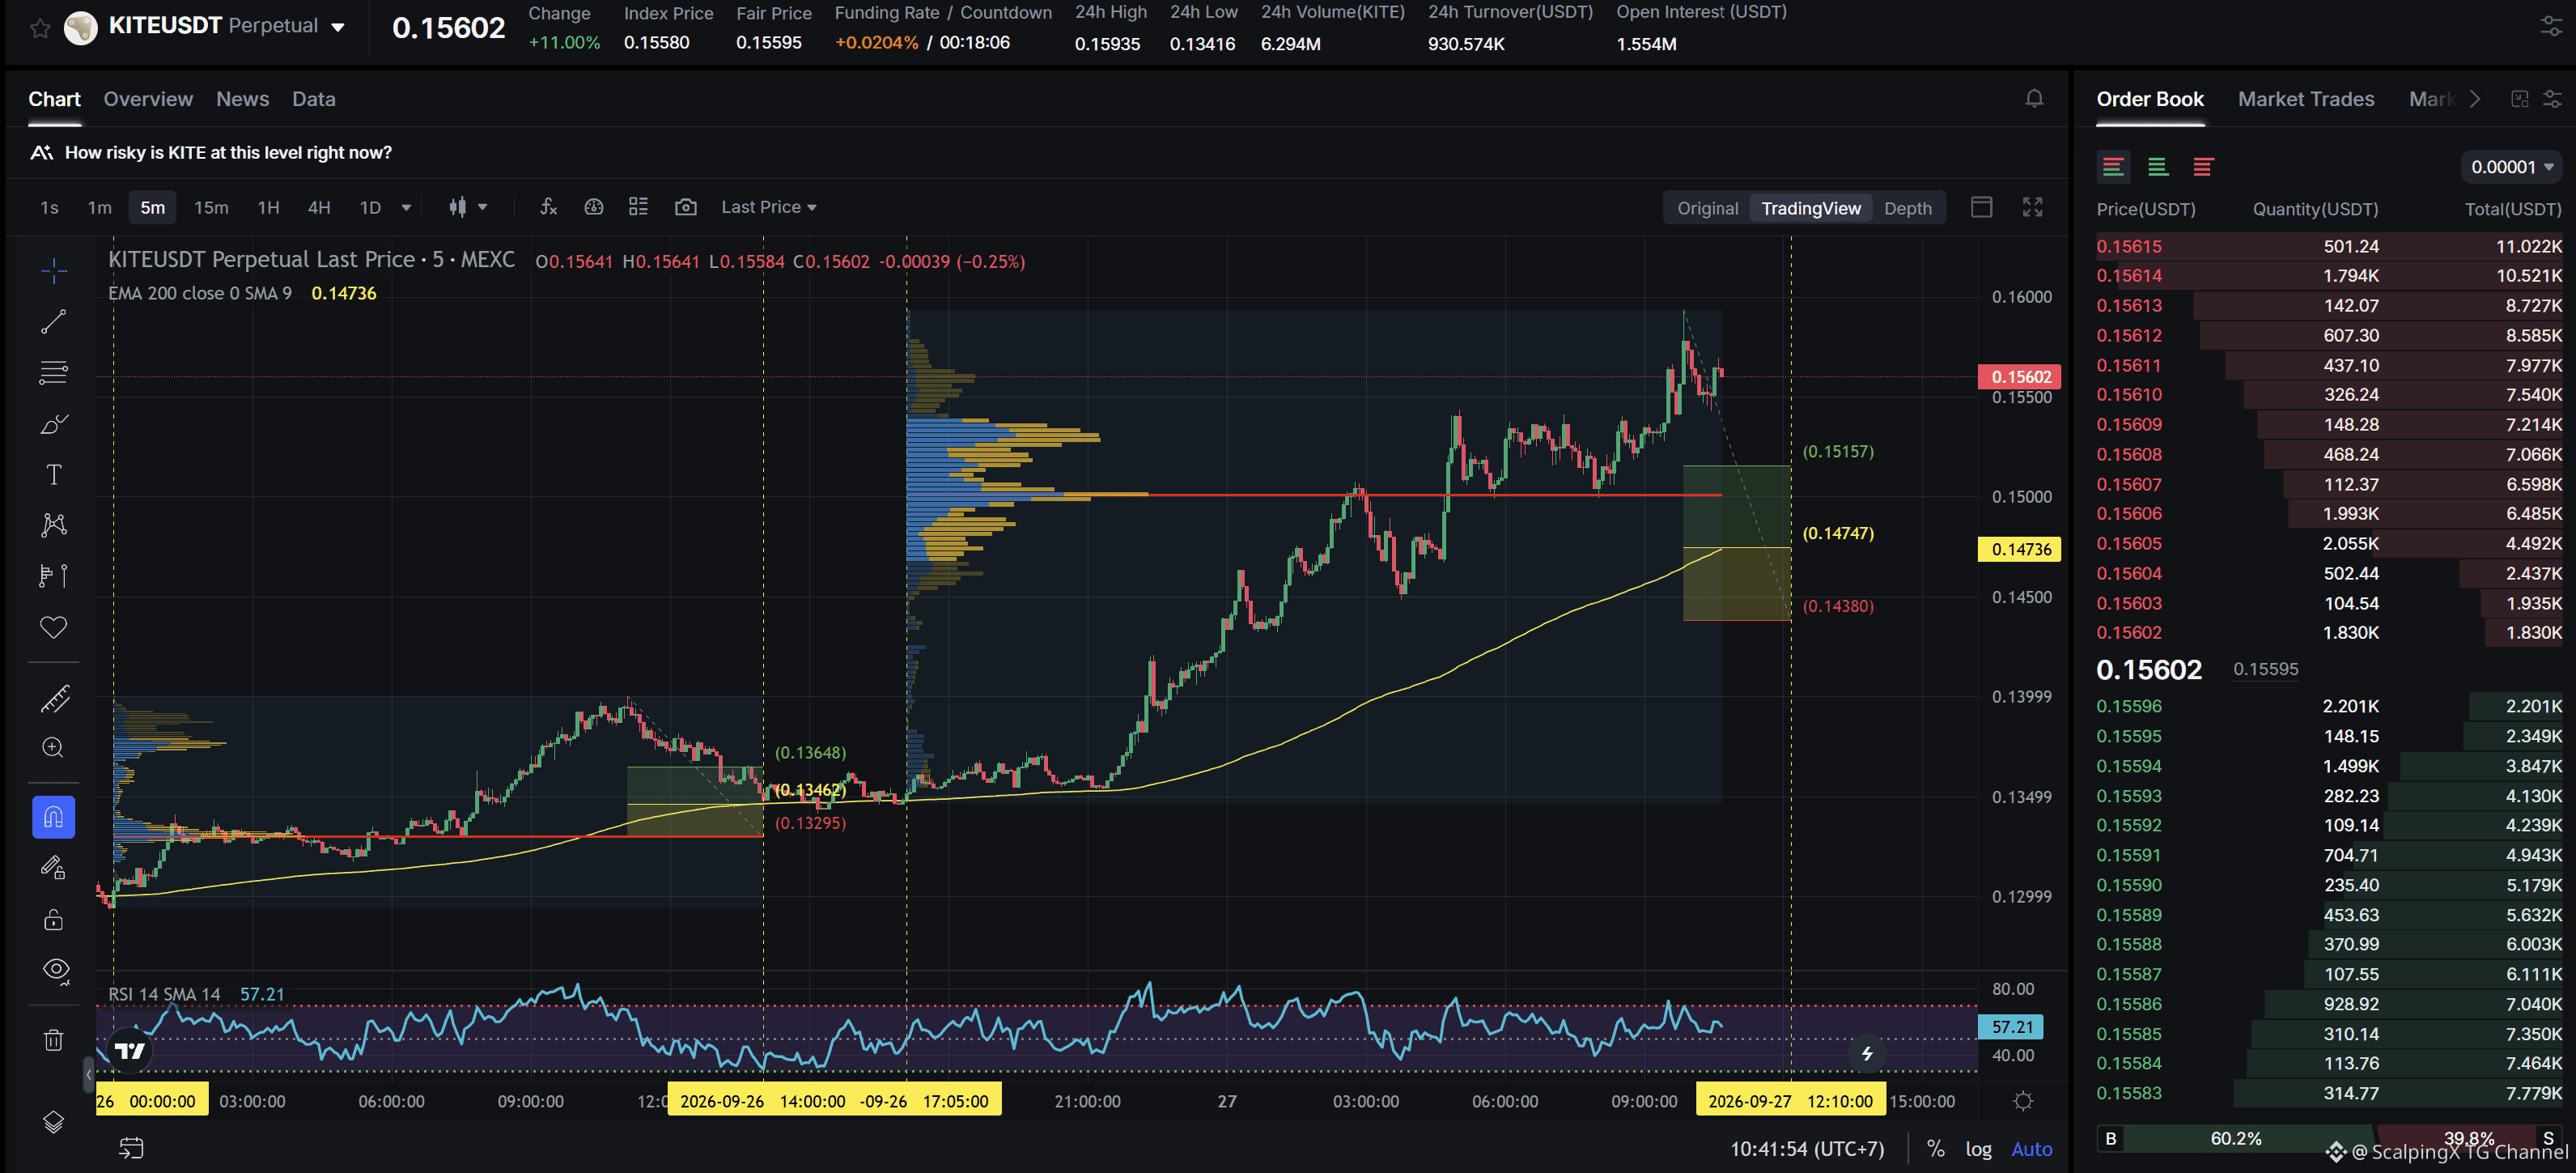
$KITE - Mcap 391.58M$ - 24h Sentiment +5.55 Bullish SC02 M5 - pending Long order. Entry lies within LVN + meets positive simplification with a previously highly profitable Long order, the current support zone is approximately 2.50% wide. The uptrend has lasted 17 hours 35 minutes, with a maximum recorded price increase of 18.09%. If price loses this support zone, the trend is highly likely to reverse downward.
$KITE - Mcap 391.58M$ - 24h Sentiment +5.55 Bullish SC02 M5 - pending Long order. Entry lies within LVN + meets positive simplification with a previously highly profitable Long order, the current support zone is approximately 2.50% wide. The uptrend has lasted 17 hours 35 minutes, with a maximum recorded price increase of 18.09%. If price loses this support zone, the trend is highly likely to reverse downward.
64
Voir la traduction
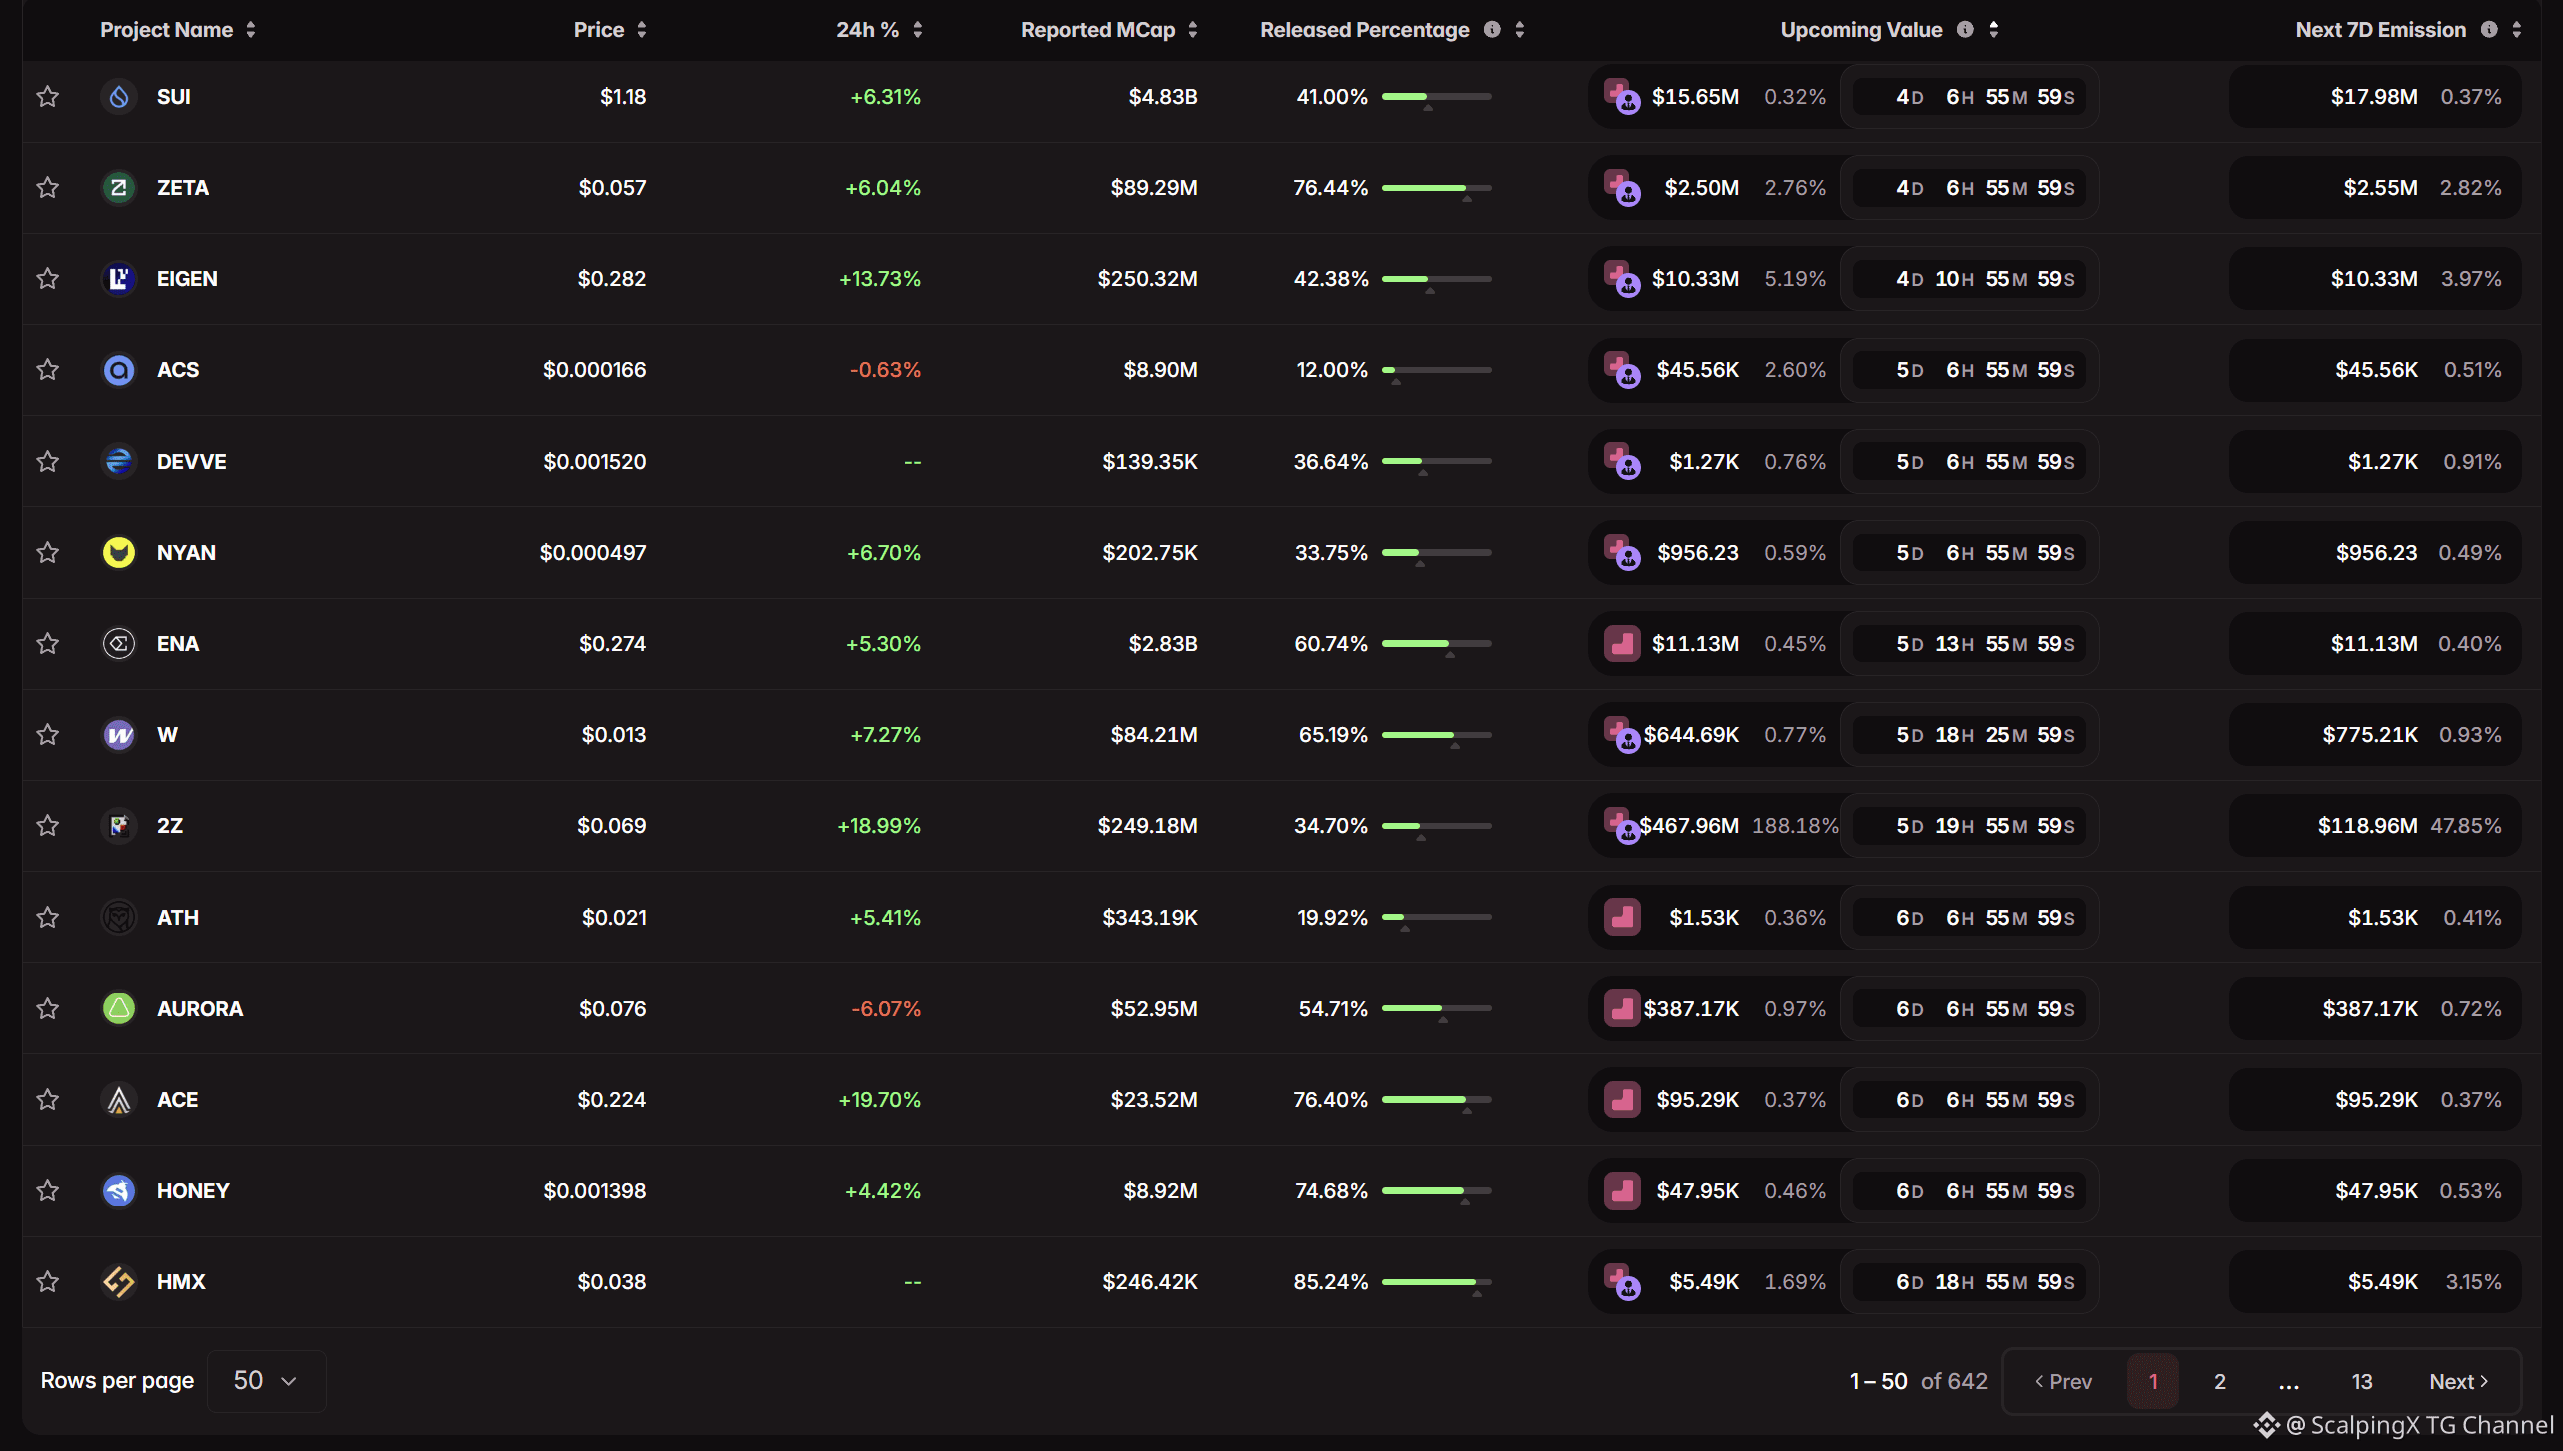
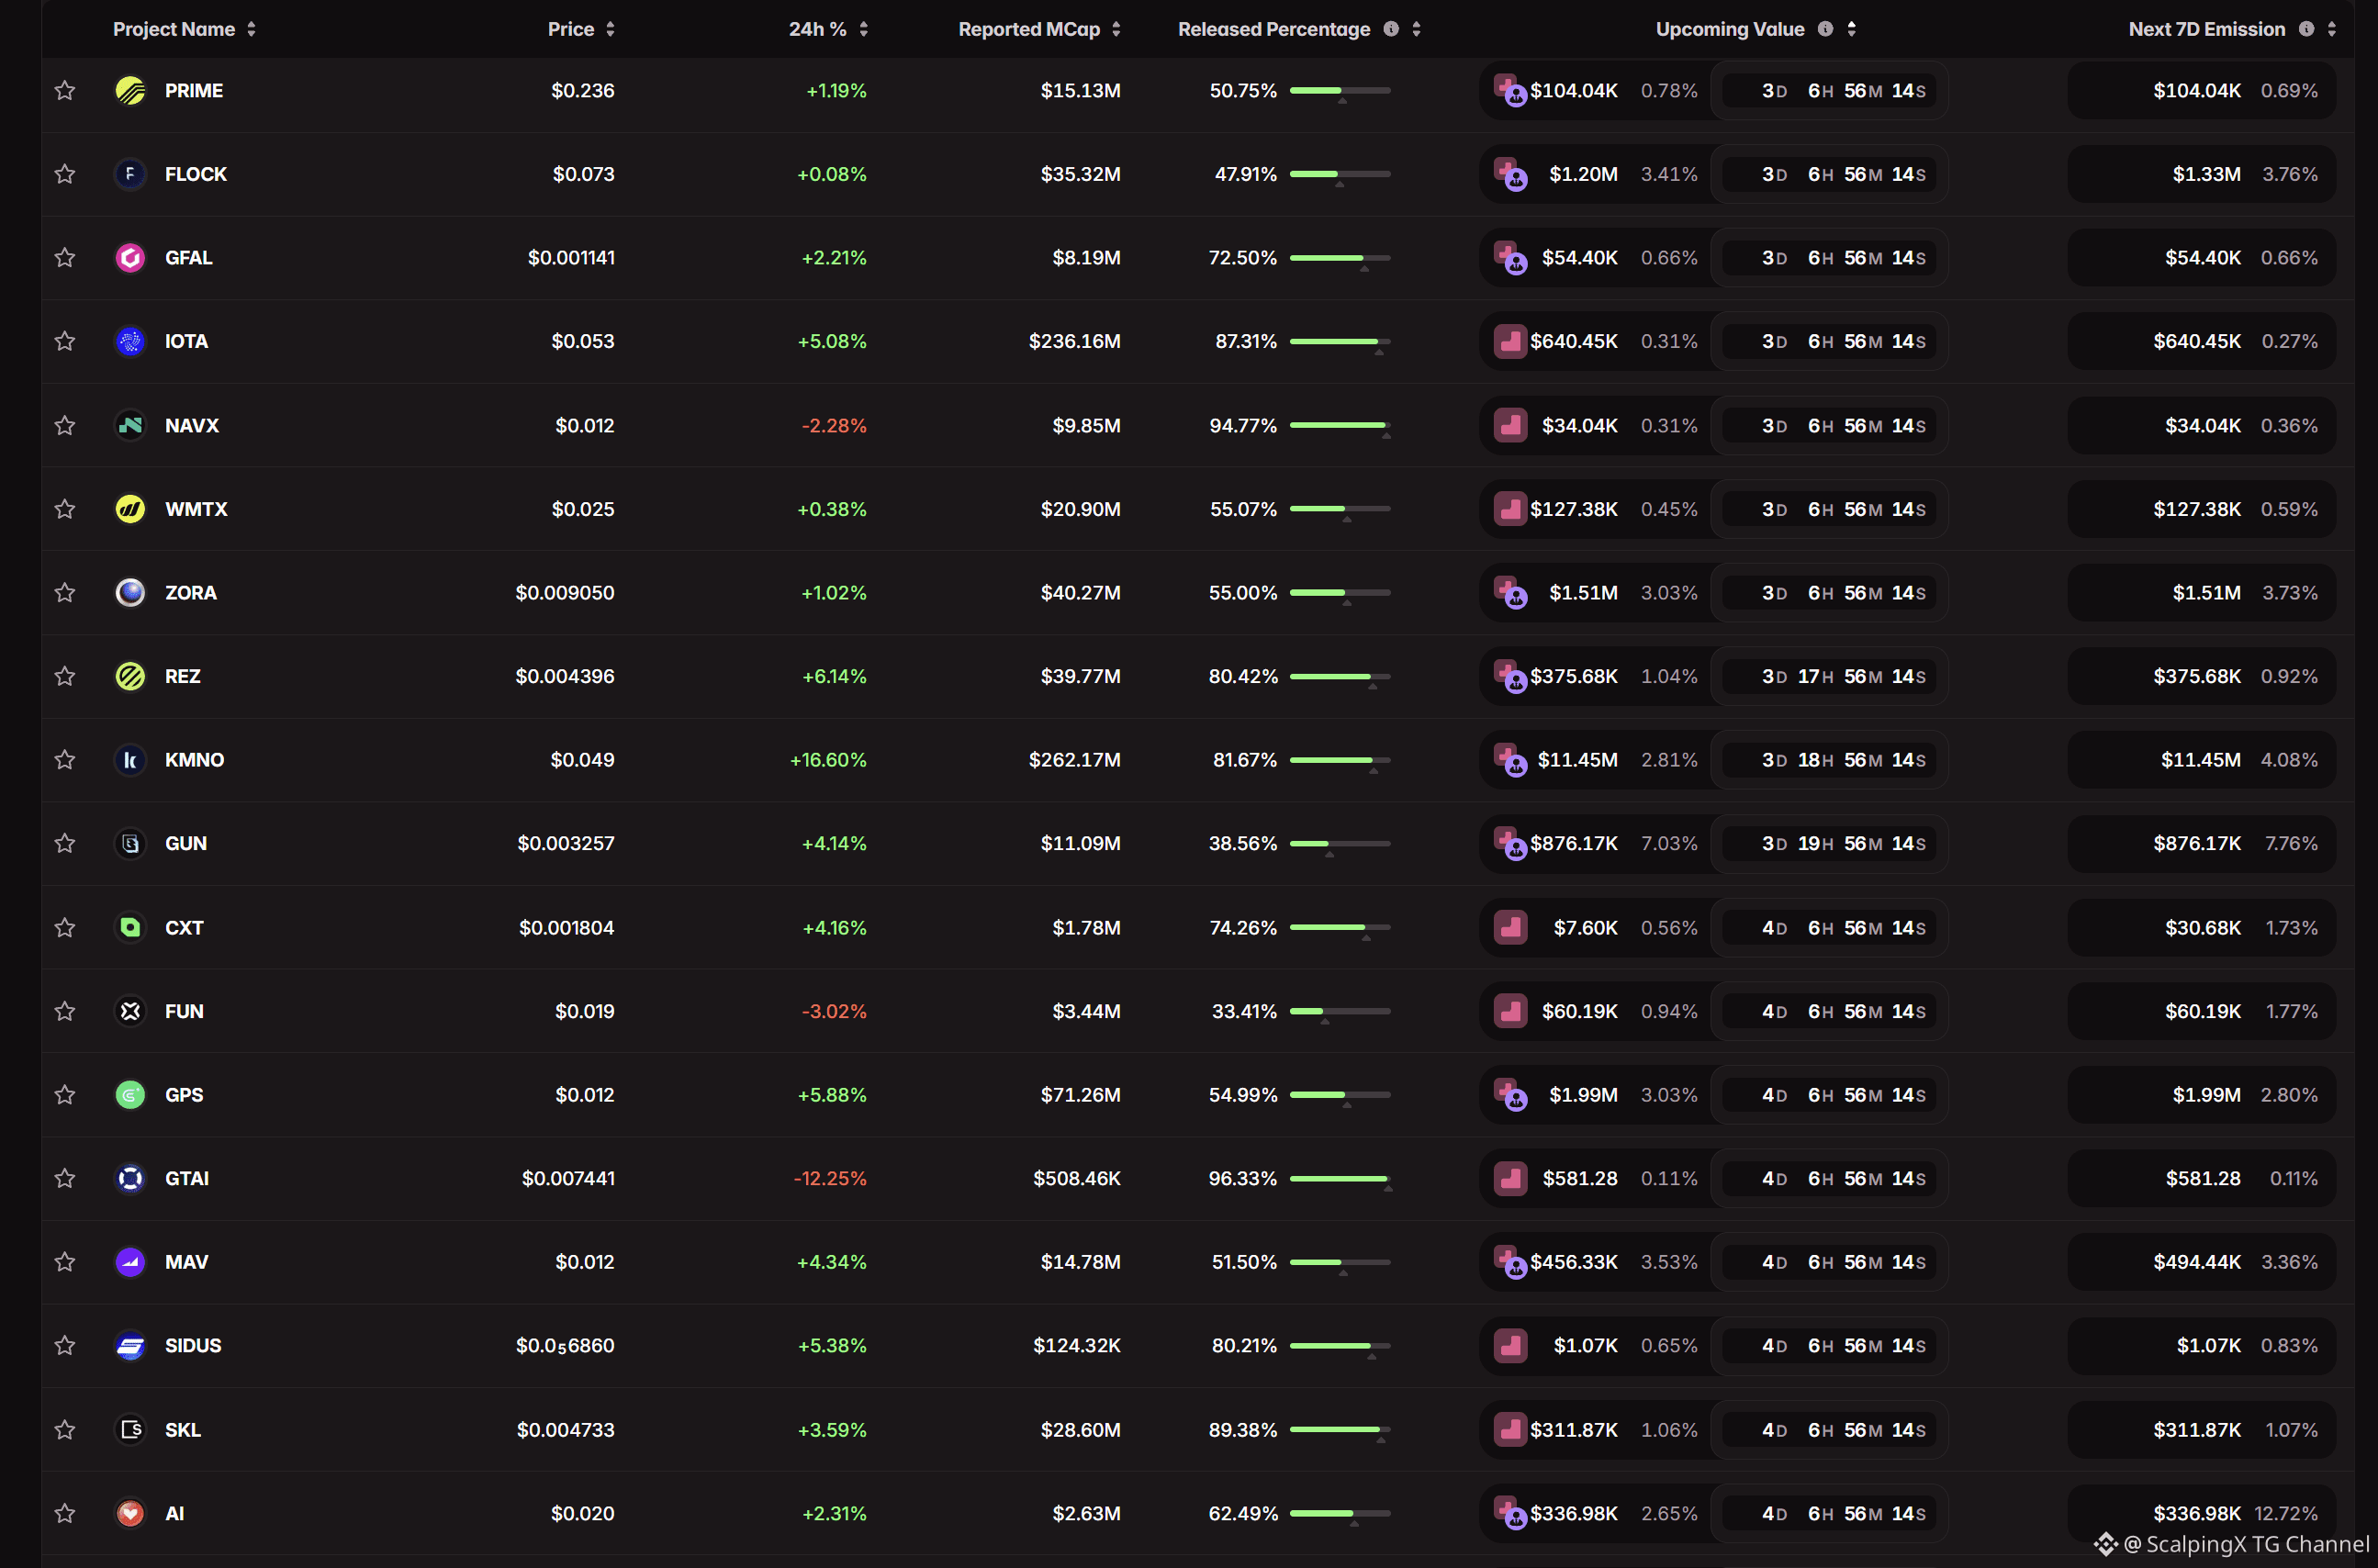
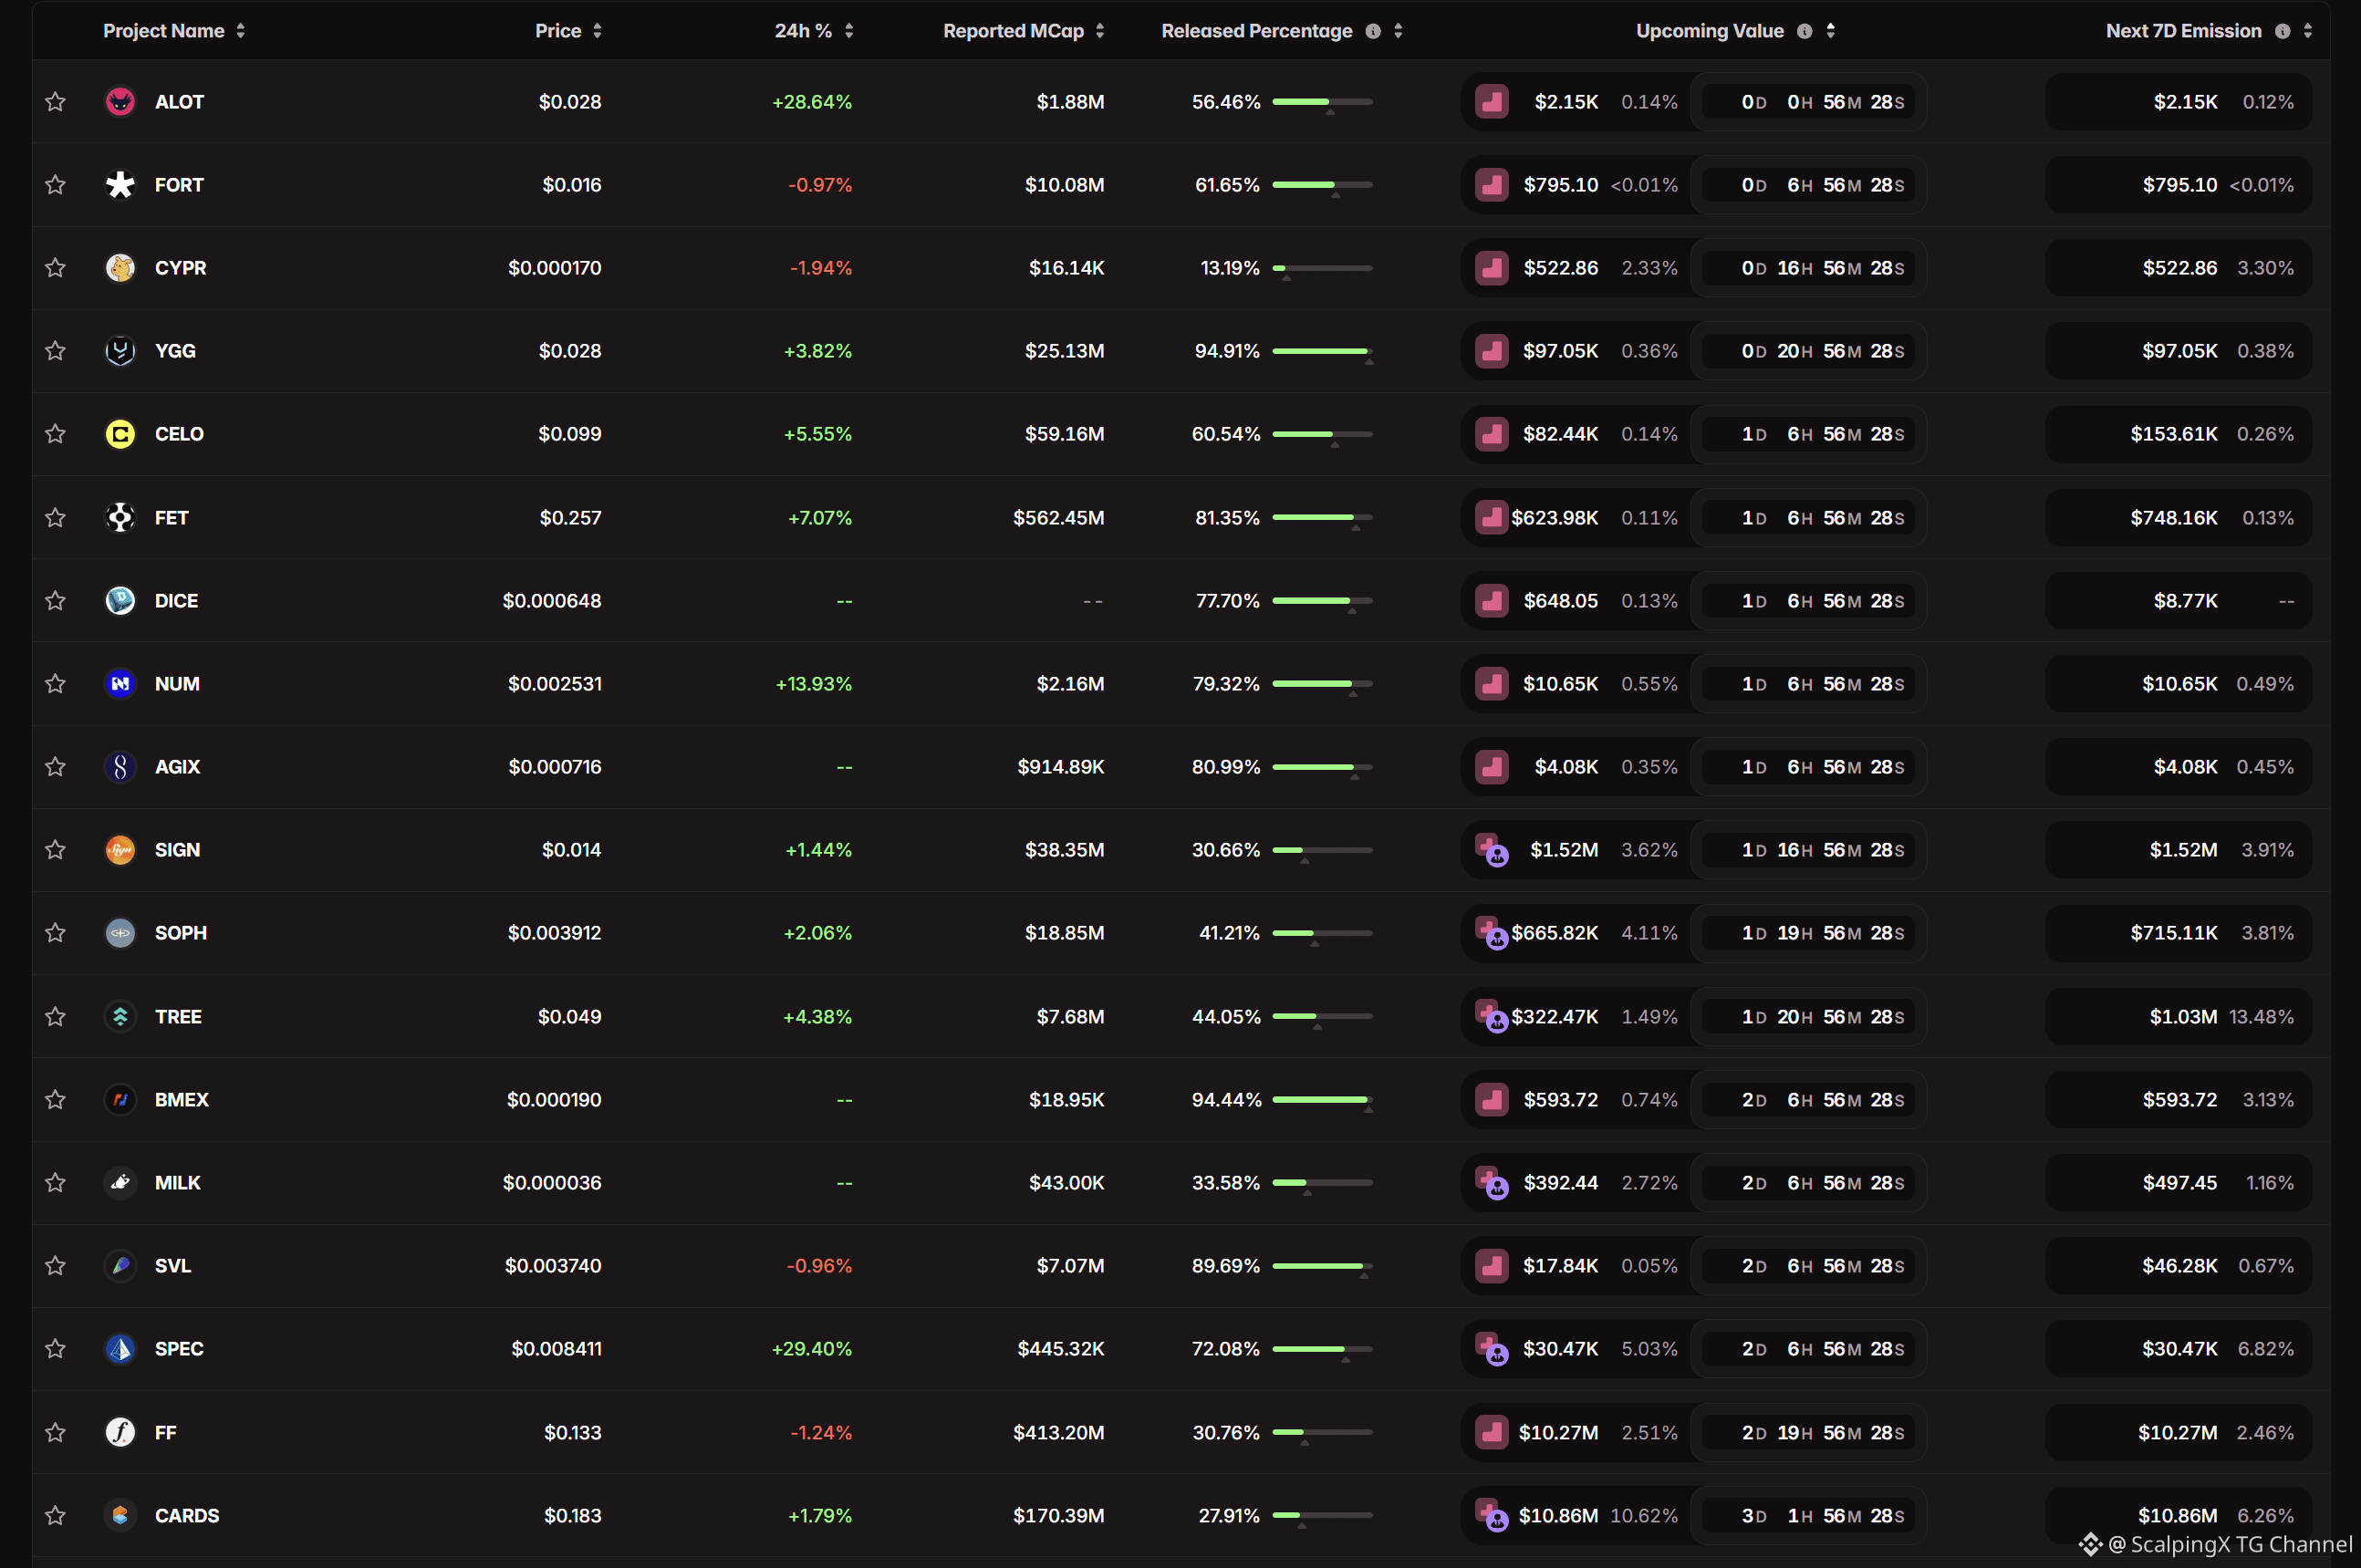
Upcoming unlock schedule for 50 tokens. Personally, I only consider Futures trading opportunities when the event is a Cliff Unlock and the unlock volume exceeds 50% of daily trading volume. If you are focused on long-term investing, however, these events are worth monitoring to optimize entry points after each unlock. Currently, there are 2 unlock events worth watching due to their high unlock volume relative to daily trading volume: $FF - 158.00% $2Z - 476.54% #TokenUnlock
Upcoming unlock schedule for 50 tokens. Personally, I only consider Futures trading opportunities when the event is a Cliff Unlock and the unlock volume exceeds 50% of daily trading volume. If you are focused on long-term investing, however, these events are worth monitoring to optimize entry points after each unlock. Currently, there are 2 unlock events worth watching due to their high unlock volume relative to daily trading volume: $FF - 158.00% $2Z - 476.54% #TokenUnlock
Voir la traduction
Crypto week of Sep 21–25: ETFs pushed prices higher, short squeeze amplified the move, but BTC failed to hold the $87,400 area
📈 Bitcoin opened the week around $80,000–81,000, surged to roughly $87,300–87,400, then eased back toward $84,000 by the end of the week. The rally coincided with strong ETF inflows and heavy short liquidations, while several altcoins outperformed BTC.
💰 U.S. spot Bitcoin ETFs attracted about $2.4 billion across five sessions, including nearly $1 billion on Sep 21 alone. Importantly, flows remained positive in the final two sessions even as BTC moved away from its peak, suggesting the pullback was not accompanied by a clear reversal in ETF demand.
⚡ Around $635 million in short positions were liquidated within 24 hours on Sep 21, amplifying the upside move. Afterward, BTC open interest on Binance fell nearly 13% while price declined only modestly, indicating much of the squeeze-driven positioning had been cleared rather than immediately replaced by a new layer of leveraged longs.
🏦 On-chain data also showed roughly 29,800 BTC leaving exchanges over seven days. BTC falling from $87,400 toward $84,000 while exchange flows remained net negative suggests readily available sell-side supply on CEXs did not rise in proportion to the price decline.
🔄 Ethereum ETFs also recorded around $690 million in inflows over five sessions. ETH price performance lagged some altcoins, but improving ETF demand showed that institutional buying was not limited to Bitcoin.
📊 After the squeeze, funding on several exchanges moved back toward low or negative levels, while total stablecoin supply remained around $305–312 billion. The structure suggests underlying liquidity remains in the market, but a sustained break above $87,400 may require renewed spot demand rather than another short squeeze alone.
#CryptoInsights $BTC
Crypto week of Sep 21–25: ETFs pushed prices higher, short squeeze amplified the move, but BTC failed to hold the $87,400 area
📈 Bitcoin opened the week around $80,000–81,000, surged to roughly $87,300–87,400, then eased back toward $84,000 by the end of the week. The rally coincided with strong ETF inflows and heavy short liquidations, while several altcoins outperformed BTC.
💰 U.S. spot Bitcoin ETFs attracted about $2.4 billion across five sessions, including nearly $1 billion on Sep 21 alone. Importantly, flows remained positive in the final two sessions even as BTC moved away from its peak, suggesting the pullback was not accompanied by a clear reversal in ETF demand.
⚡ Around $635 million in short positions were liquidated within 24 hours on Sep 21, amplifying the upside move. Afterward, BTC open interest on Binance fell nearly 13% while price declined only modestly, indicating much of the squeeze-driven positioning had been cleared rather than immediately replaced by a new layer of leveraged longs.
🏦 On-chain data also showed roughly 29,800 BTC leaving exchanges over seven days. BTC falling from $87,400 toward $84,000 while exchange flows remained net negative suggests readily available sell-side supply on CEXs did not rise in proportion to the price decline.
🔄 Ethereum ETFs also recorded around $690 million in inflows over five sessions. ETH price performance lagged some altcoins, but improving ETF demand showed that institutional buying was not limited to Bitcoin.
📊 After the squeeze, funding on several exchanges moved back toward low or negative levels, while total stablecoin supply remained around $305–312 billion. The structure suggests underlying liquidity remains in the market, but a sustained break above $87,400 may require renewed spot demand rather than another short squeeze alone.
#CryptoInsights $BTC
📈 Bitcoin opened the week around $80,000–81,000, surged to roughly $87,300–87,400, then eased back toward $84,000 by the end of the week. The rally coincided with strong ETF inflows and heavy short liquidations, while several altcoins outperformed BTC.
💰 U.S. spot Bitcoin ETFs attracted about $2.4 billion across five sessions, including nearly $1 billion on Sep 21 alone. Importantly, flows remained positive in the final two sessions even as BTC moved away from its peak, suggesting the pullback was not accompanied by a clear reversal in ETF demand.
⚡ Around $635 million in short positions were liquidated within 24 hours on Sep 21, amplifying the upside move. Afterward, BTC open interest on Binance fell nearly 13% while price declined only modestly, indicating much of the squeeze-driven positioning had been cleared rather than immediately replaced by a new layer of leveraged longs.
🏦 On-chain data also showed roughly 29,800 BTC leaving exchanges over seven days. BTC falling from $87,400 toward $84,000 while exchange flows remained net negative suggests readily available sell-side supply on CEXs did not rise in proportion to the price decline.
🔄 Ethereum ETFs also recorded around $690 million in inflows over five sessions. ETH price performance lagged some altcoins, but improving ETF demand showed that institutional buying was not limited to Bitcoin.
📊 After the squeeze, funding on several exchanges moved back toward low or negative levels, while total stablecoin supply remained around $305–312 billion. The structure suggests underlying liquidity remains in the market, but a sustained break above $87,400 may require renewed spot demand rather than another short squeeze alone.
#CryptoInsights $BTC

Produits chimiques du 21 au 25 sept. : les coûts des matières premières augmentent plus vite que les prix des produits finis
🛢 Le pétrole restant au-dessus de 100 USD/bbl et des coûts de fret liés à Hormuz demeurant élevés ont continué de faire grimper les prix du naphta, du méthanol, du benzène et de l’éthylène. En Chine, à la mi-mois, le méthanol a progressé de 9,4 %, le benzène de 6,5 % et l’acide acétique de 17,4 %, dépassant nettement de nombreux produits polymères.
📉 À l’inverse, les contrats à terme du PP et du LLDPE à Dalian ont baissé le 21 septembre, car la demande en aval restait trop faible pour absorber des coûts d’intrants plus élevés. Les marges du PE à base de pétrole ont été estimées à environ −335 yuans/t, tandis que le PE à base de charbon a encore généré environ +1 501 yuans/t, soulignant l’écart croissant entre les filières de matières premières.
🏭 L’offre asiatique d’éthylène est restée relativement tendue, en raison des arrêts pour maintenance et de la baisse des cargaisons en provenance du Moyen-Orient, mais le propylène et le PP se sont affaiblis à mesure que la demande se décalait. La rentabilité du MTO/MTP s’est également détériorée, le méthanol augmentant plus vite que les prix de sortie des oléfines, ce qui a conduit certains producteurs à réduire leurs taux de fonctionnement ou à arrêter des unités.
🌾 L’urée chinoise a affiché un schéma similaire. Les coûts de production basés sur le charbon ont augmenté d’environ 10 %, tandis que les prix de l’urée n’ont progressé que d’environ 1 %, ce qui a fait retomber les marges théoriques à environ 24 yuans/t. Cela indique que les hausses de coûts des intrants ne sont toujours pas pleinement répercutées.
🇪🇺 En Europe, l’arrêt temporaire par Ineos de trois sites de Hull, parallèlement à des taux de fonctionnement chimiques de l’UE proches de 75 %, continue de refléter une pression structurelle liée à des coûts élevés de gaz, d’électricité et de matières premières. Des niveaux bas de l’eau du Rhin et l’enquête antidumping de l’UE sur le PVC ajoutent encore des risques logistiques et commerciaux.
🔎 À venir, la Golden Week de Chine, les prix du pétrole et le fret via Hormuz seront des variables clés. Si les coûts énergétiques restent élevés, les marges du PP/PE et de l’urée pourraient rester comprimées, même si les matières premières chimiques de base demeurent fermes.
#ProduitsChimiques $CL
Produits chimiques du 21 au 25 sept. : les coûts des matières premières augmentent plus vite que les prix des produits finis
🛢 Le pétrole restant au-dessus de 100 USD/bbl et des coûts de fret liés à Hormuz demeurant élevés ont continué de faire grimper les prix du naphta, du méthanol, du benzène et de l’éthylène. En Chine, à la mi-mois, le méthanol a progressé de 9,4 %, le benzène de 6,5 % et l’acide acétique de 17,4 %, dépassant nettement de nombreux produits polymères.
📉 À l’inverse, les contrats à terme du PP et du LLDPE à Dalian ont baissé le 21 septembre, car la demande en aval restait trop faible pour absorber des coûts d’intrants plus élevés. Les marges du PE à base de pétrole ont été estimées à environ −335 yuans/t, tandis que le PE à base de charbon a encore généré environ +1 501 yuans/t, soulignant l’écart croissant entre les filières de matières premières.
🏭 L’offre asiatique d’éthylène est restée relativement tendue, en raison des arrêts pour maintenance et de la baisse des cargaisons en provenance du Moyen-Orient, mais le propylène et le PP se sont affaiblis à mesure que la demande se décalait. La rentabilité du MTO/MTP s’est également détériorée, le méthanol augmentant plus vite que les prix de sortie des oléfines, ce qui a conduit certains producteurs à réduire leurs taux de fonctionnement ou à arrêter des unités.
🌾 L’urée chinoise a affiché un schéma similaire. Les coûts de production basés sur le charbon ont augmenté d’environ 10 %, tandis que les prix de l’urée n’ont progressé que d’environ 1 %, ce qui a fait retomber les marges théoriques à environ 24 yuans/t. Cela indique que les hausses de coûts des intrants ne sont toujours pas pleinement répercutées.
🇪🇺 En Europe, l’arrêt temporaire par Ineos de trois sites de Hull, parallèlement à des taux de fonctionnement chimiques de l’UE proches de 75 %, continue de refléter une pression structurelle liée à des coûts élevés de gaz, d’électricité et de matières premières. Des niveaux bas de l’eau du Rhin et l’enquête antidumping de l’UE sur le PVC ajoutent encore des risques logistiques et commerciaux.
🔎 À venir, la Golden Week de Chine, les prix du pétrole et le fret via Hormuz seront des variables clés. Si les coûts énergétiques restent élevés, les marges du PP/PE et de l’urée pourraient rester comprimées, même si les matières premières chimiques de base demeurent fermes.
#ProduitsChimiques $CL
🛢 Le pétrole restant au-dessus de 100 USD/bbl et des coûts de fret liés à Hormuz demeurant élevés ont continué de faire grimper les prix du naphta, du méthanol, du benzène et de l’éthylène. En Chine, à la mi-mois, le méthanol a progressé de 9,4 %, le benzène de 6,5 % et l’acide acétique de 17,4 %, dépassant nettement de nombreux produits polymères.
📉 À l’inverse, les contrats à terme du PP et du LLDPE à Dalian ont baissé le 21 septembre, car la demande en aval restait trop faible pour absorber des coûts d’intrants plus élevés. Les marges du PE à base de pétrole ont été estimées à environ −335 yuans/t, tandis que le PE à base de charbon a encore généré environ +1 501 yuans/t, soulignant l’écart croissant entre les filières de matières premières.
🏭 L’offre asiatique d’éthylène est restée relativement tendue, en raison des arrêts pour maintenance et de la baisse des cargaisons en provenance du Moyen-Orient, mais le propylène et le PP se sont affaiblis à mesure que la demande se décalait. La rentabilité du MTO/MTP s’est également détériorée, le méthanol augmentant plus vite que les prix de sortie des oléfines, ce qui a conduit certains producteurs à réduire leurs taux de fonctionnement ou à arrêter des unités.
🌾 L’urée chinoise a affiché un schéma similaire. Les coûts de production basés sur le charbon ont augmenté d’environ 10 %, tandis que les prix de l’urée n’ont progressé que d’environ 1 %, ce qui a fait retomber les marges théoriques à environ 24 yuans/t. Cela indique que les hausses de coûts des intrants ne sont toujours pas pleinement répercutées.
🇪🇺 En Europe, l’arrêt temporaire par Ineos de trois sites de Hull, parallèlement à des taux de fonctionnement chimiques de l’UE proches de 75 %, continue de refléter une pression structurelle liée à des coûts élevés de gaz, d’électricité et de matières premières. Des niveaux bas de l’eau du Rhin et l’enquête antidumping de l’UE sur le PVC ajoutent encore des risques logistiques et commerciaux.
🔎 À venir, la Golden Week de Chine, les prix du pétrole et le fret via Hormuz seront des variables clés. Si les coûts énergétiques restent élevés, les marges du PP/PE et de l’urée pourraient rester comprimées, même si les matières premières chimiques de base demeurent fermes.
#ProduitsChimiques $CL
2
Voir la traduction
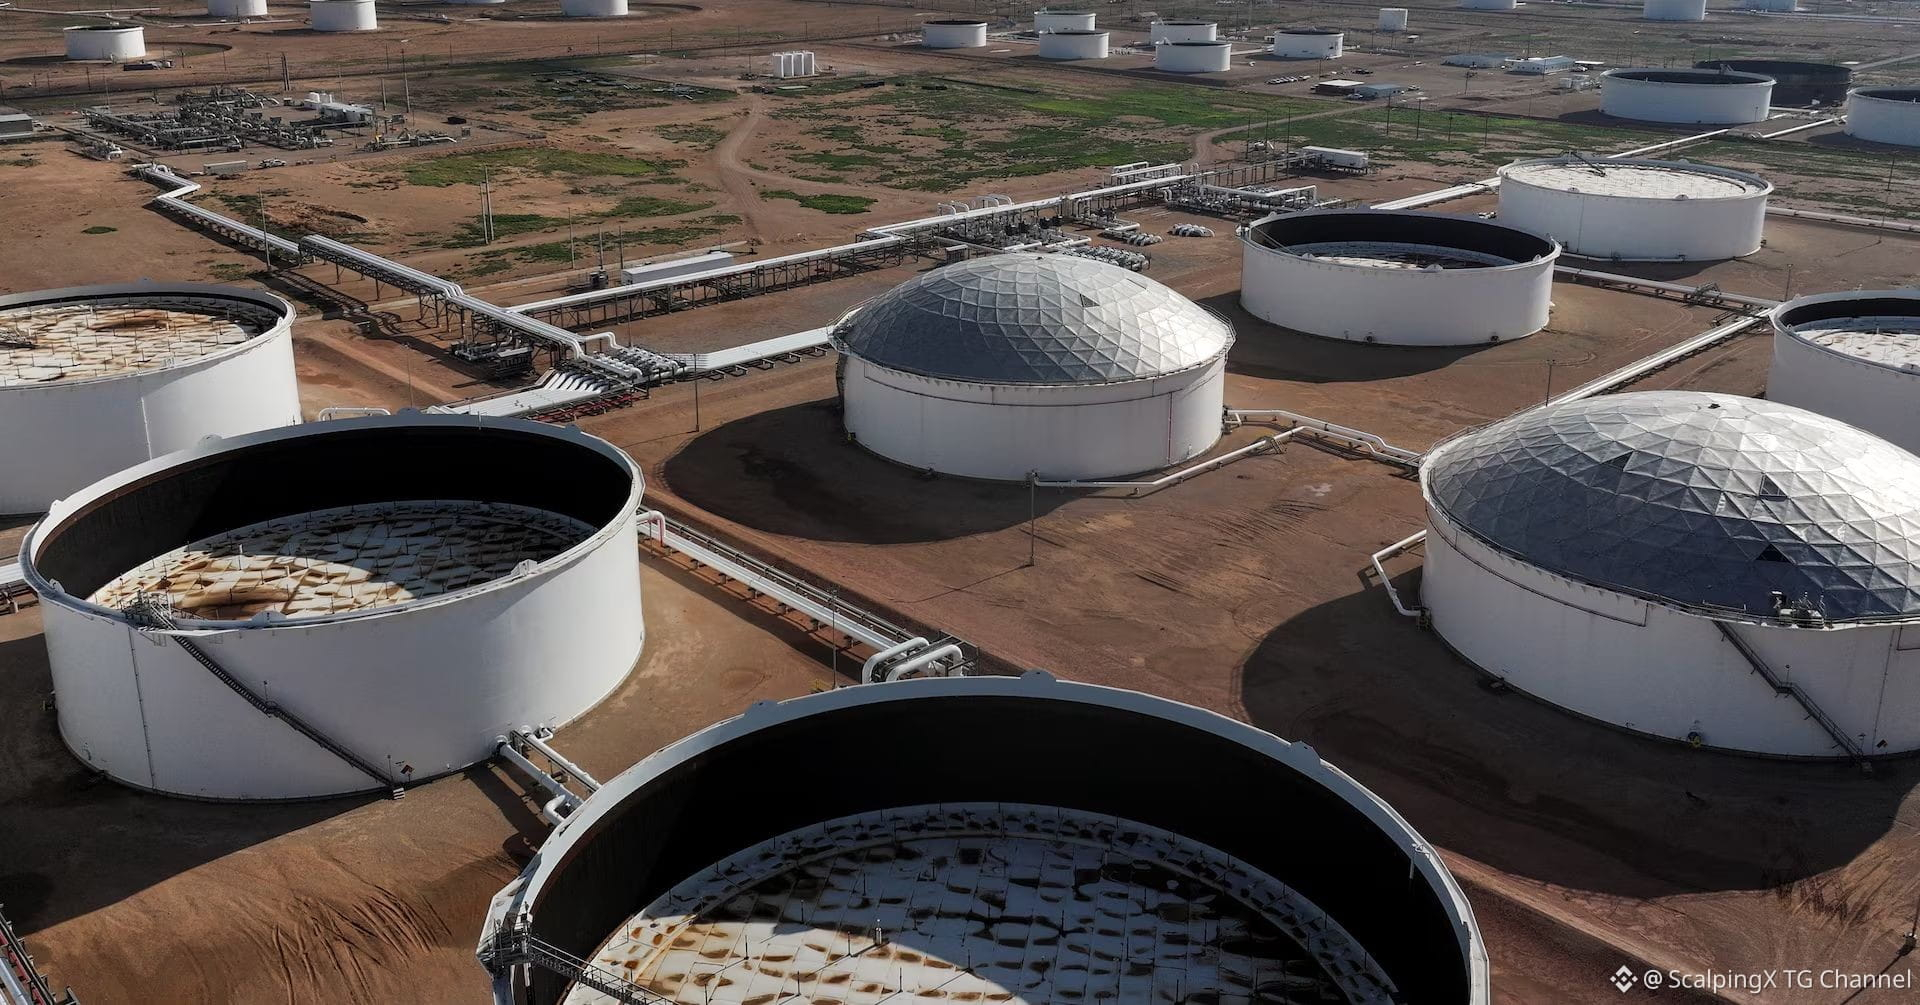
Paper oil cools, but diesel and logistics keep the physical market tight
🛢 Brent ended the week near $104.32/bbl while WTI fell to $92.41, widening the Brent–WTI spread to almost $12/bbl, its widest since May. The divergence shows US crude is facing its own pressure from inventories and diesel export risks, while international barrels still command a higher physical premium.
🤝 US–Iran talks in New York helped remove part of the Hormuz risk premium, but physical flows have not materially improved. Kpler estimated oil movements through the strait at around 33.7 million barrels for the week beginning Sep. 20, broadly unchanged from the previous week.
📉 At the same time, the IEA estimates observed global oil inventories have fallen by roughly 507 million barrels since the conflict began. In the US, distillate stocks stand at just 107.4 million barrels, around 12% below the five-year average, even as commercial crude inventories rose by 3 million barrels.
⛽ The strongest pressure remains in refined products. Southern European diesel cracks moved above $100/bbl, while reports that Washington is considering a 90-day diesel export ban sharply weakened US diesel cracks. If implemented, the policy could ease domestic US supply while tightening Europe further.
🚢 Logistics also remain constrained. Gulf-to-Asia VLCC rates briefly reached around $1.27 million per day, while ship-to-ship transfer capacity off Oman has been heavily utilized. That suggests even a smoother Hormuz transit would not immediately remove the physical bottleneck.
📌 The week therefore cannot be read simply as oil falling on diplomacy. WTI is reflecting US crude availability and domestic diesel risks, while Brent remains supported by falling global inventories, tight refined-product supply and elevated logistics costs.
#EnergyMarkets $CL $NATGAS
Paper oil cools, but diesel and logistics keep the physical market tight
🛢 Brent ended the week near $104.32/bbl while WTI fell to $92.41, widening the Brent–WTI spread to almost $12/bbl, its widest since May. The divergence shows US crude is facing its own pressure from inventories and diesel export risks, while international barrels still command a higher physical premium.
🤝 US–Iran talks in New York helped remove part of the Hormuz risk premium, but physical flows have not materially improved. Kpler estimated oil movements through the strait at around 33.7 million barrels for the week beginning Sep. 20, broadly unchanged from the previous week.
📉 At the same time, the IEA estimates observed global oil inventories have fallen by roughly 507 million barrels since the conflict began. In the US, distillate stocks stand at just 107.4 million barrels, around 12% below the five-year average, even as commercial crude inventories rose by 3 million barrels.
⛽ The strongest pressure remains in refined products. Southern European diesel cracks moved above $100/bbl, while reports that Washington is considering a 90-day diesel export ban sharply weakened US diesel cracks. If implemented, the policy could ease domestic US supply while tightening Europe further.
🚢 Logistics also remain constrained. Gulf-to-Asia VLCC rates briefly reached around $1.27 million per day, while ship-to-ship transfer capacity off Oman has been heavily utilized. That suggests even a smoother Hormuz transit would not immediately remove the physical bottleneck.
📌 The week therefore cannot be read simply as oil falling on diplomacy. WTI is reflecting US crude availability and domestic diesel risks, while Brent remains supported by falling global inventories, tight refined-product supply and elevated logistics costs.
#EnergyMarkets $CL $NATGAS
🛢 Brent ended the week near $104.32/bbl while WTI fell to $92.41, widening the Brent–WTI spread to almost $12/bbl, its widest since May. The divergence shows US crude is facing its own pressure from inventories and diesel export risks, while international barrels still command a higher physical premium.
🤝 US–Iran talks in New York helped remove part of the Hormuz risk premium, but physical flows have not materially improved. Kpler estimated oil movements through the strait at around 33.7 million barrels for the week beginning Sep. 20, broadly unchanged from the previous week.
📉 At the same time, the IEA estimates observed global oil inventories have fallen by roughly 507 million barrels since the conflict began. In the US, distillate stocks stand at just 107.4 million barrels, around 12% below the five-year average, even as commercial crude inventories rose by 3 million barrels.
⛽ The strongest pressure remains in refined products. Southern European diesel cracks moved above $100/bbl, while reports that Washington is considering a 90-day diesel export ban sharply weakened US diesel cracks. If implemented, the policy could ease domestic US supply while tightening Europe further.
🚢 Logistics also remain constrained. Gulf-to-Asia VLCC rates briefly reached around $1.27 million per day, while ship-to-ship transfer capacity off Oman has been heavily utilized. That suggests even a smoother Hormuz transit would not immediately remove the physical bottleneck.
📌 The week therefore cannot be read simply as oil falling on diplomacy. WTI is reflecting US crude availability and domestic diesel risks, while Brent remains supported by falling global inventories, tight refined-product supply and elevated logistics costs.
#EnergyMarkets $CL $NATGAS

12
Voir la traduction
Agricultural commodities diverge as soybeans gain on China expectations while wheat faces supply pressure
🌱 U.S. soybeans were a key outperformer during September 21–25, with November futures closing near 13.19 USD/bu, up 15.5 cents for the week. Support came mainly from expectations of stronger Chinese purchases following fresh trade signals, although the roughly 17 billion USD agricultural commitment still lacks a detailed product breakdown or shipment schedule.
📊 Positioning shows that speculators have already leaned heavily into this theme. Managed money holds a net long of around 281,000 soybean contracts, the highest level in 52 weeks, increasing the potential for a sharp reaction if upcoming purchase details differ from expectations.
🌾 Wheat moved in the opposite direction. SRW fell about 11 cents for the week, HRW lost more than 21 cents, and spring wheat declined nearly 28 cents. Russian and Ukrainian exports remain well below year-ago levels, but Russian grain is still reaching the market through Baltic routes, limiting the premium for a severe supply disruption.
🌽 Corn finished nearly flat as supportive and bearish factors offset each other. USDA has reduced its U.S. production outlook on weaker yields, while harvest progress remains ahead of average and Argentine supply continues moving into export channels.
☕ In soft commodities, Arabica remained under pressure as Brazil’s weather outlook improved and ICE inventories recovered from multi-year lows. Cocoa gained around 5.5% for the week, although the 2025/26 supply outlook still points toward a surplus, making the move look more like a recovery than a renewed shortage cycle.
🔎 Next week, attention turns to details on Chinese agricultural purchases and the USDA Grain Stocks report, which could determine whether the current soybean premium has enough fundamental support to persist.
#Commodities $SUSHI
Agricultural commodities diverge as soybeans gain on China expectations while wheat faces supply pressure
🌱 U.S. soybeans were a key outperformer during September 21–25, with November futures closing near 13.19 USD/bu, up 15.5 cents for the week. Support came mainly from expectations of stronger Chinese purchases following fresh trade signals, although the roughly 17 billion USD agricultural commitment still lacks a detailed product breakdown or shipment schedule.
📊 Positioning shows that speculators have already leaned heavily into this theme. Managed money holds a net long of around 281,000 soybean contracts, the highest level in 52 weeks, increasing the potential for a sharp reaction if upcoming purchase details differ from expectations.
🌾 Wheat moved in the opposite direction. SRW fell about 11 cents for the week, HRW lost more than 21 cents, and spring wheat declined nearly 28 cents. Russian and Ukrainian exports remain well below year-ago levels, but Russian grain is still reaching the market through Baltic routes, limiting the premium for a severe supply disruption.
🌽 Corn finished nearly flat as supportive and bearish factors offset each other. USDA has reduced its U.S. production outlook on weaker yields, while harvest progress remains ahead of average and Argentine supply continues moving into export channels.
☕ In soft commodities, Arabica remained under pressure as Brazil’s weather outlook improved and ICE inventories recovered from multi-year lows. Cocoa gained around 5.5% for the week, although the 2025/26 supply outlook still points toward a surplus, making the move look more like a recovery than a renewed shortage cycle.
🔎 Next week, attention turns to details on Chinese agricultural purchases and the USDA Grain Stocks report, which could determine whether the current soybean premium has enough fundamental support to persist.
#Commodities $SUSHI
🌱 U.S. soybeans were a key outperformer during September 21–25, with November futures closing near 13.19 USD/bu, up 15.5 cents for the week. Support came mainly from expectations of stronger Chinese purchases following fresh trade signals, although the roughly 17 billion USD agricultural commitment still lacks a detailed product breakdown or shipment schedule.
📊 Positioning shows that speculators have already leaned heavily into this theme. Managed money holds a net long of around 281,000 soybean contracts, the highest level in 52 weeks, increasing the potential for a sharp reaction if upcoming purchase details differ from expectations.
🌾 Wheat moved in the opposite direction. SRW fell about 11 cents for the week, HRW lost more than 21 cents, and spring wheat declined nearly 28 cents. Russian and Ukrainian exports remain well below year-ago levels, but Russian grain is still reaching the market through Baltic routes, limiting the premium for a severe supply disruption.
🌽 Corn finished nearly flat as supportive and bearish factors offset each other. USDA has reduced its U.S. production outlook on weaker yields, while harvest progress remains ahead of average and Argentine supply continues moving into export channels.
☕ In soft commodities, Arabica remained under pressure as Brazil’s weather outlook improved and ICE inventories recovered from multi-year lows. Cocoa gained around 5.5% for the week, although the 2025/26 supply outlook still points toward a surplus, making the move look more like a recovery than a renewed shortage cycle.
🔎 Next week, attention turns to details on Chinese agricultural purchases and the USDA Grain Stocks report, which could determine whether the current soybean premium has enough fundamental support to persist.
#Commodities $SUSHI

Voir la traduction
Global stocks hold gains, but market breadth remains narrow
📈 U.S. equities ended the September 21–25 week higher, with the S&P 500 up about 1.2%, the Nasdaq gaining more than 2%, and the Dow rising only around 0.3%. Technology and AI-related names remained the main drivers, helping large-cap indexes advance despite persistent pressure from elevated yields.
📊 The U.S. 10-year Treasury yield briefly moved above 5.2%, while oil stayed near high levels before easing into the end of the week. The pullback in both yields and energy prices on Friday reduced pressure on equities, but it was not enough to produce a broad-based risk-on move.
🔍 Market breadth remains a key point to watch. The Nasdaq and S&P 500 advanced while small caps, value, utilities and several non-tech groups lagged. Capital therefore continues to concentrate in mega-cap and AI infrastructure names rather than spreading evenly across the market.
🌍 Europe recovered modestly after three weeks of declines, while Japan remained supported by technology shares and a weaker yen. Hong Kong and several emerging markets were less constructive, highlighting continued regional divergence.
📌 U.S. PCE data on September 30 will be one of the key catalysts next week. Softer inflation could ease pressure from yields, while persistently high rates would keep testing valuations in growth stocks.
#MarketInsights $NVDA $MU $GOOGL
Global stocks hold gains, but market breadth remains narrow
📈 U.S. equities ended the September 21–25 week higher, with the S&P 500 up about 1.2%, the Nasdaq gaining more than 2%, and the Dow rising only around 0.3%. Technology and AI-related names remained the main drivers, helping large-cap indexes advance despite persistent pressure from elevated yields.
📊 The U.S. 10-year Treasury yield briefly moved above 5.2%, while oil stayed near high levels before easing into the end of the week. The pullback in both yields and energy prices on Friday reduced pressure on equities, but it was not enough to produce a broad-based risk-on move.
🔍 Market breadth remains a key point to watch. The Nasdaq and S&P 500 advanced while small caps, value, utilities and several non-tech groups lagged. Capital therefore continues to concentrate in mega-cap and AI infrastructure names rather than spreading evenly across the market.
🌍 Europe recovered modestly after three weeks of declines, while Japan remained supported by technology shares and a weaker yen. Hong Kong and several emerging markets were less constructive, highlighting continued regional divergence.
📌 U.S. PCE data on September 30 will be one of the key catalysts next week. Softer inflation could ease pressure from yields, while persistently high rates would keep testing valuations in growth stocks.
#MarketInsights $NVDA $MU $GOOGL
📈 U.S. equities ended the September 21–25 week higher, with the S&P 500 up about 1.2%, the Nasdaq gaining more than 2%, and the Dow rising only around 0.3%. Technology and AI-related names remained the main drivers, helping large-cap indexes advance despite persistent pressure from elevated yields.
📊 The U.S. 10-year Treasury yield briefly moved above 5.2%, while oil stayed near high levels before easing into the end of the week. The pullback in both yields and energy prices on Friday reduced pressure on equities, but it was not enough to produce a broad-based risk-on move.
🔍 Market breadth remains a key point to watch. The Nasdaq and S&P 500 advanced while small caps, value, utilities and several non-tech groups lagged. Capital therefore continues to concentrate in mega-cap and AI infrastructure names rather than spreading evenly across the market.
🌍 Europe recovered modestly after three weeks of declines, while Japan remained supported by technology shares and a weaker yen. Hong Kong and several emerging markets were less constructive, highlighting continued regional divergence.
📌 U.S. PCE data on September 30 will be one of the key catalysts next week. Softer inflation could ease pressure from yields, while persistently high rates would keep testing valuations in growth stocks.
#MarketInsights $NVDA $MU $GOOGL
17
Voir la traduction
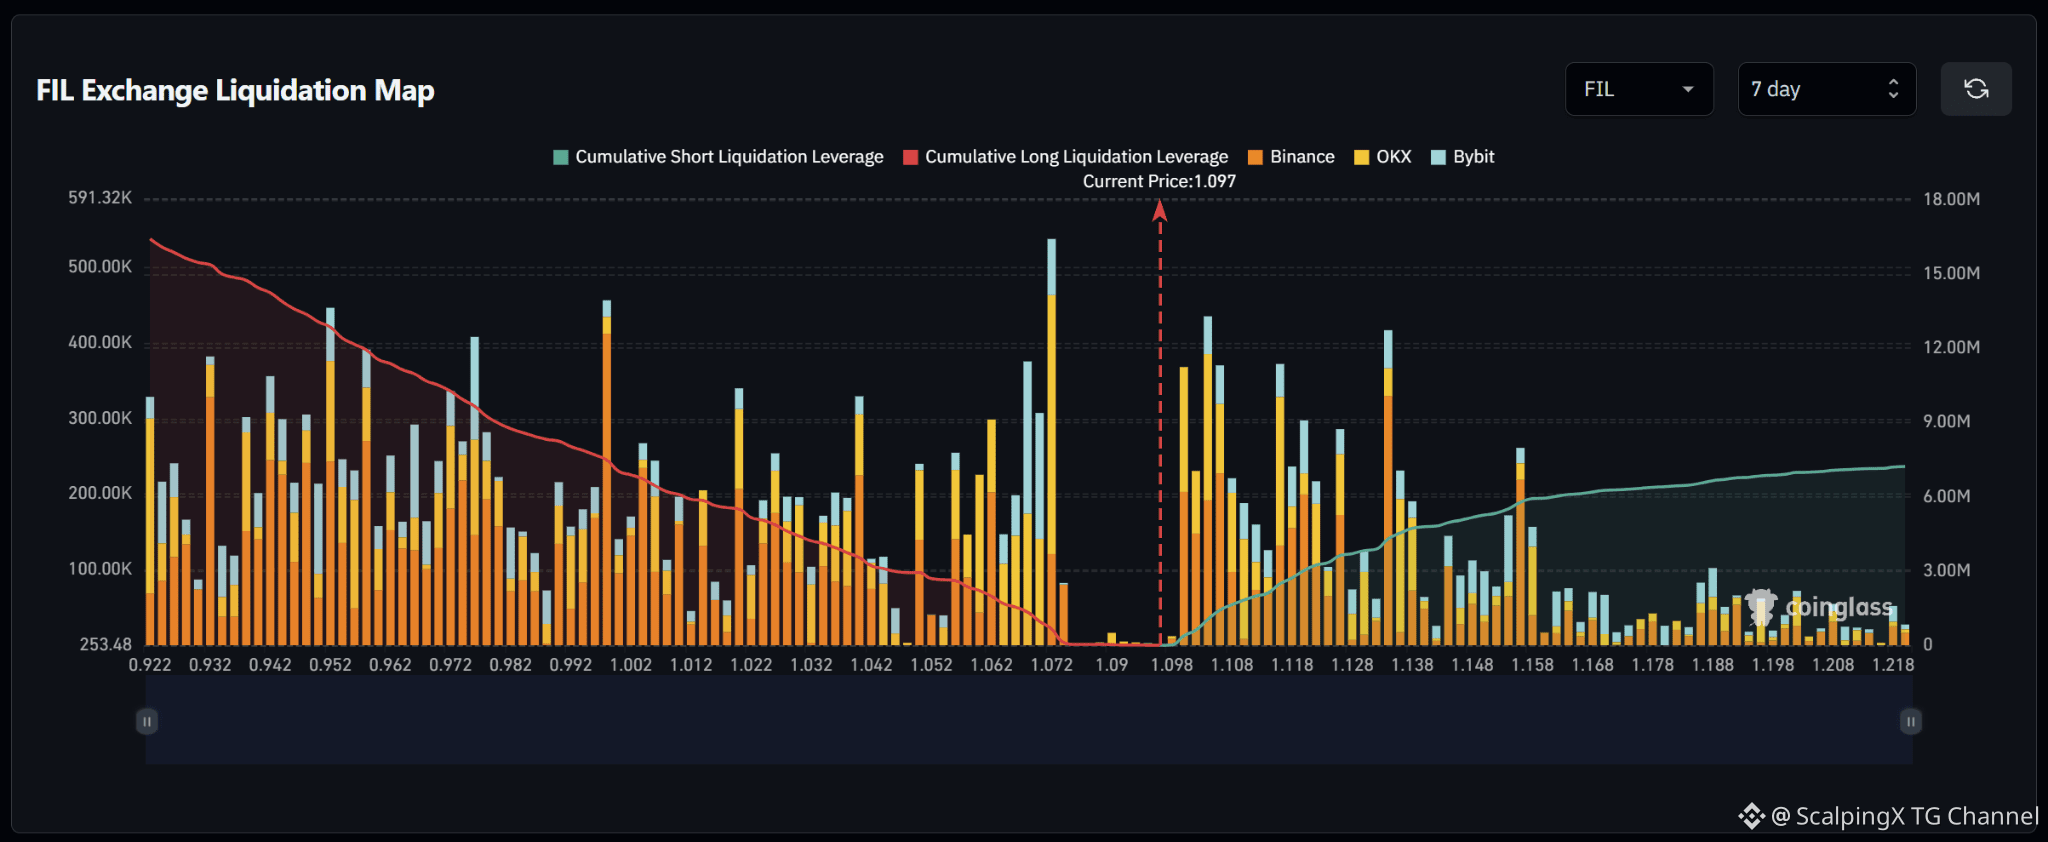
$FIL – Liquidation Map (7 Days) – Current Price 1.097 🔎 The 7-day liquidation map shows roughly 16–17 million USD in long liquidations below the current price, significantly exceeding approximately 7 million USD in short liquidations above. The liquidity structure therefore clearly favors the downside, with around 2.3 times more cumulative liquidity below the market. 📉 Below the market, long-liquidation liquidity is broadly distributed but concentrated most heavily across 0.95–1.07. The strongest cluster sits around 1.071–1.073 with a bar above 0.5 million USD, while 0.995–0.998 and 0.950–0.953 also contain bars around 0.44–0.45 million USD. Losing 1.09 would shift attention toward 1.072–1.062 and then 1.042–1.022. 📈 Above the market, short-liquidation liquidity is concentrated mainly across 1.10–1.14. Notable clusters appear around 1.103–1.106 with a bar near 0.43 million USD, 1.116–1.119 near 0.37 million USD, and 1.132–1.135 around 0.42 million USD. Further out, 1.155–1.158 still holds another notable pocket. 🧭 The broader setup favors the downside because long-liquidation exposure below clearly dominates. Losing 1.09 would increase the probability of a sweep toward 1.072–1.062, followed by 1.042–1.022. Breaking above 1.105 would instead expose 1.118 and then 1.132–1.135.
$FIL – Liquidation Map (7 Days) – Current Price 1.097 🔎 The 7-day liquidation map shows roughly 16–17 million USD in long liquidations below the current price, significantly exceeding approximately 7 million USD in short liquidations above. The liquidity structure therefore clearly favors the downside, with around 2.3 times more cumulative liquidity below the market. 📉 Below the market, long-liquidation liquidity is broadly distributed but concentrated most heavily across 0.95–1.07. The strongest cluster sits around 1.071–1.073 with a bar above 0.5 million USD, while 0.995–0.998 and 0.950–0.953 also contain bars around 0.44–0.45 million USD. Losing 1.09 would shift attention toward 1.072–1.062 and then 1.042–1.022. 📈 Above the market, short-liquidation liquidity is concentrated mainly across 1.10–1.14. Notable clusters appear around 1.103–1.106 with a bar near 0.43 million USD, 1.116–1.119 near 0.37 million USD, and 1.132–1.135 around 0.42 million USD. Further out, 1.155–1.158 still holds another notable pocket. 🧭 The broader setup favors the downside because long-liquidation exposure below clearly dominates. Losing 1.09 would increase the probability of a sweep toward 1.072–1.062, followed by 1.042–1.022. Breaking above 1.105 would instead expose 1.118 and then 1.132–1.135.
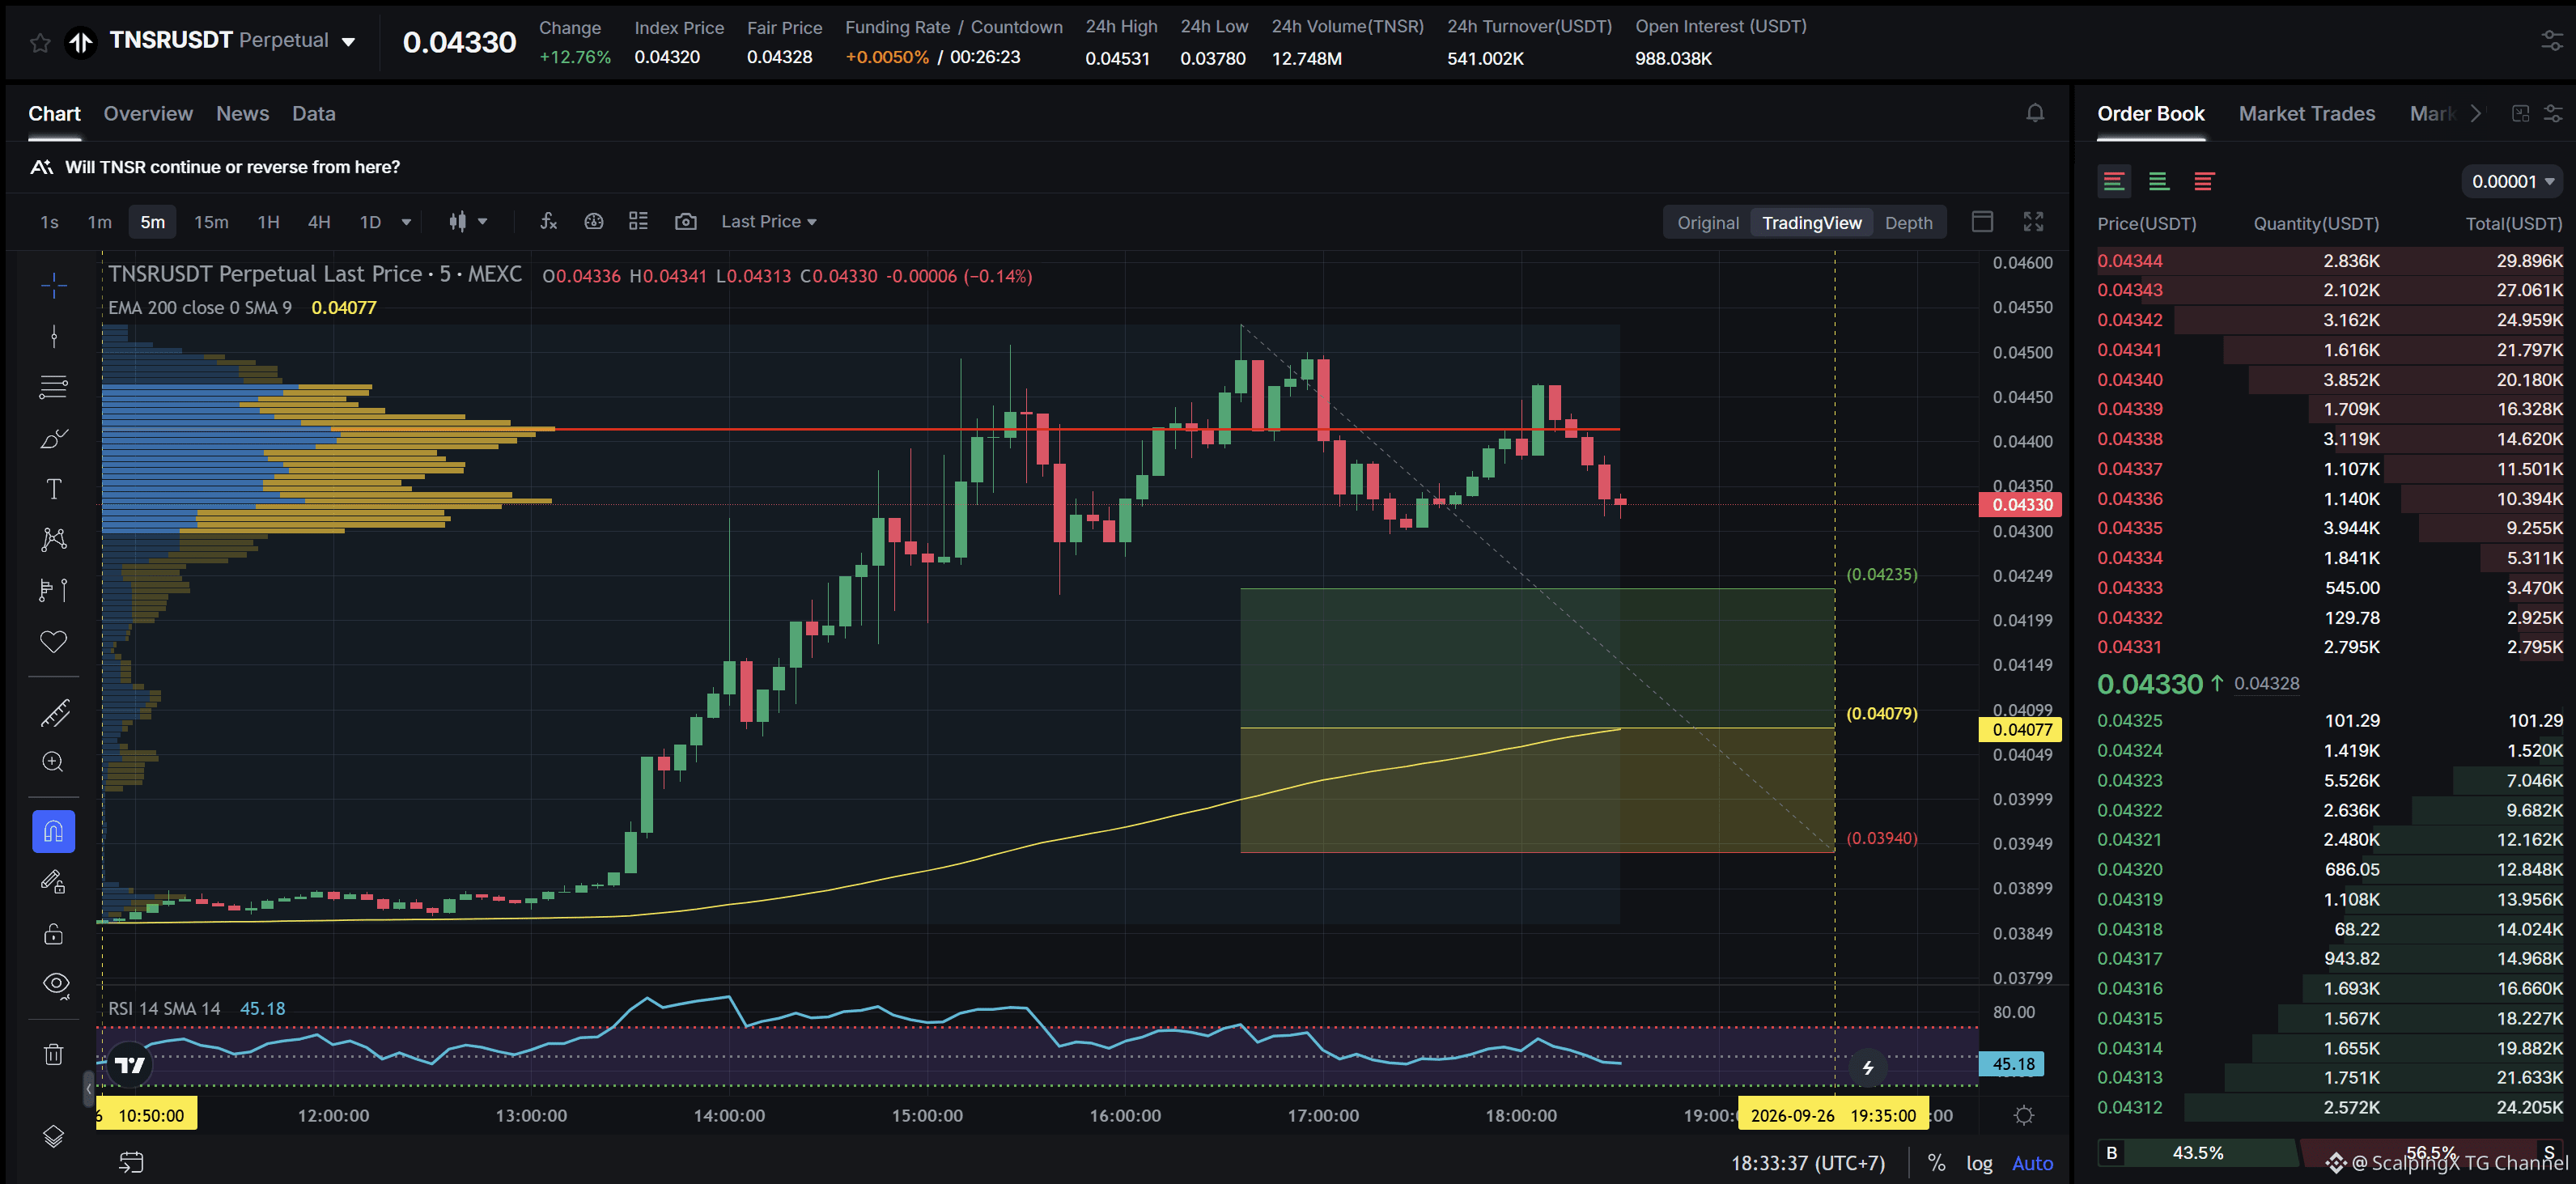
$TNSR - Mcap 22.32M$ - 24h Sentiment +5.81 Bullish SC02 M5 - en attente Long ordre. L’entrée se situe dans le LVN et n’est affectée par aucune zone de faiblesse. La zone de support actuelle a une largeur d’environ 3,38%. La tendance haussière a duré 7 heures 40 minutes, avec une hausse maximale enregistrée de 17,32%. Si le prix perd cette zone de support, la tendance a très probablement des chances de s’inverser à la baisse.
$TNSR - Mcap 22.32M$ - 24h Sentiment +5.81 Bullish SC02 M5 - en attente Long ordre. L’entrée se situe dans le LVN et n’est affectée par aucune zone de faiblesse. La zone de support actuelle a une largeur d’environ 3,38%. La tendance haussière a duré 7 heures 40 minutes, avec une hausse maximale enregistrée de 17,32%. Si le prix perd cette zone de support, la tendance a très probablement des chances de s’inverser à la baisse.
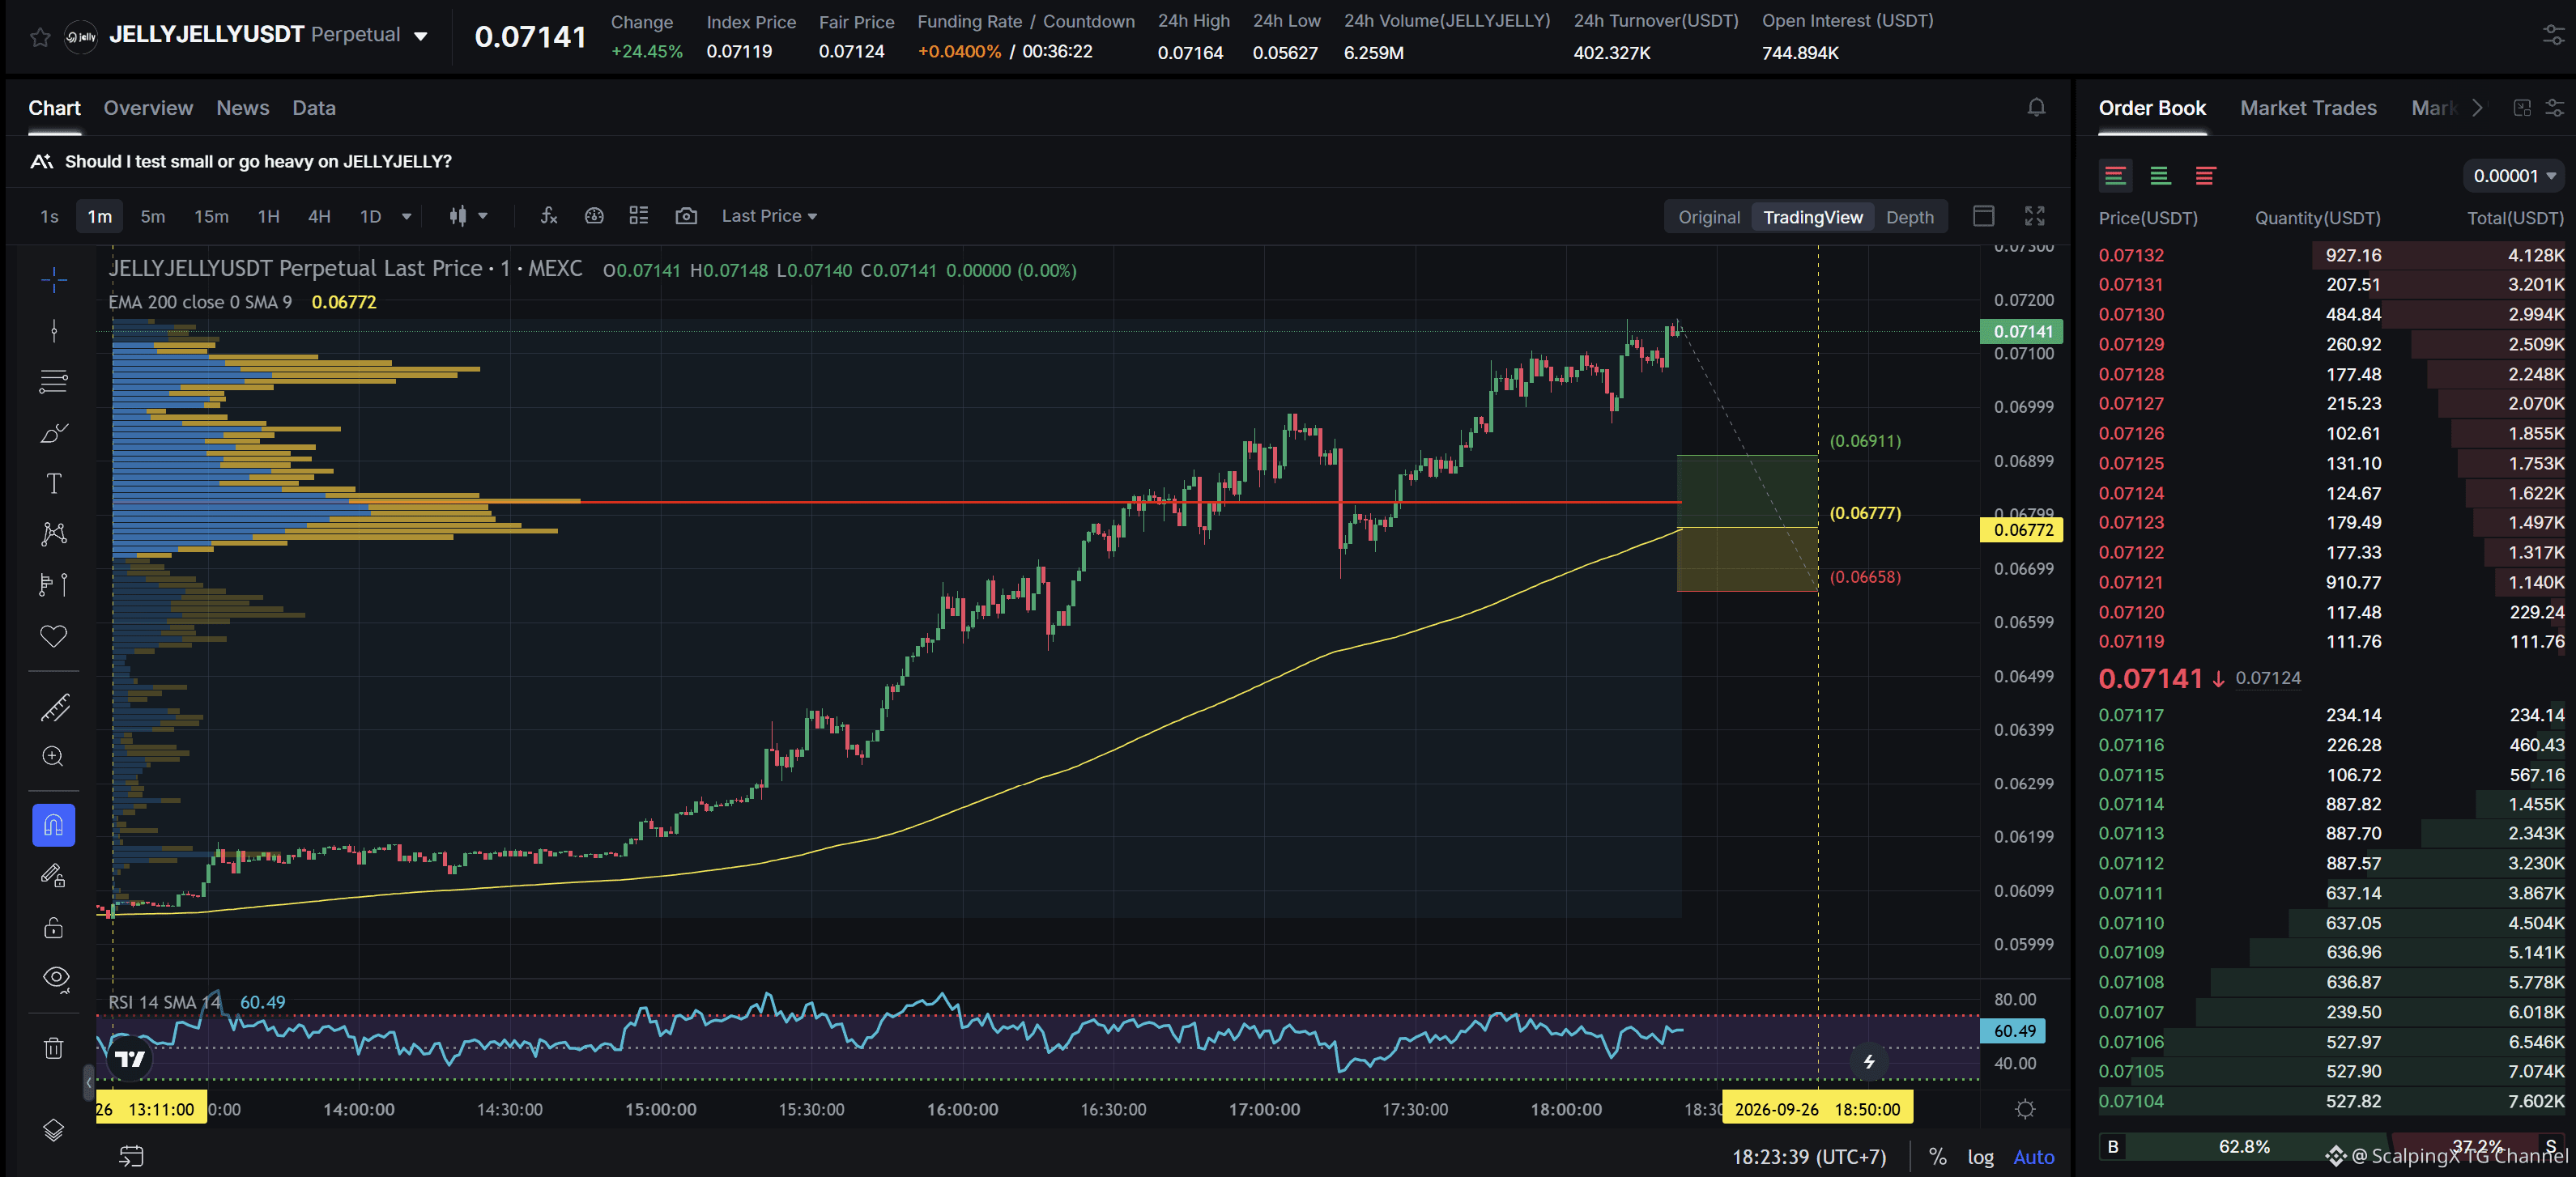
$JELLYJELLY - Mcap 70.41M$ - 24h Sentiment +6.00 Bullish SC02 M1 - en attente d’un ordre long. L’entrée se situe dans la zone HVN et n’est affectée par aucune zone faible ; la zone de support actuelle a une largeur d’environ 1,71 %. La tendance haussière a duré 5 heures 14 minutes, avec une augmentation maximale enregistrée du prix de 18,30 %. Si le prix perd cette zone de support, la tendance a très probablement une forte probabilité de s’inverser à la baisse.
$JELLYJELLY - Mcap 70.41M$ - 24h Sentiment +6.00 Bullish SC02 M1 - en attente d’un ordre long. L’entrée se situe dans la zone HVN et n’est affectée par aucune zone faible ; la zone de support actuelle a une largeur d’environ 1,71 %. La tendance haussière a duré 5 heures 14 minutes, avec une augmentation maximale enregistrée du prix de 18,30 %. Si le prix perd cette zone de support, la tendance a très probablement une forte probabilité de s’inverser à la baisse.
Les métaux divergent : l’or recule face à une pression exercée par les rendements, tandis que le cuivre et le zinc restent soutenus par une tension physique
🟡 L’or a chuté d’environ 2 à 2,3% entre le 21 et le 25 septembre, pour retomber vers 4 280–4 288 $/oz, tandis que l’argent a perdu environ 4%. La pression principale vient de la hausse du rendement du Trésor américain à 10 ans au-dessus de 5% et du DXY qui se maintient près de 101, ce qui accroît le coût d’opportunité des actifs ne rapportant pas de rendement, malgré les risques persistants au Moyen-Orient.
📉 Le mouvement ressemble davantage à un réajustement des attentes de taux qu’à une sortie généralisée des métaux précieux. La position spéculative sur l’or reste nettement acheteuse, tandis que les avoirs en GLD n’ont baissé que modestement le 24 septembre.
🔶 Le cuivre a évolué dans le sens inverse. Le cuivre LME à 3 mois se maintenait autour de 14 620–14 630 $/t, tandis que le COMEX a brièvement atteint environ 15 060 $/t. Le contango négatif (cash vs 3 mois) s’est élargi à environ 125 $/t, montrant que le métal immédiatement disponible bénéficie encore d’une forte prime malgré un dollar plus ferme.
⚙️ Le zinc est également resté relativement tendu, avec une backwardation proche de 106 $/t. Des frais de traitement fortement négatifs en Chine et la revue par Nyrstar de l’usine de fonderie de Budel ont ajouté davantage d’inquiétudes sur l’offre. Le nickel était plus faible, les stocks continuant de s’accumuler.
🏗️ Le minerai de fer n’a pas suivi la hausse du cuivre. Les prix sont restés autour de 713–715 CNY/t sur Dalian et de 95–96 $/t sur SGX, tandis que les stocks des ports chinois montaient à environ 145,45 millions de tonnes. Le réassort avant la Golden Week a aidé, mais les marges sidérurgiques faibles et l’entretien des hauts fourneaux ont limité la demande.
📌 Cette semaine n’a pas été un désengagement uniforme pour l’ensemble des métaux. Les métaux précieux restent principalement portés par les rendements et le dollar, tandis que le cuivre et le zinc sont toujours soutenus par la tension physique. Le PCE américain sera déterminant pour l’or et l’argent, tandis que la demande post-fêtes en Chine comptera davantage pour le cuivre et le minerai de fer.
#Metals $XAU $XAG $XCU
Les métaux divergent : l’or recule face à une pression exercée par les rendements, tandis que le cuivre et le zinc restent soutenus par une tension physique
🟡 L’or a chuté d’environ 2 à 2,3% entre le 21 et le 25 septembre, pour retomber vers 4 280–4 288 $/oz, tandis que l’argent a perdu environ 4%. La pression principale vient de la hausse du rendement du Trésor américain à 10 ans au-dessus de 5% et du DXY qui se maintient près de 101, ce qui accroît le coût d’opportunité des actifs ne rapportant pas de rendement, malgré les risques persistants au Moyen-Orient.
📉 Le mouvement ressemble davantage à un réajustement des attentes de taux qu’à une sortie généralisée des métaux précieux. La position spéculative sur l’or reste nettement acheteuse, tandis que les avoirs en GLD n’ont baissé que modestement le 24 septembre.
🔶 Le cuivre a évolué dans le sens inverse. Le cuivre LME à 3 mois se maintenait autour de 14 620–14 630 $/t, tandis que le COMEX a brièvement atteint environ 15 060 $/t. Le contango négatif (cash vs 3 mois) s’est élargi à environ 125 $/t, montrant que le métal immédiatement disponible bénéficie encore d’une forte prime malgré un dollar plus ferme.
⚙️ Le zinc est également resté relativement tendu, avec une backwardation proche de 106 $/t. Des frais de traitement fortement négatifs en Chine et la revue par Nyrstar de l’usine de fonderie de Budel ont ajouté davantage d’inquiétudes sur l’offre. Le nickel était plus faible, les stocks continuant de s’accumuler.
🏗️ Le minerai de fer n’a pas suivi la hausse du cuivre. Les prix sont restés autour de 713–715 CNY/t sur Dalian et de 95–96 $/t sur SGX, tandis que les stocks des ports chinois montaient à environ 145,45 millions de tonnes. Le réassort avant la Golden Week a aidé, mais les marges sidérurgiques faibles et l’entretien des hauts fourneaux ont limité la demande.
📌 Cette semaine n’a pas été un désengagement uniforme pour l’ensemble des métaux. Les métaux précieux restent principalement portés par les rendements et le dollar, tandis que le cuivre et le zinc sont toujours soutenus par la tension physique. Le PCE américain sera déterminant pour l’or et l’argent, tandis que la demande post-fêtes en Chine comptera davantage pour le cuivre et le minerai de fer.
#Metals $XAU $XAG $XCU
🟡 L’or a chuté d’environ 2 à 2,3% entre le 21 et le 25 septembre, pour retomber vers 4 280–4 288 $/oz, tandis que l’argent a perdu environ 4%. La pression principale vient de la hausse du rendement du Trésor américain à 10 ans au-dessus de 5% et du DXY qui se maintient près de 101, ce qui accroît le coût d’opportunité des actifs ne rapportant pas de rendement, malgré les risques persistants au Moyen-Orient.
📉 Le mouvement ressemble davantage à un réajustement des attentes de taux qu’à une sortie généralisée des métaux précieux. La position spéculative sur l’or reste nettement acheteuse, tandis que les avoirs en GLD n’ont baissé que modestement le 24 septembre.
🔶 Le cuivre a évolué dans le sens inverse. Le cuivre LME à 3 mois se maintenait autour de 14 620–14 630 $/t, tandis que le COMEX a brièvement atteint environ 15 060 $/t. Le contango négatif (cash vs 3 mois) s’est élargi à environ 125 $/t, montrant que le métal immédiatement disponible bénéficie encore d’une forte prime malgré un dollar plus ferme.
⚙️ Le zinc est également resté relativement tendu, avec une backwardation proche de 106 $/t. Des frais de traitement fortement négatifs en Chine et la revue par Nyrstar de l’usine de fonderie de Budel ont ajouté davantage d’inquiétudes sur l’offre. Le nickel était plus faible, les stocks continuant de s’accumuler.
🏗️ Le minerai de fer n’a pas suivi la hausse du cuivre. Les prix sont restés autour de 713–715 CNY/t sur Dalian et de 95–96 $/t sur SGX, tandis que les stocks des ports chinois montaient à environ 145,45 millions de tonnes. Le réassort avant la Golden Week a aidé, mais les marges sidérurgiques faibles et l’entretien des hauts fourneaux ont limité la demande.
📌 Cette semaine n’a pas été un désengagement uniforme pour l’ensemble des métaux. Les métaux précieux restent principalement portés par les rendements et le dollar, tandis que le cuivre et le zinc sont toujours soutenus par la tension physique. Le PCE américain sera déterminant pour l’or et l’argent, tandis que la demande post-fêtes en Chine comptera davantage pour le cuivre et le minerai de fer.
#Metals $XAU $XAG $XCU

37
Voir la traduction
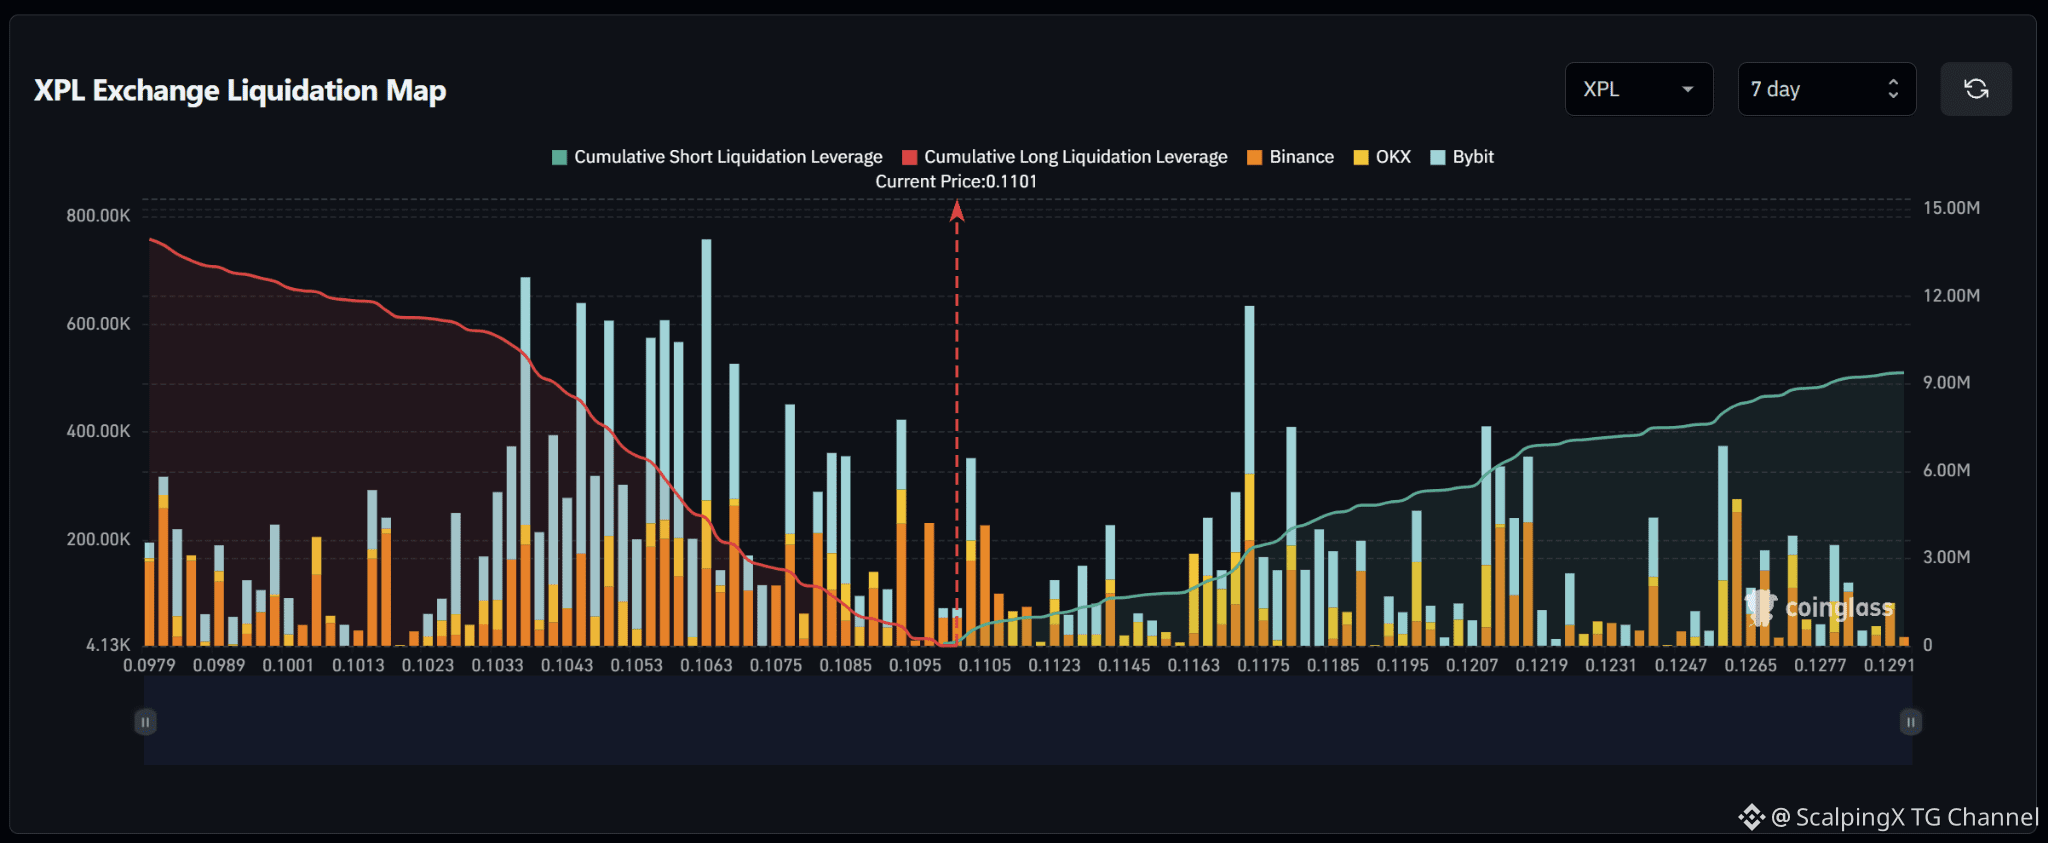
$XPL – Liquidation Map (7 Days) – Current Price 0.1101 🔎 The 7-day liquidation map shows roughly 13–14 million USD in long liquidations below the current price, exceeding approximately 9 million USD in short liquidations above. The liquidity structure therefore favors the downside, with around 1.5 times more cumulative liquidity below the market. 📉 Below the market, long-liquidation liquidity is concentrated heavily across 0.103–0.108. The strongest cluster sits around 0.1062–0.1065 with a bar near 0.75 million USD, while 0.1035–0.1055 contains several bars around 0.55–0.68 million USD. Losing 0.1095 would shift attention toward 0.1085–0.1075 and then 0.1065–0.1045. 📈 Above the market, short-liquidation liquidity is concentrated mainly across 0.116–0.122. The strongest cluster sits around 0.1172–0.1175 with a bar near 0.63 million USD, while 0.1208–0.1218 contains several bars around 0.35–0.40 million USD. Further out, 0.1260–0.1266 holds another notable liquidity pocket. 🧭 The broader setup favors the downside because long-liquidation exposure below is larger. Losing 0.1095 would increase the probability of a sweep toward 0.1085–0.1075, followed by 0.1065–0.1045. Breaking above 0.1145 would instead expose 0.1172–0.1175 and then 0.1208–0.1218.
$XPL – Liquidation Map (7 Days) – Current Price 0.1101 🔎 The 7-day liquidation map shows roughly 13–14 million USD in long liquidations below the current price, exceeding approximately 9 million USD in short liquidations above. The liquidity structure therefore favors the downside, with around 1.5 times more cumulative liquidity below the market. 📉 Below the market, long-liquidation liquidity is concentrated heavily across 0.103–0.108. The strongest cluster sits around 0.1062–0.1065 with a bar near 0.75 million USD, while 0.1035–0.1055 contains several bars around 0.55–0.68 million USD. Losing 0.1095 would shift attention toward 0.1085–0.1075 and then 0.1065–0.1045. 📈 Above the market, short-liquidation liquidity is concentrated mainly across 0.116–0.122. The strongest cluster sits around 0.1172–0.1175 with a bar near 0.63 million USD, while 0.1208–0.1218 contains several bars around 0.35–0.40 million USD. Further out, 0.1260–0.1266 holds another notable liquidity pocket. 🧭 The broader setup favors the downside because long-liquidation exposure below is larger. Losing 0.1095 would increase the probability of a sweep toward 0.1085–0.1075, followed by 0.1065–0.1045. Breaking above 0.1145 would instead expose 0.1172–0.1175 and then 0.1208–0.1218.
5
Voir la traduction
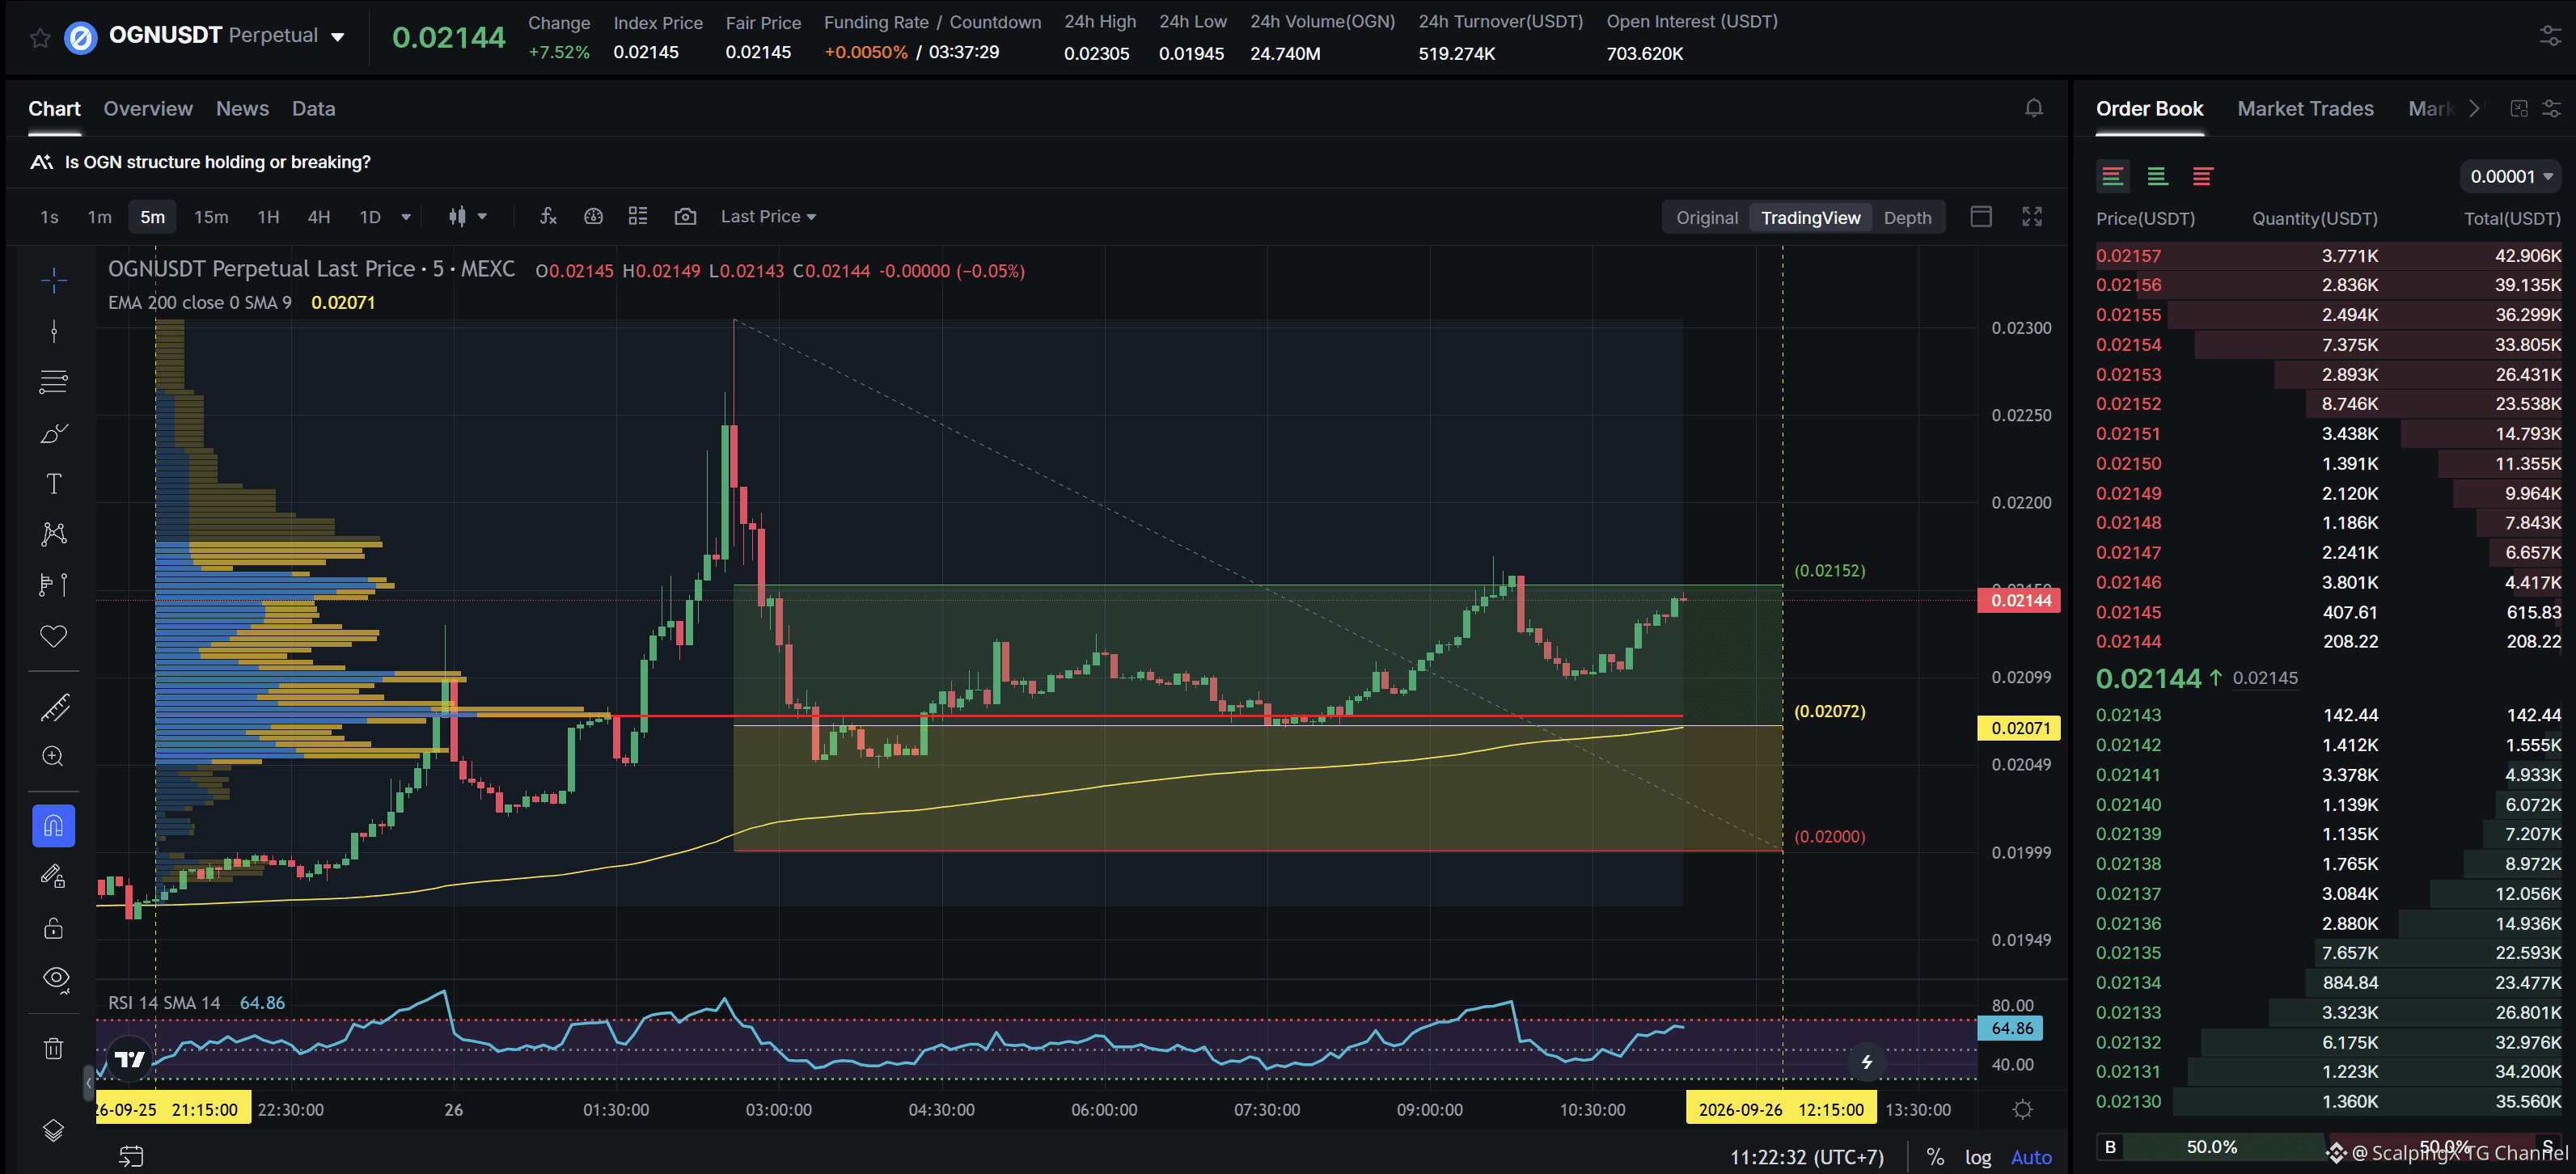
$OGN - Mcap 14.8M$ - 24h Sentiment +5.76 Bullish SC02 M5 - pending Long order. Entry lies within LVN + not affected by any weak zone, the current support zone is approximately 3.40% wide. The uptrend has lasted 14 hours 5 minutes, with a maximum recorded price increase of 17.02%. If price loses this support zone, the trend is highly likely to reverse downward.
$OGN - Mcap 14.8M$ - 24h Sentiment +5.76 Bullish SC02 M5 - pending Long order. Entry lies within LVN + not affected by any weak zone, the current support zone is approximately 3.40% wide. The uptrend has lasted 14 hours 5 minutes, with a maximum recorded price increase of 17.02%. If price loses this support zone, the trend is highly likely to reverse downward.
6
Voir la traduction
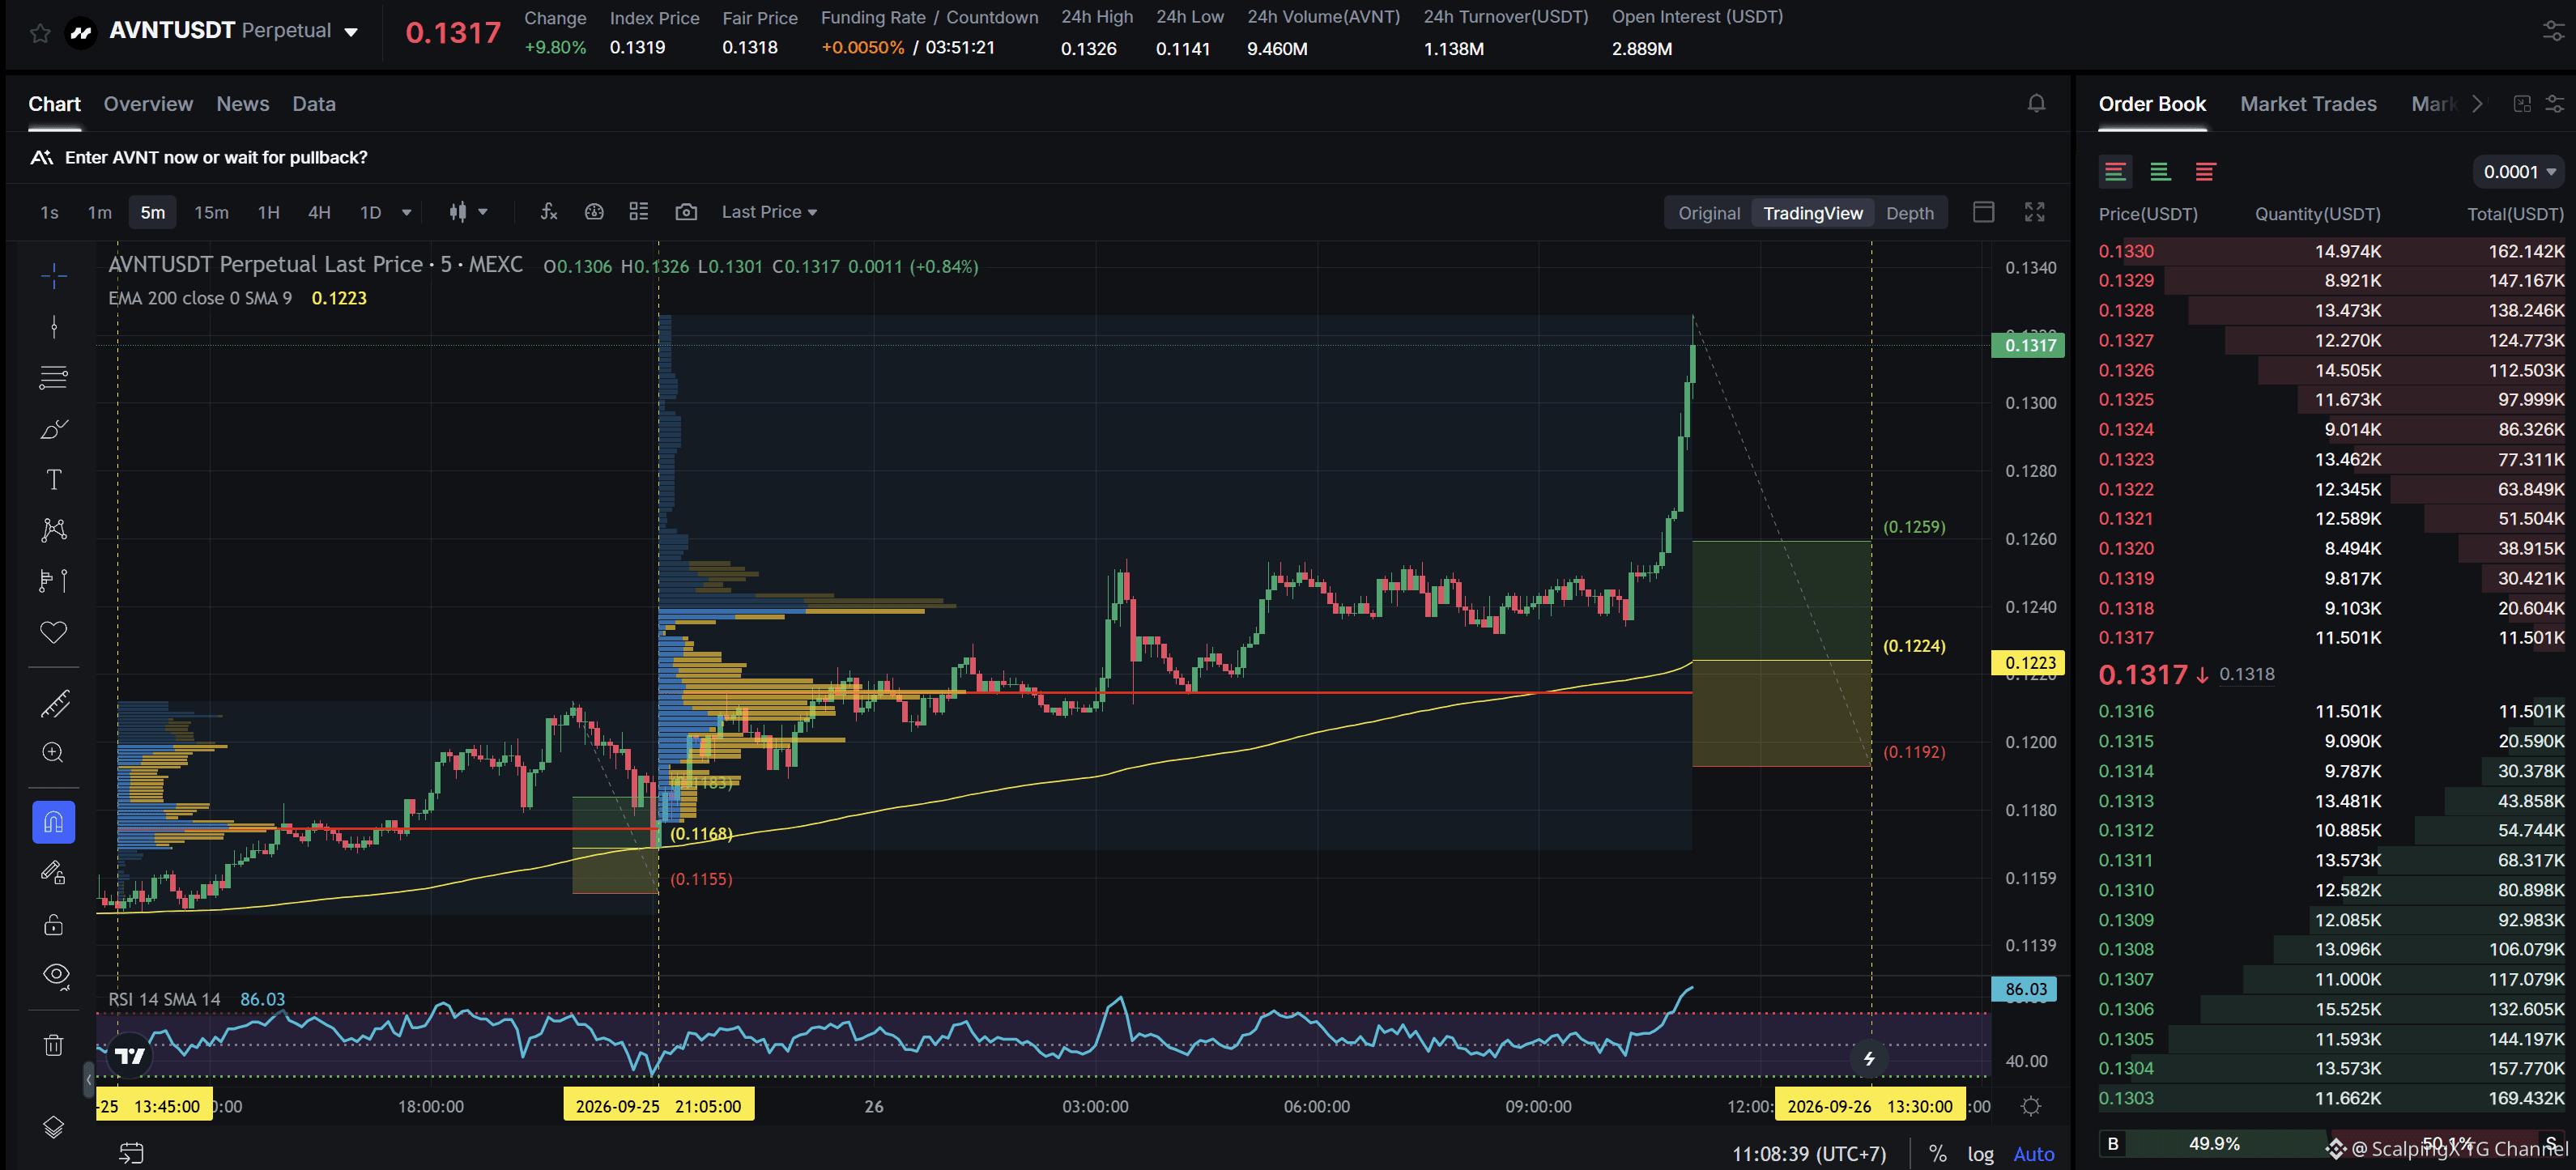
$AVNT - Mcap 47.11M$ - 24h Sentiment +6.00 Bullish SC02 M5 - pending Long order. Entry contains POC + meets positive simplification with a previously highly profitable Long order, the current support zone is approximately 2.65% wide. The uptrend has lasted 14 hours, with a maximum recorded price increase of 14.03%. If price loses this support zone, the trend is highly likely to reverse downward.
$AVNT - Mcap 47.11M$ - 24h Sentiment +6.00 Bullish SC02 M5 - pending Long order. Entry contains POC + meets positive simplification with a previously highly profitable Long order, the current support zone is approximately 2.65% wide. The uptrend has lasted 14 hours, with a maximum recorded price increase of 14.03%. If price loses this support zone, the trend is highly likely to reverse downward.
2
Le dollar (USD) clôture une deuxième hausse hebdomadaire consécutive alors que les rendements américains et les attentes envers la Fed progressent
💵 L’USD est resté dominant durant la semaine du 21 au 25 septembre : l’indice DXY est passé d’environ 100,2–100,4 à près de 101,40, son plus haut niveau depuis environ deux mois, avant de revenir vers 101 en fin de semaine. Le mouvement a été principalement porté par un réajustement plus large vers une Fed plus “hawkish”, plutôt que par un événement unique.
📈 Les données flash du PMI américain de septembre ont particulièrement retenu l’attention : l’indice Composite a grimpé à 58,4, les Services à 58,7 et l’Industrie manufacturière à 57,0. Une croissance plus solide, conjuguée à des coûts d’intrants plus élevés, a poussé les marchés à intégrer une probabilité plus forte d’une nouvelle hausse de taux de la Fed en octobre, tout en faisant monter les rendements des Treasuries américains.
🌍 Des conditions économiques divergentes ont aussi soutenu le dollar. Le PMI de la zone euro s’est amélioré, aidant l’EUR à mieux résister relativement, tandis que la livre britannique (GBP) a subi des pressions liées à des données britanniques plus faibles. L’AUD et le CAD se sont également affaiblis, la force globale de l’USD l’emportant sur le soutien venant des anticipations de la RBA et des mouvements du prix du pétrole.
🇯🇵 Le principal fait marquant de fin de semaine a été le JPY. La paire USD/JPY s’est approchée de 159 avant de chuter nettement, les signaux en provenance du Japon renforçant les inquiétudes concernant une faiblesse excessive du yen et maintenant le risque d’intervention au premier plan. Le rebond du yen a permis au DXY de se calmer vendredi, mais n’a pas modifié la tendance hebdomadaire plus large.
🛢️ Des prix du pétrole élevés et les tensions au Moyen-Orient ont continué d’alimenter les pressions inflationnistes mondiales, renforçant l’argument en faveur de rendements américains plus élevés. Toutefois, le repli du pétrole en fin de semaine a aussi montré que les gains de l’USD pouvaient faire l’objet de corrections temporaires, à mesure que les anticipations géopolitiques évoluent.
📅 L’attention se tourne désormais vers la décision de la RBA du 29 septembre et l’inflation PCE américaine du 30 septembre. Si l’inflation américaine reste solide, les rendements et le dollar pourraient continuer d’être soutenus ; un chiffre PCE plus faible que prévu offrirait davantage de marge aux devises fortement vendues pour un rebond technique.
#ForexInsights
$BTC
Le dollar (USD) clôture une deuxième hausse hebdomadaire consécutive alors que les rendements américains et les attentes envers la Fed progressent
💵 L’USD est resté dominant durant la semaine du 21 au 25 septembre : l’indice DXY est passé d’environ 100,2–100,4 à près de 101,40, son plus haut niveau depuis environ deux mois, avant de revenir vers 101 en fin de semaine. Le mouvement a été principalement porté par un réajustement plus large vers une Fed plus “hawkish”, plutôt que par un événement unique.
📈 Les données flash du PMI américain de septembre ont particulièrement retenu l’attention : l’indice Composite a grimpé à 58,4, les Services à 58,7 et l’Industrie manufacturière à 57,0. Une croissance plus solide, conjuguée à des coûts d’intrants plus élevés, a poussé les marchés à intégrer une probabilité plus forte d’une nouvelle hausse de taux de la Fed en octobre, tout en faisant monter les rendements des Treasuries américains.
🌍 Des conditions économiques divergentes ont aussi soutenu le dollar. Le PMI de la zone euro s’est amélioré, aidant l’EUR à mieux résister relativement, tandis que la livre britannique (GBP) a subi des pressions liées à des données britanniques plus faibles. L’AUD et le CAD se sont également affaiblis, la force globale de l’USD l’emportant sur le soutien venant des anticipations de la RBA et des mouvements du prix du pétrole.
🇯🇵 Le principal fait marquant de fin de semaine a été le JPY. La paire USD/JPY s’est approchée de 159 avant de chuter nettement, les signaux en provenance du Japon renforçant les inquiétudes concernant une faiblesse excessive du yen et maintenant le risque d’intervention au premier plan. Le rebond du yen a permis au DXY de se calmer vendredi, mais n’a pas modifié la tendance hebdomadaire plus large.
🛢️ Des prix du pétrole élevés et les tensions au Moyen-Orient ont continué d’alimenter les pressions inflationnistes mondiales, renforçant l’argument en faveur de rendements américains plus élevés. Toutefois, le repli du pétrole en fin de semaine a aussi montré que les gains de l’USD pouvaient faire l’objet de corrections temporaires, à mesure que les anticipations géopolitiques évoluent.
📅 L’attention se tourne désormais vers la décision de la RBA du 29 septembre et l’inflation PCE américaine du 30 septembre. Si l’inflation américaine reste solide, les rendements et le dollar pourraient continuer d’être soutenus ; un chiffre PCE plus faible que prévu offrirait davantage de marge aux devises fortement vendues pour un rebond technique.
#ForexInsights
$BTC
💵 L’USD est resté dominant durant la semaine du 21 au 25 septembre : l’indice DXY est passé d’environ 100,2–100,4 à près de 101,40, son plus haut niveau depuis environ deux mois, avant de revenir vers 101 en fin de semaine. Le mouvement a été principalement porté par un réajustement plus large vers une Fed plus “hawkish”, plutôt que par un événement unique.
📈 Les données flash du PMI américain de septembre ont particulièrement retenu l’attention : l’indice Composite a grimpé à 58,4, les Services à 58,7 et l’Industrie manufacturière à 57,0. Une croissance plus solide, conjuguée à des coûts d’intrants plus élevés, a poussé les marchés à intégrer une probabilité plus forte d’une nouvelle hausse de taux de la Fed en octobre, tout en faisant monter les rendements des Treasuries américains.
🌍 Des conditions économiques divergentes ont aussi soutenu le dollar. Le PMI de la zone euro s’est amélioré, aidant l’EUR à mieux résister relativement, tandis que la livre britannique (GBP) a subi des pressions liées à des données britanniques plus faibles. L’AUD et le CAD se sont également affaiblis, la force globale de l’USD l’emportant sur le soutien venant des anticipations de la RBA et des mouvements du prix du pétrole.
🇯🇵 Le principal fait marquant de fin de semaine a été le JPY. La paire USD/JPY s’est approchée de 159 avant de chuter nettement, les signaux en provenance du Japon renforçant les inquiétudes concernant une faiblesse excessive du yen et maintenant le risque d’intervention au premier plan. Le rebond du yen a permis au DXY de se calmer vendredi, mais n’a pas modifié la tendance hebdomadaire plus large.
🛢️ Des prix du pétrole élevés et les tensions au Moyen-Orient ont continué d’alimenter les pressions inflationnistes mondiales, renforçant l’argument en faveur de rendements américains plus élevés. Toutefois, le repli du pétrole en fin de semaine a aussi montré que les gains de l’USD pouvaient faire l’objet de corrections temporaires, à mesure que les anticipations géopolitiques évoluent.
📅 L’attention se tourne désormais vers la décision de la RBA du 29 septembre et l’inflation PCE américaine du 30 septembre. Si l’inflation américaine reste solide, les rendements et le dollar pourraient continuer d’être soutenus ; un chiffre PCE plus faible que prévu offrirait davantage de marge aux devises fortement vendues pour un rebond technique.
#ForexInsights
$BTC

1
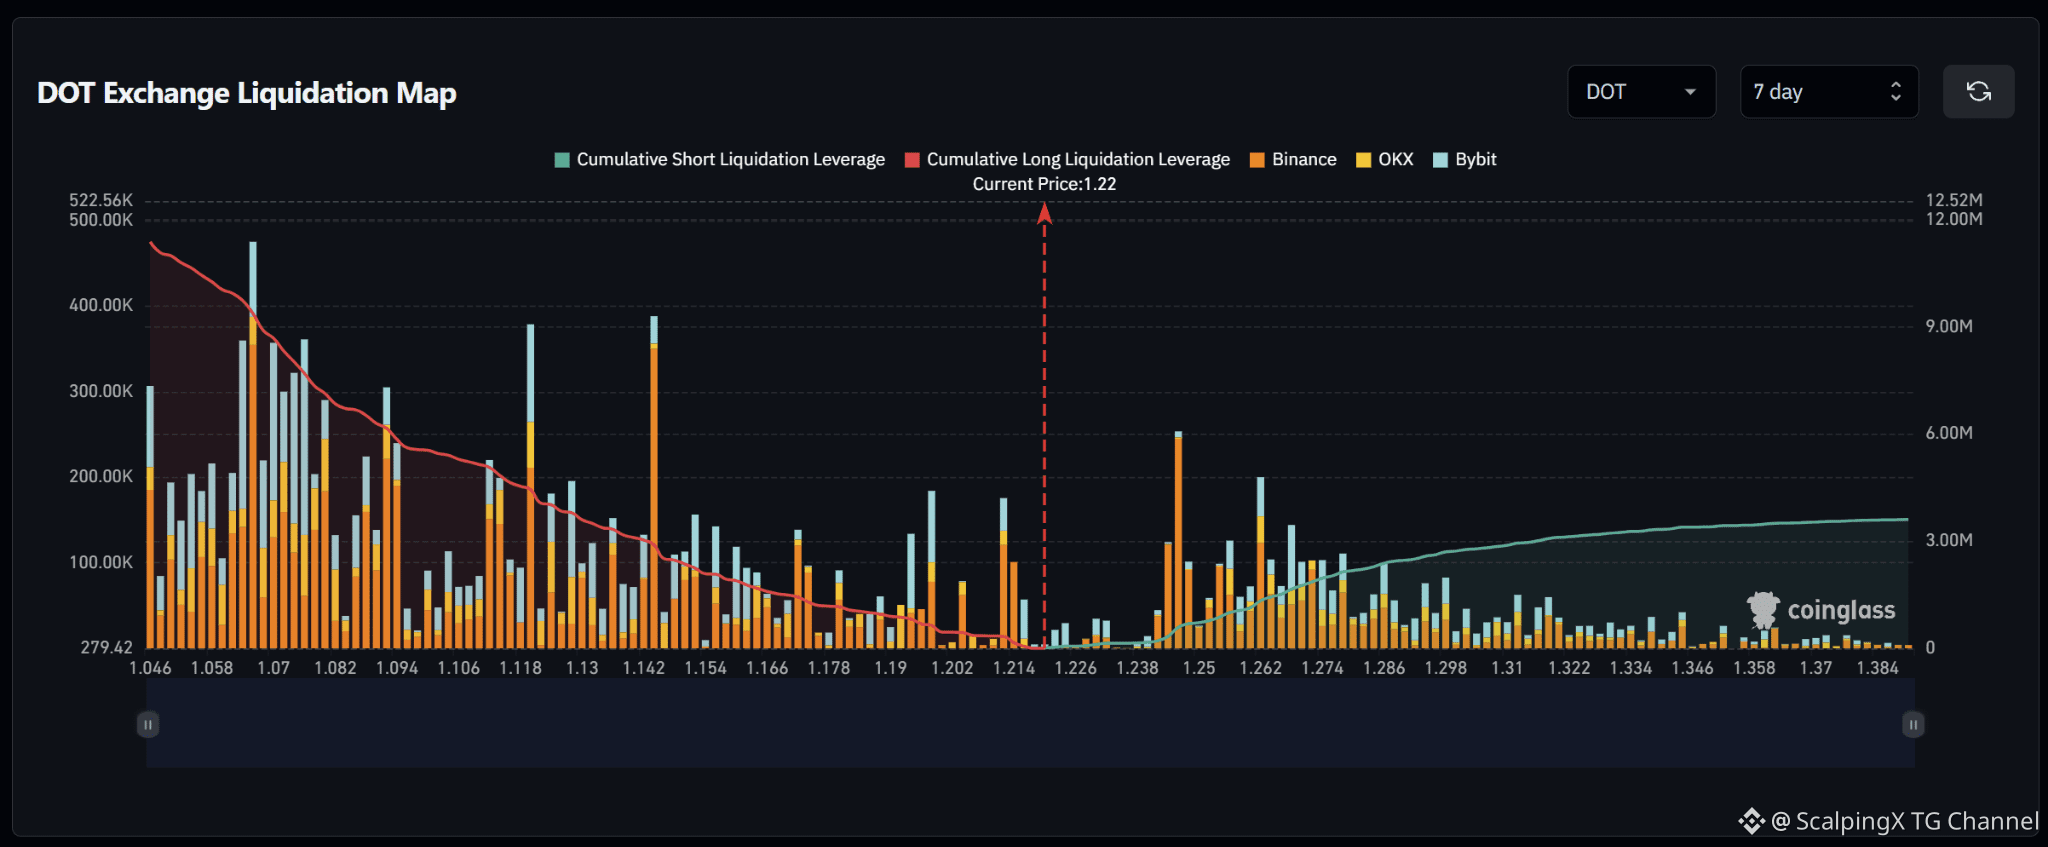
$DOT – Carte de liquidation (7 jours) – Prix actuel 1.22 🔎 La carte des liquidations sur 7 jours montre environ 11,5–12 millions USD de liquidations longues sous le prix actuel, ce qui dépasse largement environ 3 millions USD de liquidations courtes au-dessus. La structure de liquidité favorise donc fortement la baisse, avec près de quatre fois plus de liquidité cumulée sous le marché. 📉 Sous le marché, la liquidité liée aux liquidations longues est fortement concentrée entre 1.06–1.15. Le cluster le plus solide se situe autour de 1.066–1.070, avec une barre proche de 0,48 million USD ; les zones 1.118–1.120 et 1.142–1.144 contiennent aussi des barres d’environ 0,38–0,39 million USD. Perdre 1.214 ferait passer l’attention vers 1.202–1.190 puis 1.178–1.166. 📈 Au-dessus du marché, la liquidité des liquidations courtes est beaucoup plus ténue. Le cluster le plus notable se situe autour de 1.248–1.250, avec une barre proche de 0,25 million USD, tandis que 1.262 et 1.274 conservent des poches supplémentaires d’environ 0,10–0,20 million USD. Au-dessus de 1.30, la densité de liquidité diminue progressivement. 🧭 Le scénario plus large favorise clairement la baisse car l’exposition aux liquidations longues sous le marché domine. Perdre 1.214 augmenterait la probabilité d’un balayage vers 1.202–1.190, puis 1.178–1.166. Une cassure au-dessus de 1.238 exposerait plutôt 1.248–1.262 avant que l’attention ne se tourne vers 1.274.
$DOT – Carte de liquidation (7 jours) – Prix actuel 1.22 🔎 La carte des liquidations sur 7 jours montre environ 11,5–12 millions USD de liquidations longues sous le prix actuel, ce qui dépasse largement environ 3 millions USD de liquidations courtes au-dessus. La structure de liquidité favorise donc fortement la baisse, avec près de quatre fois plus de liquidité cumulée sous le marché. 📉 Sous le marché, la liquidité liée aux liquidations longues est fortement concentrée entre 1.06–1.15. Le cluster le plus solide se situe autour de 1.066–1.070, avec une barre proche de 0,48 million USD ; les zones 1.118–1.120 et 1.142–1.144 contiennent aussi des barres d’environ 0,38–0,39 million USD. Perdre 1.214 ferait passer l’attention vers 1.202–1.190 puis 1.178–1.166. 📈 Au-dessus du marché, la liquidité des liquidations courtes est beaucoup plus ténue. Le cluster le plus notable se situe autour de 1.248–1.250, avec une barre proche de 0,25 million USD, tandis que 1.262 et 1.274 conservent des poches supplémentaires d’environ 0,10–0,20 million USD. Au-dessus de 1.30, la densité de liquidité diminue progressivement. 🧭 Le scénario plus large favorise clairement la baisse car l’exposition aux liquidations longues sous le marché domine. Perdre 1.214 augmenterait la probabilité d’un balayage vers 1.202–1.190, puis 1.178–1.166. Une cassure au-dessus de 1.238 exposerait plutôt 1.248–1.262 avant que l’attention ne se tourne vers 1.274.
1
Connectez-vous pour découvrir plus de contenu
Rejoignez la communauté mondiale des adeptes de cryptomonnaies sur Binance Square
⚡️ Suviez les dernières informations importantes sur les cryptomonnaies.
💬 Jugé digne de confiance par la plus grande plateforme d’échange de cryptomonnaies au monde.
👍 Découvrez les connaissances que partagent les créateurs vérifiés.
Adresse e-mail/Nº de téléphone
Sujets d’actualité
StrategyStriveAdd2305BitcoinThisWeek
8,038 vues
319 mentions
🔥 2 305 BTC en une semaine — Regardez $BTC
Les trésoreries d’entreprise en Bitcoin continuent de s’étendre.
La stratégie « Strategy + Strive » a ajouté 2 305 $BTC, portant leurs avoirs déclarés combinés à environ 872 K BTC.
Cela ne garantit pas la direction du prix ensuite — mais cela montre pourquoi l’offre fixe de Bitcoin reste une partie majeure du débat d’investissement.
Achetez $BTC au comptant. Propriété réelle. Aucun levier requis. 📊🟠
#strategystriveadd2305bitcointhisweek
CryptoMahibaloch
·1 mentions J’aime
·1.5k vues
TrumpRejectsIranHormuzReopening
12,951 vues
369 mentions
TokenizedStockDEXVolumeHits$20.9B
46 vues
3 mentions