

Sir Ismail 1
71 Publications

Sir Ismail 1
Signaler
Bloquer l’utilisateur
Digital Assets Content | Think Macro| Currently working with projects; $NAKA $AGATA $DIA $VETME
0 Suivis
2 Abonnés
13 J’aime
Publications
·
--
Voir la traduction
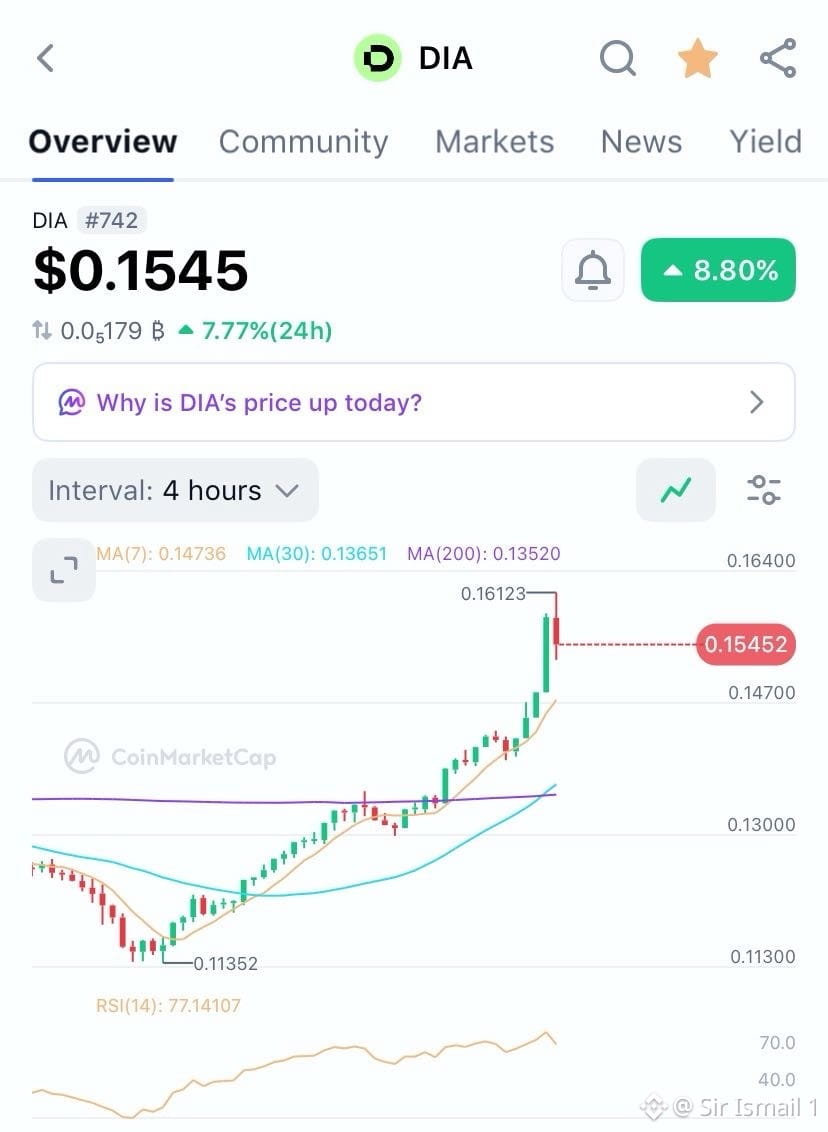
$DIA 4hr update
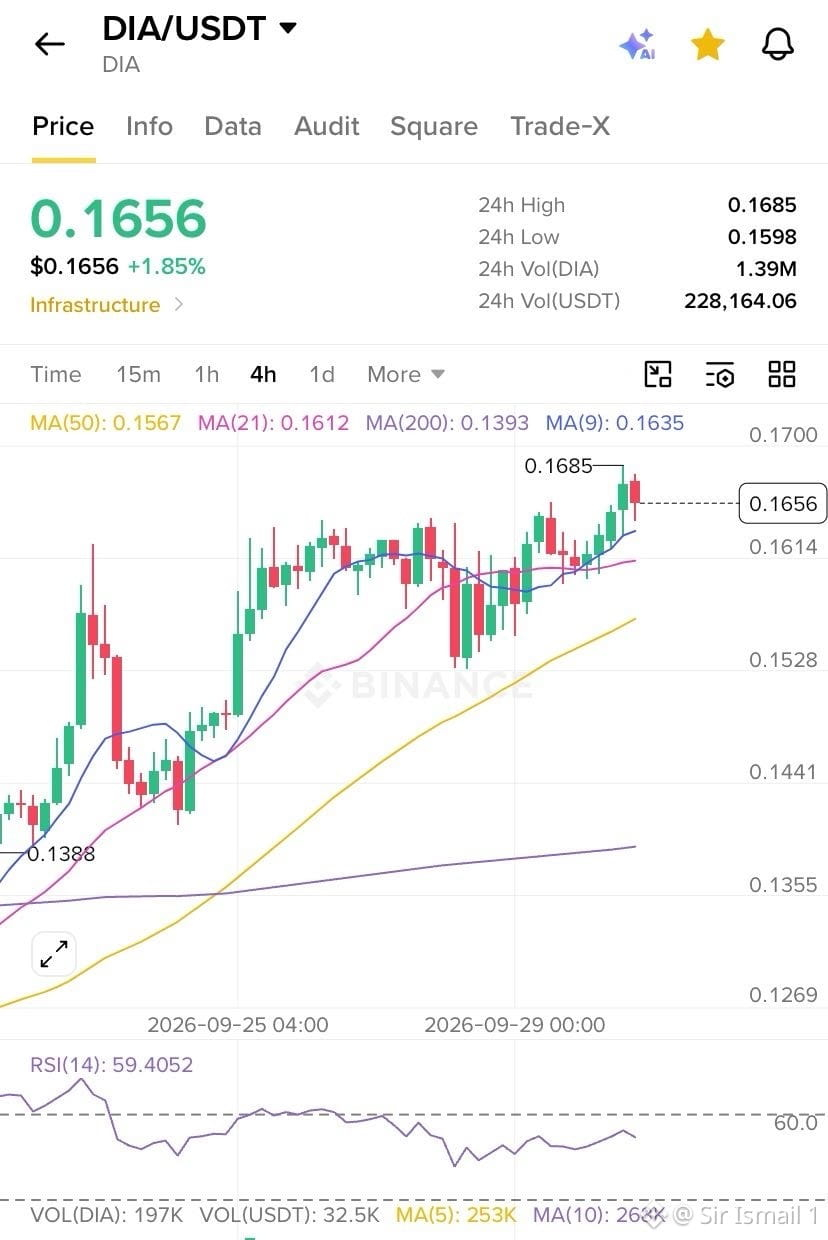
Broke the Line and price is around $0.165 after tagging $0.168.
The $0.164 ceiling we flagged got taken out. 24h held $0.160 as the dip. That’s acceptance above last week’s high, not a wick-and-fail.
Trend from the $0.114 base is still higher highs / higher lows. $0.154–0.160 is now the demand zone.
Next: hold $0.160–0.164 and clear $0.168 → $0.175 is the magnet.
Invalidation: lose $0.154, then $0.148.
$DIA 4hr update
Broke the Line and price is around $0.165 after tagging $0.168.
The $0.164 ceiling we flagged got taken out. 24h held $0.160 as the dip. That’s acceptance above last week’s high, not a wick-and-fail.
Trend from the $0.114 base is still higher highs / higher lows. $0.154–0.160 is now the demand zone.
Next: hold $0.160–0.164 and clear $0.168 → $0.175 is the magnet.
Invalidation: lose $0.154, then $0.148.
Broke the Line and price is around $0.165 after tagging $0.168.
The $0.164 ceiling we flagged got taken out. 24h held $0.160 as the dip. That’s acceptance above last week’s high, not a wick-and-fail.
Trend from the $0.114 base is still higher highs / higher lows. $0.154–0.160 is now the demand zone.
Next: hold $0.160–0.164 and clear $0.168 → $0.175 is the magnet.
Invalidation: lose $0.154, then $0.148.
64
·
--
Voir la traduction
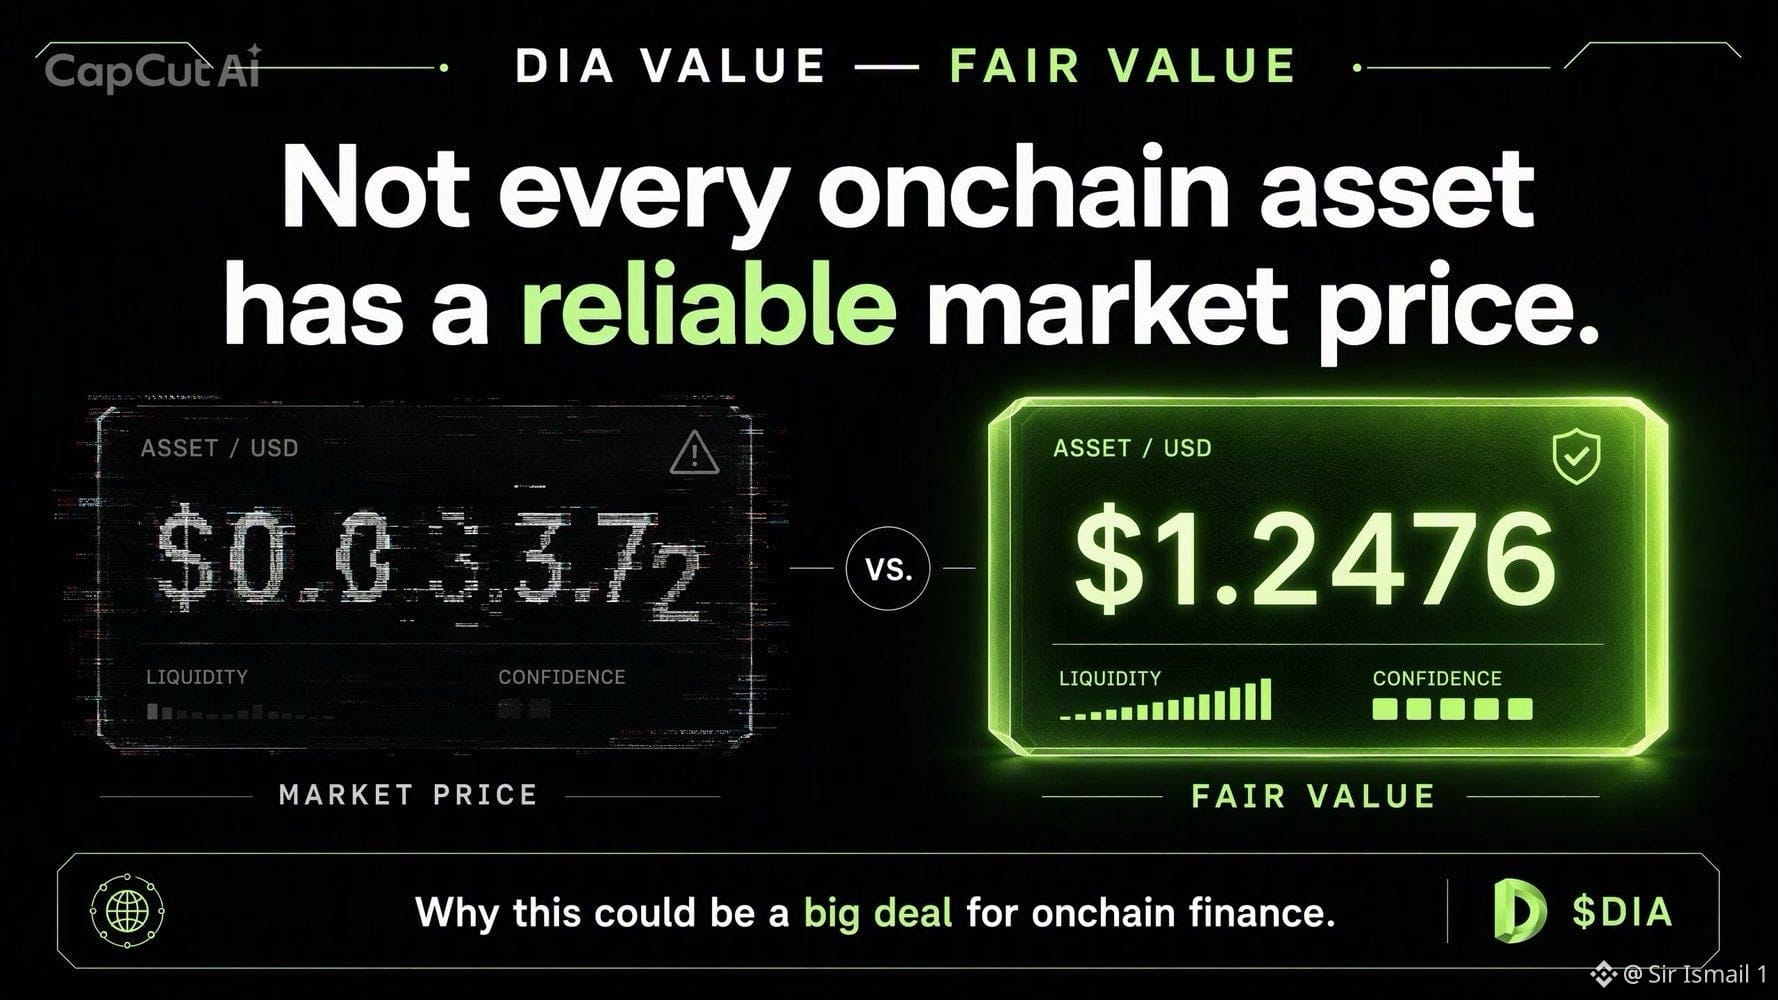
The next big oracle opportunity might not be about price. It might be about VALUE. 👀
Not every asset trades on a deep, liquid market.
That’s where DIA Value gets interesting.
Instead of simply mirroring a market price, DIA can calculate fair value using:
→ NAV
→ Proof of Reserves
→ Redemption Value
→ Contract Exchange Rates
→ Reserve Backing
→ Vault Share Pricing
This opens the door to better pricing for RWAs, stablecoins, yield-bearing assets, vaults and illiquid DeFi collateral.
Market price tells you what someone is trading at.
Fair value can tell you what the asset is actually worth.
That’s a powerful distinction for the next phase of onchain finance.
Stay bullish on $DIA
The next big oracle opportunity might not be about price. It might be about VALUE. 👀
Not every asset trades on a deep, liquid market.
That’s where DIA Value gets interesting.
Instead of simply mirroring a market price, DIA can calculate fair value using:
→ NAV
→ Proof of Reserves
→ Redemption Value
→ Contract Exchange Rates
→ Reserve Backing
→ Vault Share Pricing
This opens the door to better pricing for RWAs, stablecoins, yield-bearing assets, vaults and illiquid DeFi collateral.
Market price tells you what someone is trading at.
Fair value can tell you what the asset is actually worth.
That’s a powerful distinction for the next phase of onchain finance.
Stay bullish on $DIA
Not every asset trades on a deep, liquid market.
That’s where DIA Value gets interesting.
Instead of simply mirroring a market price, DIA can calculate fair value using:
→ NAV
→ Proof of Reserves
→ Redemption Value
→ Contract Exchange Rates
→ Reserve Backing
→ Vault Share Pricing
This opens the door to better pricing for RWAs, stablecoins, yield-bearing assets, vaults and illiquid DeFi collateral.
Market price tells you what someone is trading at.
Fair value can tell you what the asset is actually worth.
That’s a powerful distinction for the next phase of onchain finance.
Stay bullish on $DIA
62
·
--
$DIA 4H Update
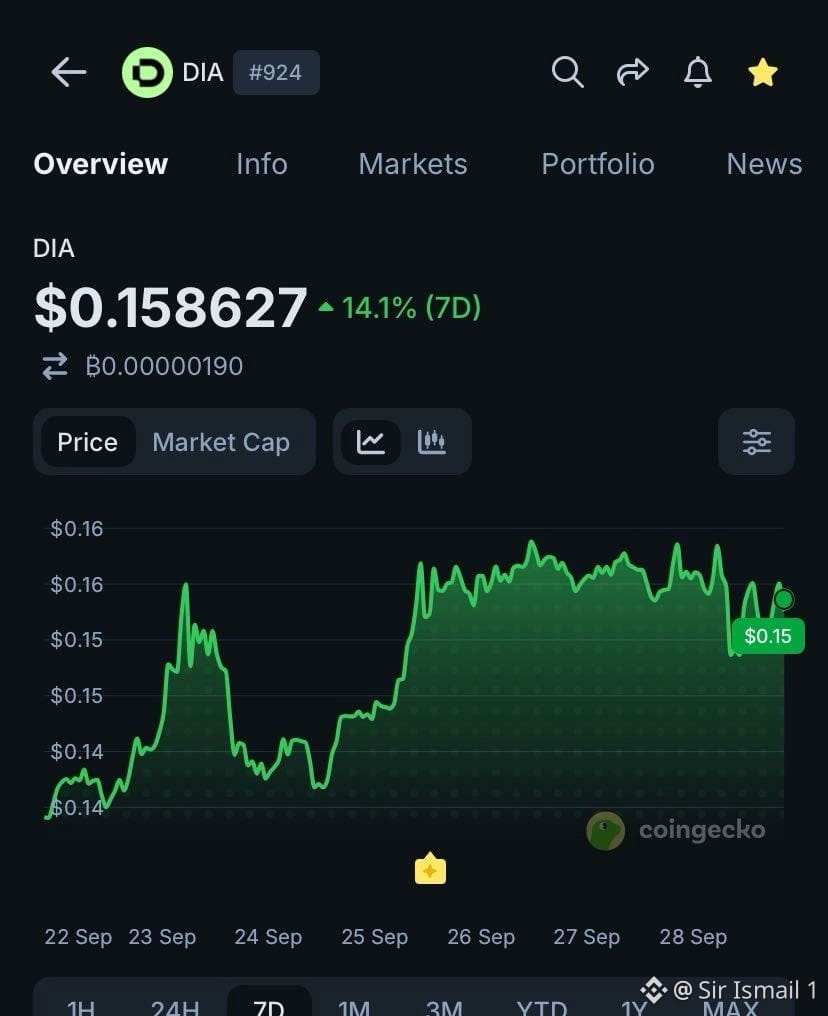
Rejeté à 0,164, maintenant ~0,158.
Maintient 0,153–0,154 pour l’instant.
Scénario haussier : Reprendre 0,164 → 0,170–0,175
Scénario baissier : Perdre 0,148 → 0,141
0,148 reste la ligne.
Quelle est votre tendance ?
$DIA 4H Update
Rejeté à 0,164, maintenant ~0,158.
Maintient 0,153–0,154 pour l’instant.
Scénario haussier : Reprendre 0,164 → 0,170–0,175
Scénario baissier : Perdre 0,148 → 0,141
0,148 reste la ligne.
Quelle est votre tendance ?
Rejeté à 0,164, maintenant ~0,158.
Maintient 0,153–0,154 pour l’instant.
Scénario haussier : Reprendre 0,164 → 0,170–0,175
Scénario baissier : Perdre 0,148 → 0,141
0,148 reste la ligne.
Quelle est votre tendance ?
58
·
--
C’est l’une des parties les plus sous-estimées de la thèse $DIA.
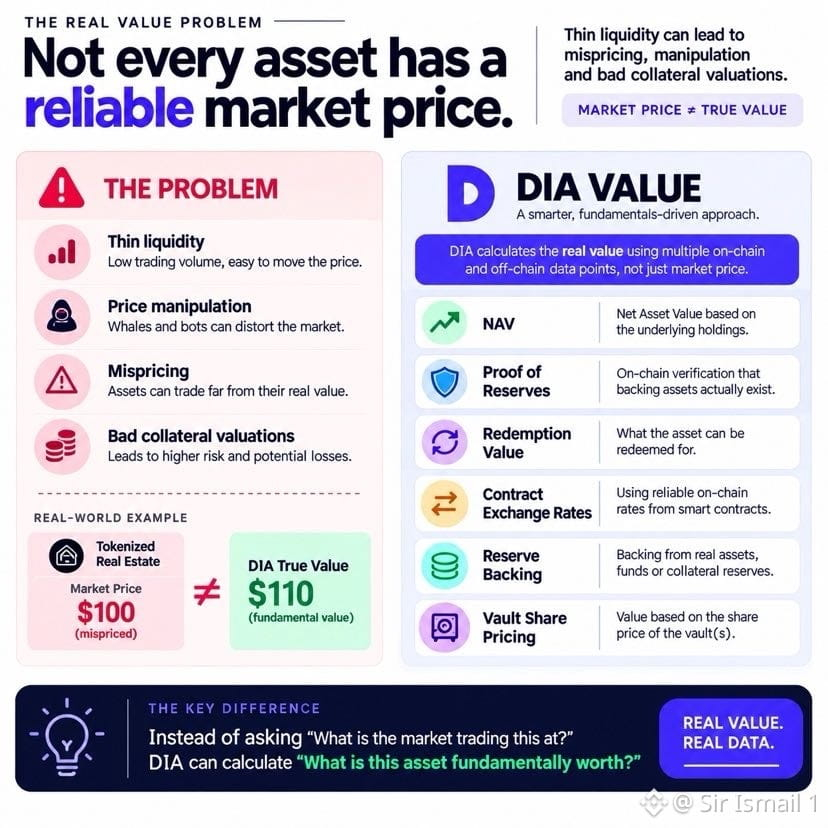
Tous les actifs n’ont pas un prix de marché fiable.
Une liquidité faible peut entraîner une mauvaise valorisation, de la manipulation et de mauvaises évaluations des garanties.
La valeur DIA adopte une approche différente :
→ VNI
→ Preuve des réserves
→ Valeur de rachat
→ Taux de change du contrat
→ Couverture des réserves
→ Tarification des parts de coffre
Au lieu de simplement demander : « À combien le marché le négocie-t-il ? »
DIA peut calculer : « Quelle est la valeur fondamentale de cet actif ? »
Cela ouvre une opportunité beaucoup plus large dans l’ensemble de DeFi, des RWA, des stablecoins, des fonds et des actifs tokenisés.
Une infrastructure de juste valeur pourrait devenir une composante majeure de la chaîne financière onchain.
C’est pourquoi je suis de plus en plus optimiste à propos de la thèse DIA Value.
$DIA
C’est l’une des parties les plus sous-estimées de la thèse $DIA.
Tous les actifs n’ont pas un prix de marché fiable.
Une liquidité faible peut entraîner une mauvaise valorisation, de la manipulation et de mauvaises évaluations des garanties.
La valeur DIA adopte une approche différente :
→ VNI
→ Preuve des réserves
→ Valeur de rachat
→ Taux de change du contrat
→ Couverture des réserves
→ Tarification des parts de coffre
Au lieu de simplement demander : « À combien le marché le négocie-t-il ? »
DIA peut calculer : « Quelle est la valeur fondamentale de cet actif ? »
Cela ouvre une opportunité beaucoup plus large dans l’ensemble de DeFi, des RWA, des stablecoins, des fonds et des actifs tokenisés.
Une infrastructure de juste valeur pourrait devenir une composante majeure de la chaîne financière onchain.
C’est pourquoi je suis de plus en plus optimiste à propos de la thèse DIA Value.
$DIA
Tous les actifs n’ont pas un prix de marché fiable.
Une liquidité faible peut entraîner une mauvaise valorisation, de la manipulation et de mauvaises évaluations des garanties.
La valeur DIA adopte une approche différente :
→ VNI
→ Preuve des réserves
→ Valeur de rachat
→ Taux de change du contrat
→ Couverture des réserves
→ Tarification des parts de coffre
Au lieu de simplement demander : « À combien le marché le négocie-t-il ? »
DIA peut calculer : « Quelle est la valeur fondamentale de cet actif ? »
Cela ouvre une opportunité beaucoup plus large dans l’ensemble de DeFi, des RWA, des stablecoins, des fonds et des actifs tokenisés.
Une infrastructure de juste valeur pourrait devenir une composante majeure de la chaîne financière onchain.
C’est pourquoi je suis de plus en plus optimiste à propos de la thèse DIA Value.
$DIA
63
·
--
Voir la traduction
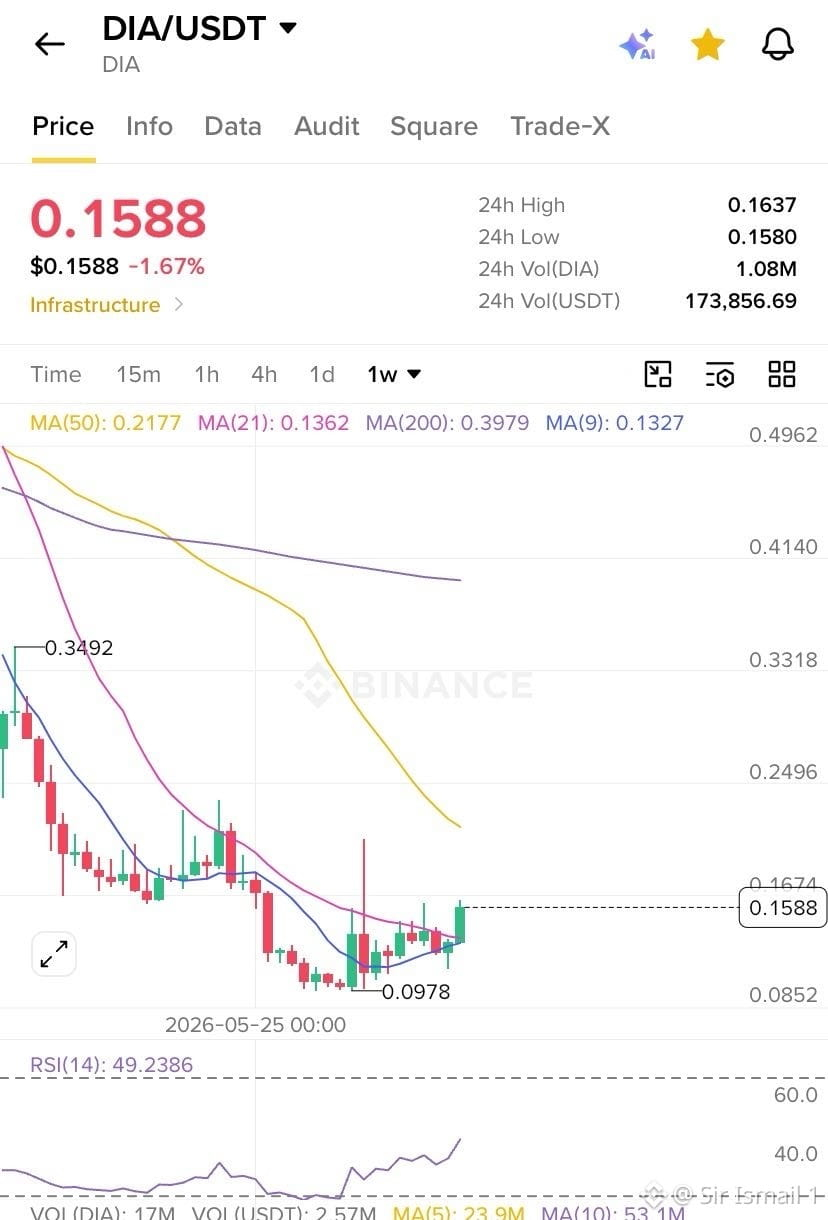
$DIA weekly update
Price is around $0.161, after a +22% week.
The week opened near $0.130–0.133, held the $0.114 base from last week, then ran through $0.141 / $0.148 and tagged $0.163–0.164.
That’s a full reclaim of the early-September range.
Weekly structure flipped from “sell the rip” to higher-low off $0.114.
Key Levels
• Resistance: $0.164, then $0.170–0.175
• Support: $0.154–0.148, then $0.141 / $0.130
Bull Case
Hold $0.154–0.148 and close the week above $0.160. Break $0.164 and $0.170–0.175 is the next magnet.
Bear Case
Lose $0.148. That puts $0.141 back in play, then a deeper retrace toward $0.130.
Best weekly close in a while. Trend is up until $0.148 breaks. $0.164 is the continuation level.
$DIA weekly update
Price is around $0.161, after a +22% week.
The week opened near $0.130–0.133, held the $0.114 base from last week, then ran through $0.141 / $0.148 and tagged $0.163–0.164.
That’s a full reclaim of the early-September range.
Weekly structure flipped from “sell the rip” to higher-low off $0.114.
Key Levels
• Resistance: $0.164, then $0.170–0.175
• Support: $0.154–0.148, then $0.141 / $0.130
Bull Case
Hold $0.154–0.148 and close the week above $0.160. Break $0.164 and $0.170–0.175 is the next magnet.
Bear Case
Lose $0.148. That puts $0.141 back in play, then a deeper retrace toward $0.130.
Best weekly close in a while. Trend is up until $0.148 breaks. $0.164 is the continuation level.
Price is around $0.161, after a +22% week.
The week opened near $0.130–0.133, held the $0.114 base from last week, then ran through $0.141 / $0.148 and tagged $0.163–0.164.
That’s a full reclaim of the early-September range.
Weekly structure flipped from “sell the rip” to higher-low off $0.114.
Key Levels
• Resistance: $0.164, then $0.170–0.175
• Support: $0.154–0.148, then $0.141 / $0.130
Bull Case
Hold $0.154–0.148 and close the week above $0.160. Break $0.164 and $0.170–0.175 is the next magnet.
Bear Case
Lose $0.148. That puts $0.141 back in play, then a deeper retrace toward $0.130.
Best weekly close in a while. Trend is up until $0.148 breaks. $0.164 is the continuation level.
83
·
--
Voir la traduction
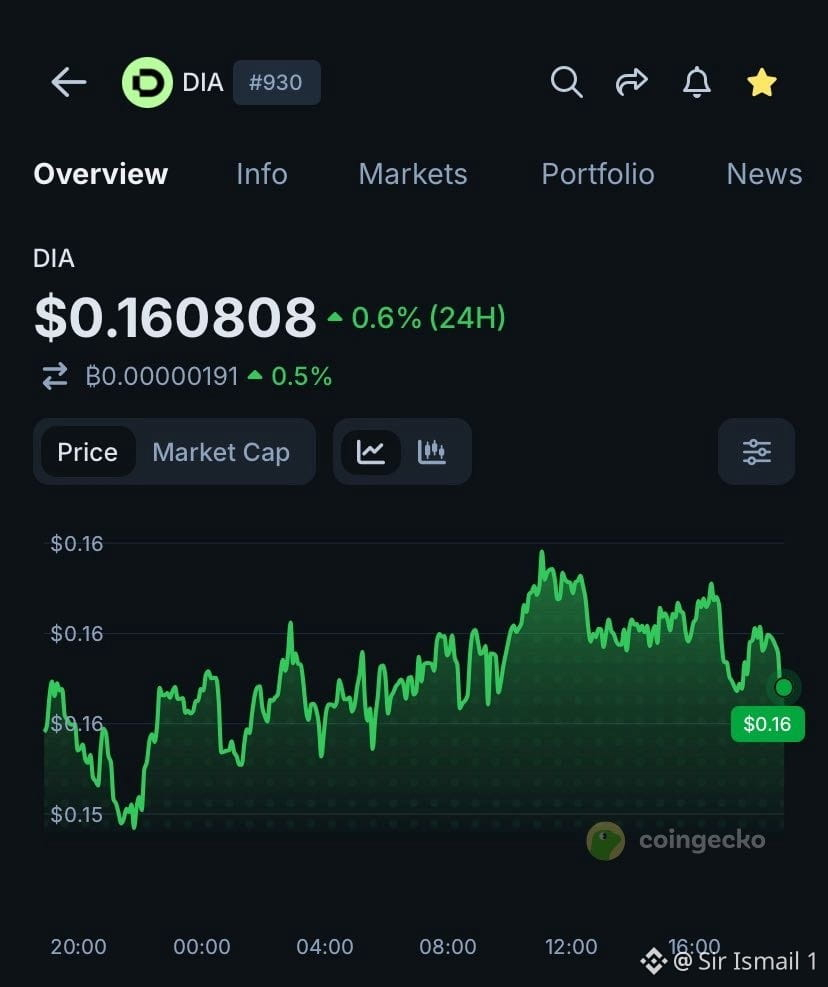
$DIA holding well
The $0.114 base printed. Now it’s ~$0.160–0.162.
That’s a clean run: $0.114 → $0.1625, pullback held, then bid back through the old high. 7D is about +23%.
Structure is higher highs / higher lows. Prior resistance at $0.148–0.154 is now support.
Bull path from here: hold $0.154–0.157 and break $0.164.
Next magnet is $0.170–0.175.
Invalidation for this 4H bid: lose $0.148, then $0.141.
$DIA holding well
The $0.114 base printed. Now it’s ~$0.160–0.162.
That’s a clean run: $0.114 → $0.1625, pullback held, then bid back through the old high. 7D is about +23%.
Structure is higher highs / higher lows. Prior resistance at $0.148–0.154 is now support.
Bull path from here: hold $0.154–0.157 and break $0.164.
Next magnet is $0.170–0.175.
Invalidation for this 4H bid: lose $0.148, then $0.141.
The $0.114 base printed. Now it’s ~$0.160–0.162.
That’s a clean run: $0.114 → $0.1625, pullback held, then bid back through the old high. 7D is about +23%.
Structure is higher highs / higher lows. Prior resistance at $0.148–0.154 is now support.
Bull path from here: hold $0.154–0.157 and break $0.164.
Next magnet is $0.170–0.175.
Invalidation for this 4H bid: lose $0.148, then $0.141.
52
·
--
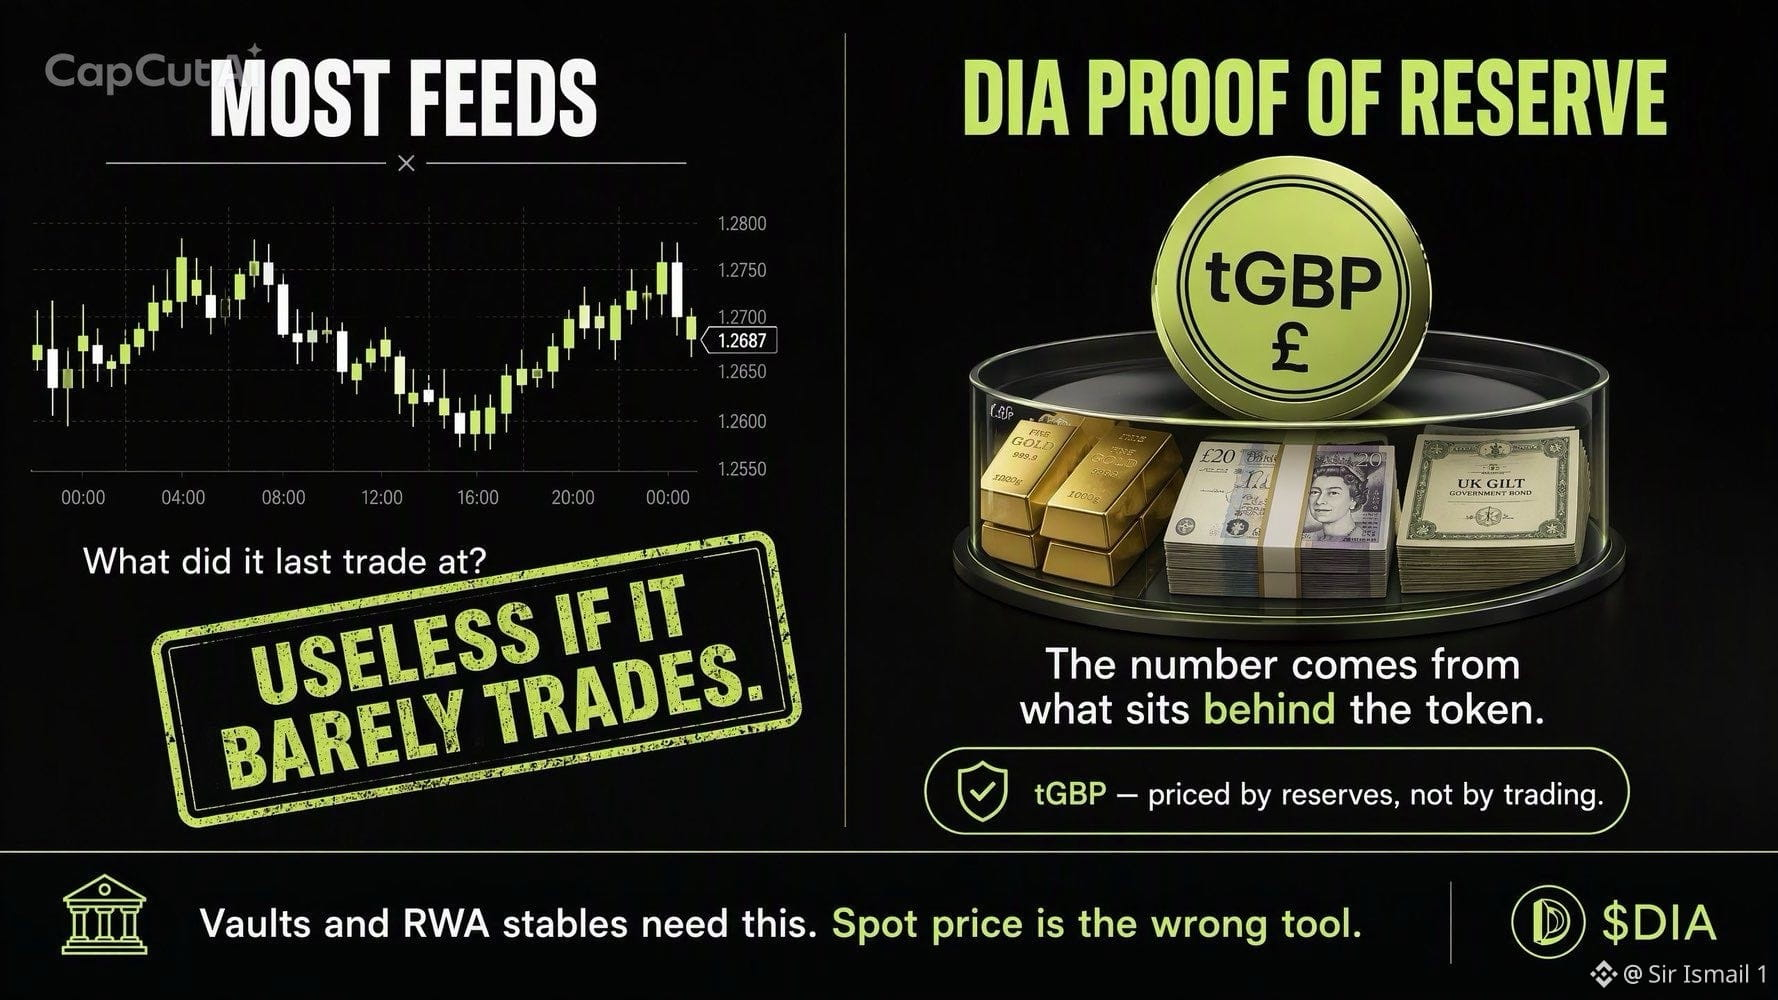
La plupart des flux répondent : « À combien ça s’est échangé pour la dernière fois ? »
C’est inutile si l’actif ne s’échange presque pas.
@DIAdata_org fixe aussi le prix par adossement.
Preuve de réserve : le chiffre provient de ce qui se trouve derrière le token, pas d’un mince relevé d’un DEX.
Ils l’ont déjà fait pour tGBP — un prix basé sur les réserves, pas sur les transactions.
Les stablecoins RWA et les vaults en ont besoin. Le prix spot est le mauvais outil.
Restez optimistes
$DIA
La plupart des flux répondent : « À combien ça s’est échangé pour la dernière fois ? »
C’est inutile si l’actif ne s’échange presque pas.
@DIAdata_org fixe aussi le prix par adossement.
Preuve de réserve : le chiffre provient de ce qui se trouve derrière le token, pas d’un mince relevé d’un DEX.
Ils l’ont déjà fait pour tGBP — un prix basé sur les réserves, pas sur les transactions.
Les stablecoins RWA et les vaults en ont besoin. Le prix spot est le mauvais outil.
Restez optimistes
$DIA
C’est inutile si l’actif ne s’échange presque pas.
@DIAdata_org fixe aussi le prix par adossement.
Preuve de réserve : le chiffre provient de ce qui se trouve derrière le token, pas d’un mince relevé d’un DEX.
Ils l’ont déjà fait pour tGBP — un prix basé sur les réserves, pas sur les transactions.
Les stablecoins RWA et les vaults en ont besoin. Le prix spot est le mauvais outil.
Restez optimistes
$DIA
60
·
--
Voir la traduction
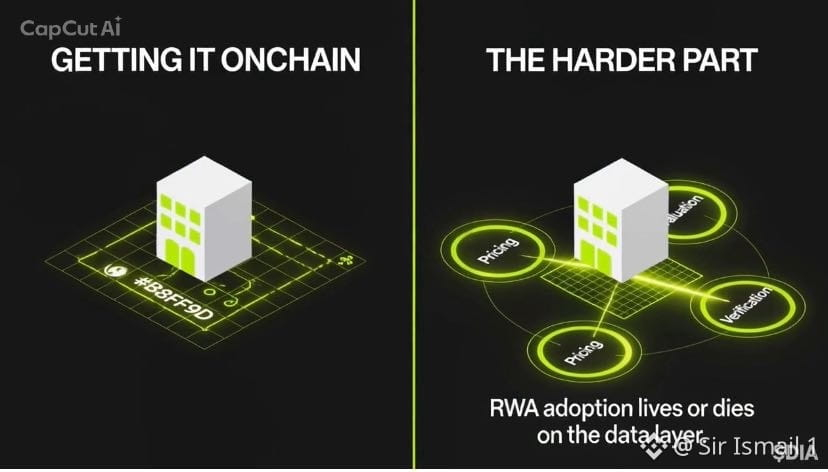
The RWA opportunity is becoming a data opportunity.
Tokenizing an asset is only the first step.
Once it’s onchain, you still need:
→ Reliable pricing
→ Valuation data
→ Collateral data
→ Verification
That’s wher$DIA gets interesting.
Real World Assets tokenization needs reliable data infrastructure.
More RWAs onchain → more data requirements → bigger opportunity for the oracle layer.
$DIA
The RWA opportunity is becoming a data opportunity.
Tokenizing an asset is only the first step.
Once it’s onchain, you still need:
→ Reliable pricing
→ Valuation data
→ Collateral data
→ Verification
That’s wher$DIA gets interesting.
Real World Assets tokenization needs reliable data infrastructure.
More RWAs onchain → more data requirements → bigger opportunity for the oracle layer.
$DIA
Tokenizing an asset is only the first step.
Once it’s onchain, you still need:
→ Reliable pricing
→ Valuation data
→ Collateral data
→ Verification
That’s wher$DIA gets interesting.
Real World Assets tokenization needs reliable data infrastructure.
More RWAs onchain → more data requirements → bigger opportunity for the oracle layer.
$DIA
47
·
--
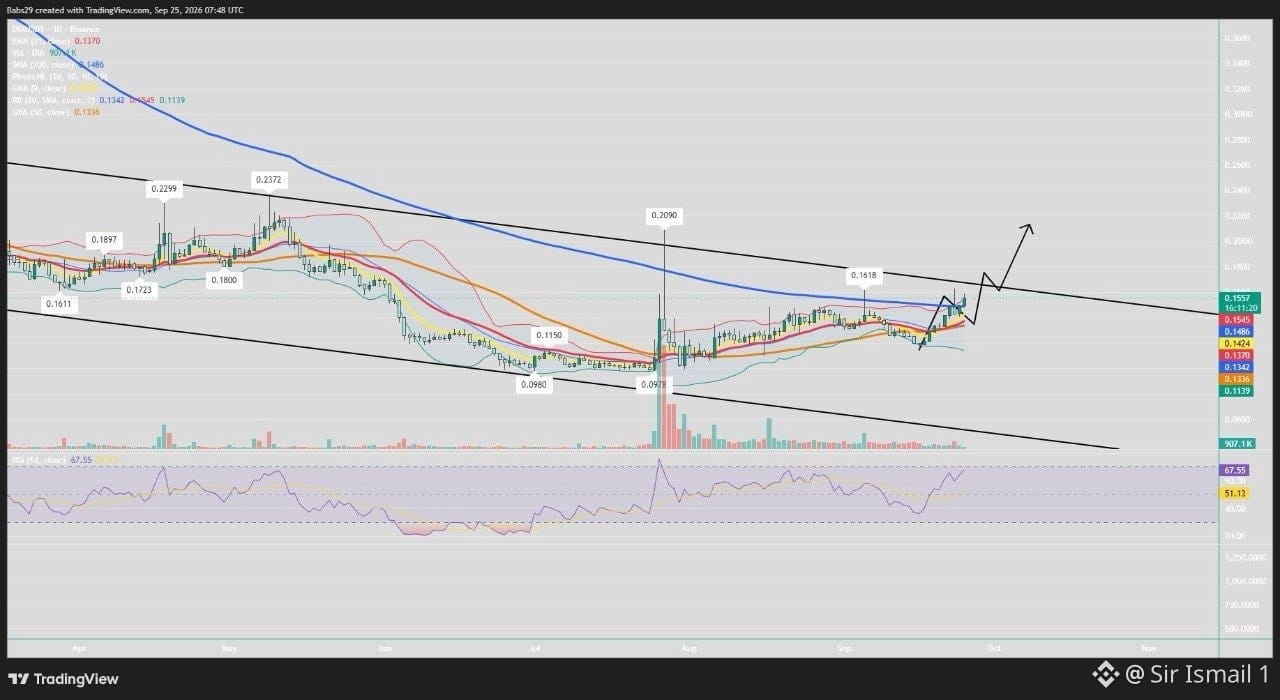
$DIA Daily TA
DIA pousse dans la zone de résistance $0.156–$0.160.
Une cassure propre pourrait ouvrir $0.18 → $0.20+.
Qu’est-ce qui rend la configuration intéressante ? DIA n’est pas seulement un graphique. Son infrastructure vérifiable d’oracle est conçue spécifiquement pour la DeFi et les Actifs du Monde Réel, avec des flux pour les actions, les matières premières, les FX et les actifs tokenisés.
TA + utilité RWA en croissance = configuration intéressante. 👀
$0.149 reste un support clé.
$DIA Daily TA
DIA pousse dans la zone de résistance $0.156–$0.160.
Une cassure propre pourrait ouvrir $0.18 → $0.20+.
Qu’est-ce qui rend la configuration intéressante ? DIA n’est pas seulement un graphique. Son infrastructure vérifiable d’oracle est conçue spécifiquement pour la DeFi et les Actifs du Monde Réel, avec des flux pour les actions, les matières premières, les FX et les actifs tokenisés.
TA + utilité RWA en croissance = configuration intéressante. 👀
$0.149 reste un support clé.
DIA pousse dans la zone de résistance $0.156–$0.160.
Une cassure propre pourrait ouvrir $0.18 → $0.20+.
Qu’est-ce qui rend la configuration intéressante ? DIA n’est pas seulement un graphique. Son infrastructure vérifiable d’oracle est conçue spécifiquement pour la DeFi et les Actifs du Monde Réel, avec des flux pour les actions, les matières premières, les FX et les actifs tokenisés.
TA + utilité RWA en croissance = configuration intéressante. 👀
$0.149 reste un support clé.
57
·
--
Jusqu’à présent, je suis haussier sur ces deux pépites ; $BTC amd $DIA
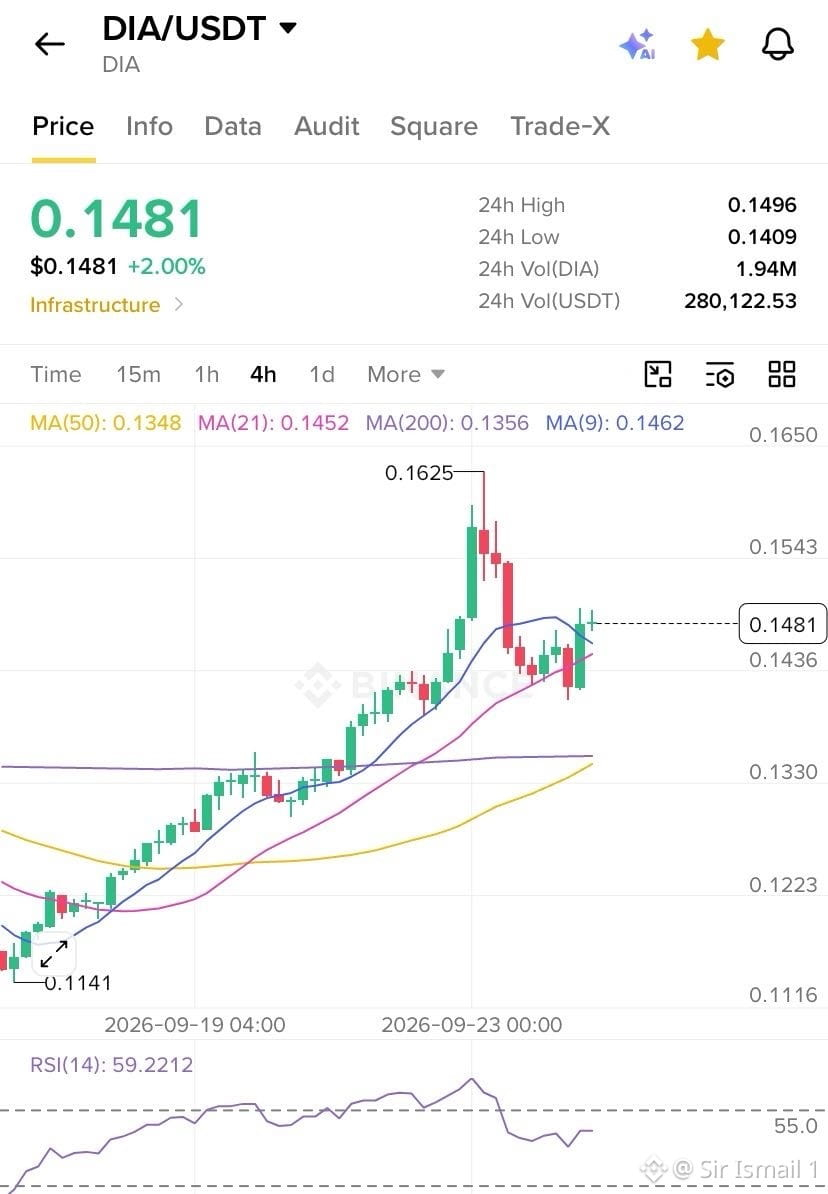
Voici ta mise à jour 4H de $DIA
DIA se maintient à $0.148 après avoir rebondi depuis la zone de $0.143.
• Support : $0.143 → $0.135
• Résistance : $0.154 → $0.1625
• RSI : ~59, dynamique haussière qui revient
Une cassure nette au-dessus de $0.1625 pourrait ouvrir la voie vers $0.18+.
La structure reste favorable aux haussiers.
Jusqu’à présent, je suis haussier sur ces deux pépites ; $BTC amd $DIA
Voici ta mise à jour 4H de $DIA
DIA se maintient à $0.148 après avoir rebondi depuis la zone de $0.143.
• Support : $0.143 → $0.135
• Résistance : $0.154 → $0.1625
• RSI : ~59, dynamique haussière qui revient
Une cassure nette au-dessus de $0.1625 pourrait ouvrir la voie vers $0.18+.
La structure reste favorable aux haussiers.
Voici ta mise à jour 4H de $DIA
DIA se maintient à $0.148 après avoir rebondi depuis la zone de $0.143.
• Support : $0.143 → $0.135
• Résistance : $0.154 → $0.1625
• RSI : ~59, dynamique haussière qui revient
Une cassure nette au-dessus de $0.1625 pourrait ouvrir la voie vers $0.18+.
La structure reste favorable aux haussiers.
69
·
--
Bonjour à tous, la famille $DIA
Un rappel : DIA est tranquillement à la bonne place.
Les oracles vivent sur @Arc après avoir imprimé 340 M$ de TVL en une semaine.
NAV passe on-chain avec pennyworks_.
Des flux sont installés sous les coffres, les RWA et le lending, pas seulement BTC/USD.
Le trade n’est pas « la saison des oracles ».
C’est plutôt plus d’actifs on-chain qui ont besoin d’un chiffre que vous pouvez vérifier.
Voilà DIA.
Bonjour à tous, la famille $DIA
Un rappel : DIA est tranquillement à la bonne place.
Les oracles vivent sur @Arc après avoir imprimé 340 M$ de TVL en une semaine.
NAV passe on-chain avec pennyworks_.
Des flux sont installés sous les coffres, les RWA et le lending, pas seulement BTC/USD.
Le trade n’est pas « la saison des oracles ».
C’est plutôt plus d’actifs on-chain qui ont besoin d’un chiffre que vous pouvez vérifier.
Voilà DIA.
Un rappel : DIA est tranquillement à la bonne place.
Les oracles vivent sur @Arc après avoir imprimé 340 M$ de TVL en une semaine.
NAV passe on-chain avec pennyworks_.
Des flux sont installés sous les coffres, les RWA et le lending, pas seulement BTC/USD.
Le trade n’est pas « la saison des oracles ».
C’est plutôt plus d’actifs on-chain qui ont besoin d’un chiffre que vous pouvez vérifier.
Voilà DIA.
64
·
--
Voir la traduction
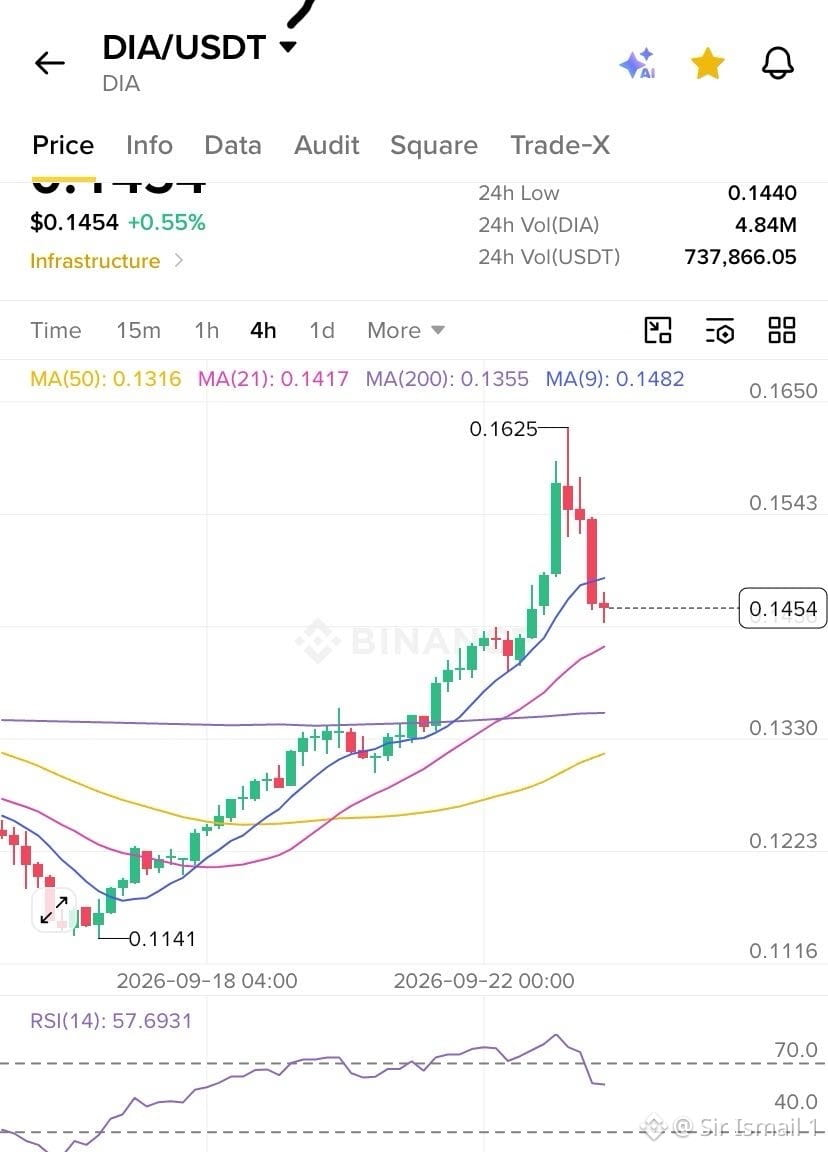
$DIA Update 4hr
DIA just ran from $0.1141 → $0.1625 and is now cooling off.
The key point is that the trend is still up.
This looks like healthy digestion after a strong impulse, not a confirmed reversal.
Support: $0.1440–$0.1417 → $0.1355
Resistance: $0.1482 → $0.154 → $0.1625
Hold $0.1417–$0.144 + reclaim $0.148–$0.154 → $0.1625 retest comes back into play.
Lose $0.1417 → $0.1355, then potentially $0.132.
$0.1417 is the line. Hold it and the higher-low structure remains intact.
$DIA Update 4hr
DIA just ran from $0.1141 → $0.1625 and is now cooling off.
The key point is that the trend is still up.
This looks like healthy digestion after a strong impulse, not a confirmed reversal.
Support: $0.1440–$0.1417 → $0.1355
Resistance: $0.1482 → $0.154 → $0.1625
Hold $0.1417–$0.144 + reclaim $0.148–$0.154 → $0.1625 retest comes back into play.
Lose $0.1417 → $0.1355, then potentially $0.132.
$0.1417 is the line. Hold it and the higher-low structure remains intact.
DIA just ran from $0.1141 → $0.1625 and is now cooling off.
The key point is that the trend is still up.
This looks like healthy digestion after a strong impulse, not a confirmed reversal.
Support: $0.1440–$0.1417 → $0.1355
Resistance: $0.1482 → $0.154 → $0.1625
Hold $0.1417–$0.144 + reclaim $0.148–$0.154 → $0.1625 retest comes back into play.
Lose $0.1417 → $0.1355, then potentially $0.132.
$0.1417 is the line. Hold it and the higher-low structure remains intact.
64
·
--
Bonjour à la famille $DIA
Pourquoi je regarde DIA !
DIA construit bien plus que de simples flux de prix.
Son modèle combine l’infrastructure d’oracle, les données RWA, les Fundamental Feeds et des données vérifiables sur 20 000+ actifs et 65+ blockchains.
Plus d’actifs on-chain → plus de demande pour des données fiables.
C’est le modèle économique que je surveille.
| RWA | DeFi | Infrastructure d’oracle
Bonjour à la famille $DIA
Pourquoi je regarde DIA !
DIA construit bien plus que de simples flux de prix.
Son modèle combine l’infrastructure d’oracle, les données RWA, les Fundamental Feeds et des données vérifiables sur 20 000+ actifs et 65+ blockchains.
Plus d’actifs on-chain → plus de demande pour des données fiables.
C’est le modèle économique que je surveille.
| RWA | DeFi | Infrastructure d’oracle
Pourquoi je regarde DIA !
DIA construit bien plus que de simples flux de prix.
Son modèle combine l’infrastructure d’oracle, les données RWA, les Fundamental Feeds et des données vérifiables sur 20 000+ actifs et 65+ blockchains.
Plus d’actifs on-chain → plus de demande pour des données fiables.
C’est le modèle économique que je surveille.
| RWA | DeFi | Infrastructure d’oracle
51
·
--
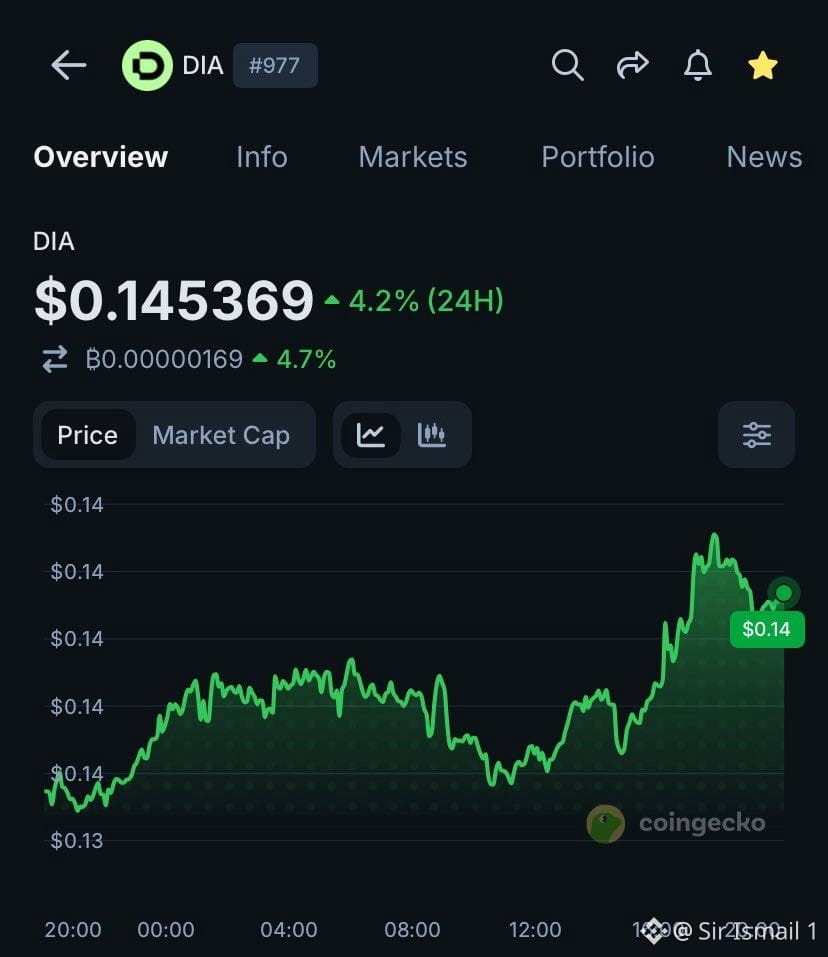
$DIA a l’air intéressant ici.
Le prix fait partie de l’histoire.
La thèse plus large, c’est l’infrastructure :
Données RWA + Flux fondamentaux + oracles vérifiables + Lasernet.
Si l’adoption continue de s’étendre, je pense que le marché peut commencer à valoriser DIA très différemment.
Je continue de surveiller. Je reste haussier.
$DIA a l’air intéressant ici.
Le prix fait partie de l’histoire.
La thèse plus large, c’est l’infrastructure :
Données RWA + Flux fondamentaux + oracles vérifiables + Lasernet.
Si l’adoption continue de s’étendre, je pense que le marché peut commencer à valoriser DIA très différemment.
Je continue de surveiller. Je reste haussier.
Le prix fait partie de l’histoire.
La thèse plus large, c’est l’infrastructure :
Données RWA + Flux fondamentaux + oracles vérifiables + Lasernet.
Si l’adoption continue de s’étendre, je pense que le marché peut commencer à valoriser DIA très différemment.
Je continue de surveiller. Je reste haussier.
53
·
--
Restez bullish sur $DIA les gars !
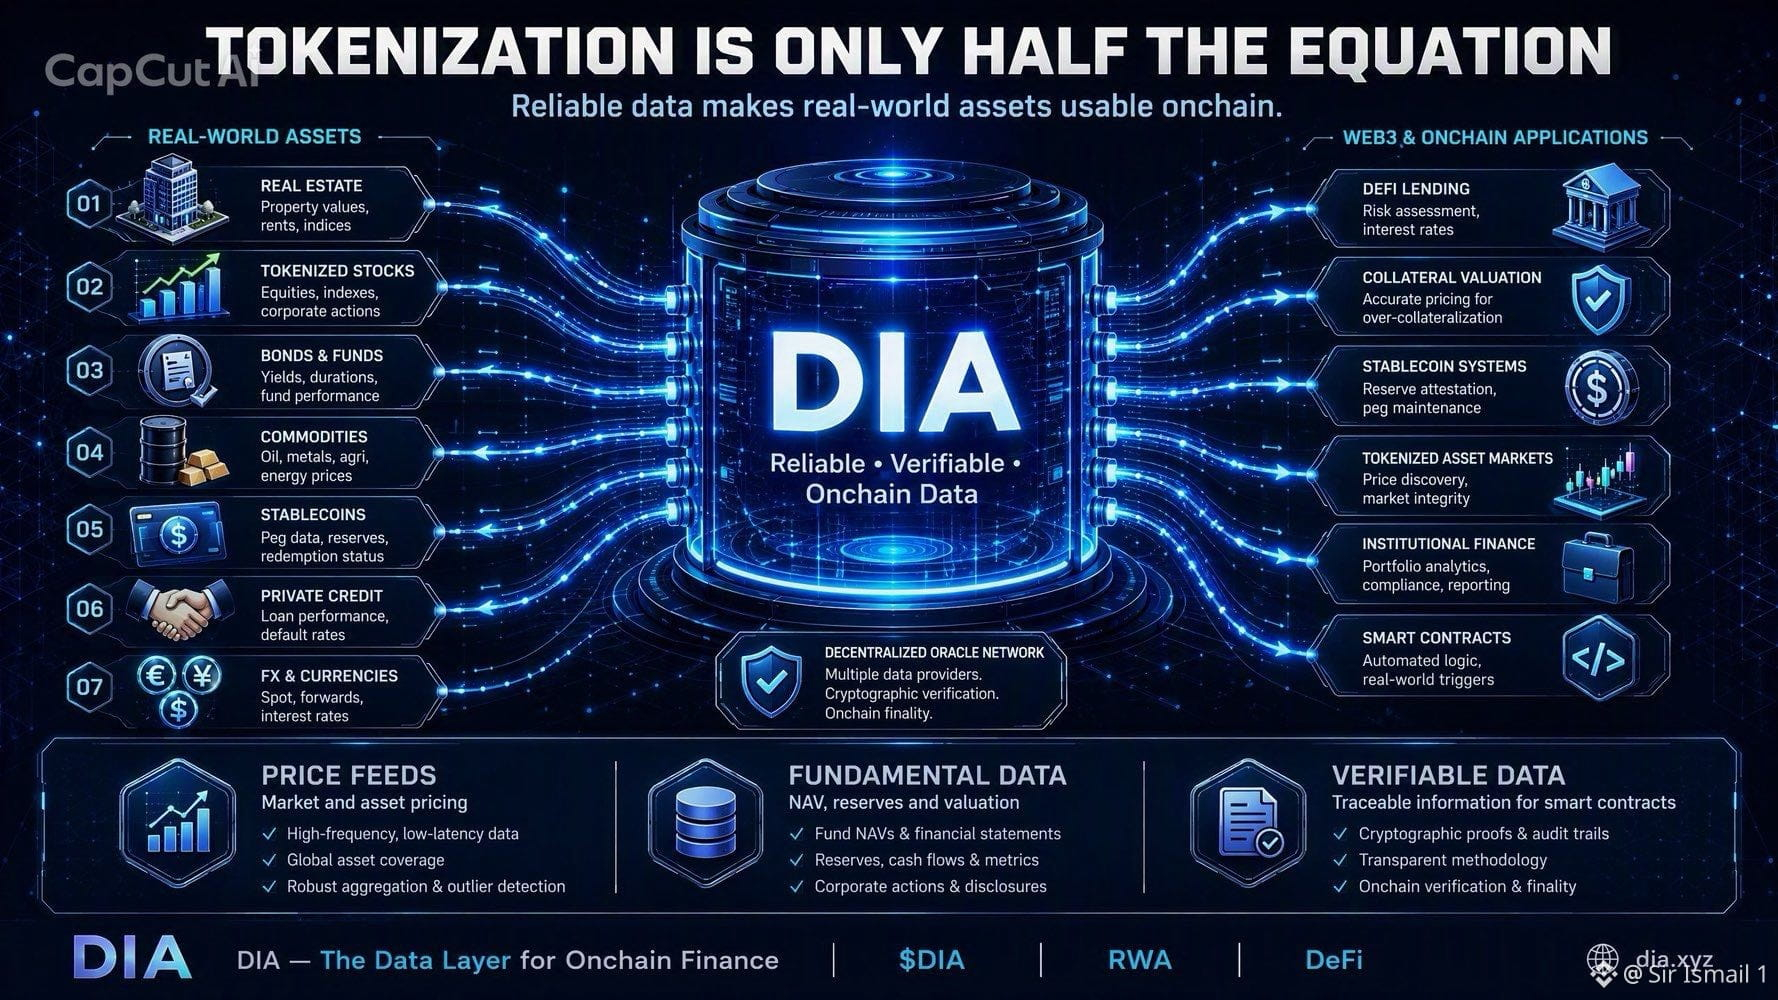
La tokenisation des RWA n’est qu’un début.
Mettre un actif du monde réel onchain ne signifie pas automatiquement qu’un smart contract sait combien il vaut.
Il vous faut encore des données fiables pour :
→ La tarification
→ L’évaluation
→ La garantie
→ Les réserves
→ Le risque
C’est pourquoi la couche oracle est essentielle.
DIA fournit des flux de prix RWA et des données fondamentales pour des actifs, y compris des actions, des matières premières et d’autres actifs du monde réel, avec des flux de données transparents et vérifiables.
La tokenisation met les RWA onchain.
Des données fiables les rendent utilisables.
C’est la partie de la thèse RWA que je surveille.
Restez bullish sur $DIA les gars !
La tokenisation des RWA n’est qu’un début.
Mettre un actif du monde réel onchain ne signifie pas automatiquement qu’un smart contract sait combien il vaut.
Il vous faut encore des données fiables pour :
→ La tarification
→ L’évaluation
→ La garantie
→ Les réserves
→ Le risque
C’est pourquoi la couche oracle est essentielle.
DIA fournit des flux de prix RWA et des données fondamentales pour des actifs, y compris des actions, des matières premières et d’autres actifs du monde réel, avec des flux de données transparents et vérifiables.
La tokenisation met les RWA onchain.
Des données fiables les rendent utilisables.
C’est la partie de la thèse RWA que je surveille.
La tokenisation des RWA n’est qu’un début.
Mettre un actif du monde réel onchain ne signifie pas automatiquement qu’un smart contract sait combien il vaut.
Il vous faut encore des données fiables pour :
→ La tarification
→ L’évaluation
→ La garantie
→ Les réserves
→ Le risque
C’est pourquoi la couche oracle est essentielle.
DIA fournit des flux de prix RWA et des données fondamentales pour des actifs, y compris des actions, des matières premières et d’autres actifs du monde réel, avec des flux de données transparents et vérifiables.
La tokenisation met les RWA onchain.
Des données fiables les rendent utilisables.
C’est la partie de la thèse RWA que je surveille.
54
·
--
$DIA DAILY UPDATE
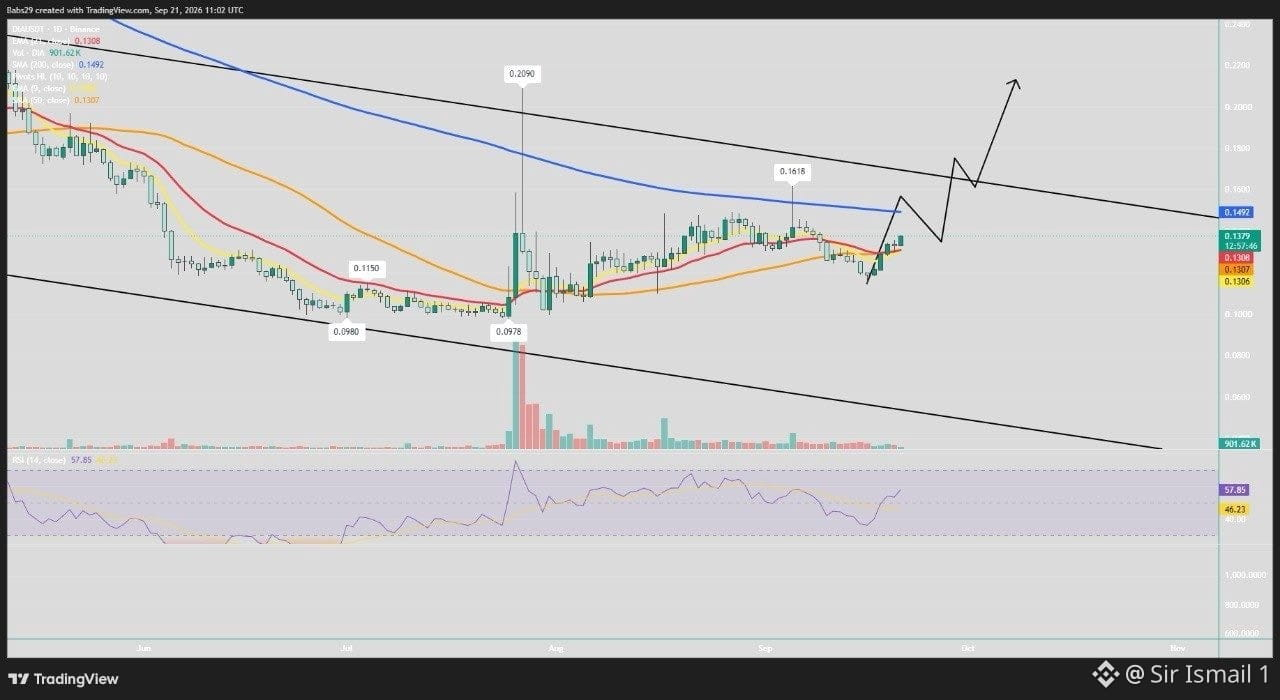
$DIA affiche une reprise haussière depuis la zone de $0.098.
* Actuel : ~0,138
* Support : 0,130–0,131
* Résistance : 0,149 → 0,162
* RSI : ~58, dynamique en amélioration
Le maintien au-dessus de $0.130 garde le scénario haussier actif. Une cassure au-dessus de $0.149 pourrait ouvrir la voie vers $0.162 → 0,18+.
Perdre $0.130 affaiblirait le scénario et pourrait provoquer un nouvel ajustement à la baisse.
Les acheteurs reprennent de l’élan.
$DIA DAILY UPDATE
$DIA affiche une reprise haussière depuis la zone de $0.098.
* Actuel : ~0,138
* Support : 0,130–0,131
* Résistance : 0,149 → 0,162
* RSI : ~58, dynamique en amélioration
Le maintien au-dessus de $0.130 garde le scénario haussier actif. Une cassure au-dessus de $0.149 pourrait ouvrir la voie vers $0.162 → 0,18+.
Perdre $0.130 affaiblirait le scénario et pourrait provoquer un nouvel ajustement à la baisse.
Les acheteurs reprennent de l’élan.
$DIA affiche une reprise haussière depuis la zone de $0.098.
* Actuel : ~0,138
* Support : 0,130–0,131
* Résistance : 0,149 → 0,162
* RSI : ~58, dynamique en amélioration
Le maintien au-dessus de $0.130 garde le scénario haussier actif. Une cassure au-dessus de $0.149 pourrait ouvrir la voie vers $0.162 → 0,18+.
Perdre $0.130 affaiblirait le scénario et pourrait provoquer un nouvel ajustement à la baisse.
Les acheteurs reprennent de l’élan.
76
·
--
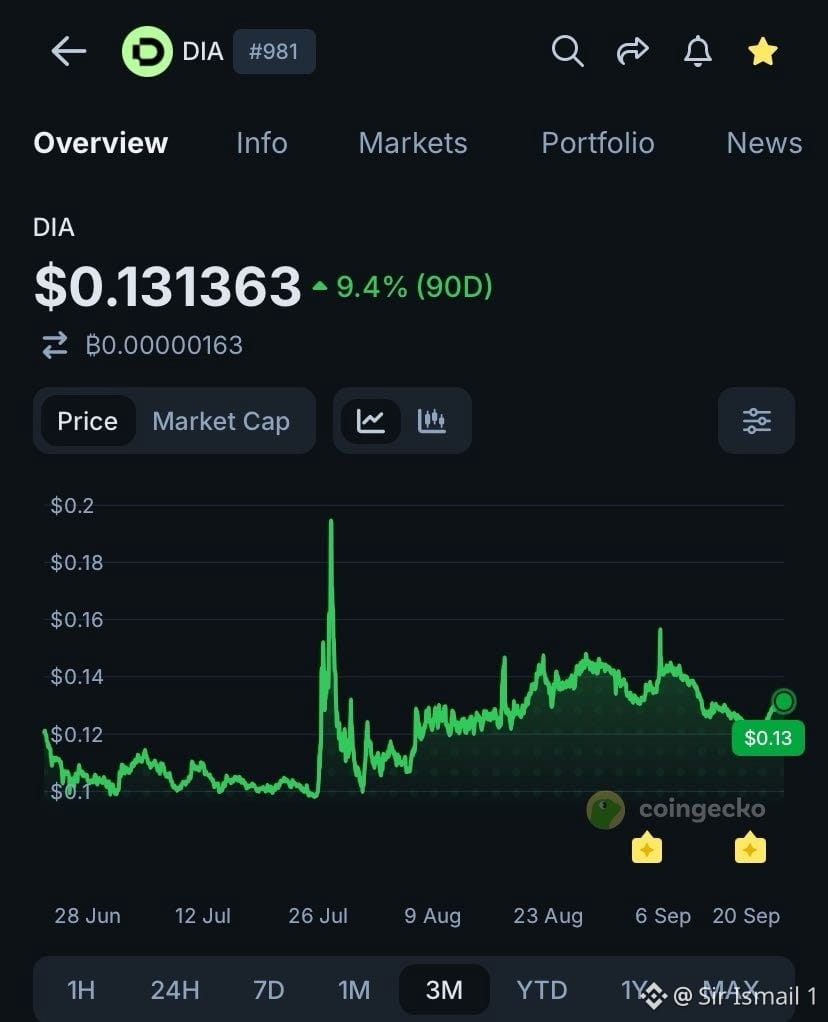
$DIA recommence à s’éveiller, les gars
En tournant autour de $0,13 et en poussant déjà plus haut aujourd’hui.
Ce qui m’intéresse, ce n’est pas seulement le graphique.
DIA construit une infrastructure autour de :
→ Données RWA
→ Valorisation fondamentale
→ Flux vérifiables
→ DeFi
→ Actifs tokenisés
Si l’élan se poursuit et que DIA parvient à reconquérir la zone de $0,14–$0,15, je surveillerai de près la prochaine expansion.
Le graphique bouge et l’infrastructure grandit.
Positionnez-vous en conséquence !
$DIA recommence à s’éveiller, les gars
En tournant autour de $0,13 et en poussant déjà plus haut aujourd’hui.
Ce qui m’intéresse, ce n’est pas seulement le graphique.
DIA construit une infrastructure autour de :
→ Données RWA
→ Valorisation fondamentale
→ Flux vérifiables
→ DeFi
→ Actifs tokenisés
Si l’élan se poursuit et que DIA parvient à reconquérir la zone de $0,14–$0,15, je surveillerai de près la prochaine expansion.
Le graphique bouge et l’infrastructure grandit.
Positionnez-vous en conséquence !
En tournant autour de $0,13 et en poussant déjà plus haut aujourd’hui.
Ce qui m’intéresse, ce n’est pas seulement le graphique.
DIA construit une infrastructure autour de :
→ Données RWA
→ Valorisation fondamentale
→ Flux vérifiables
→ DeFi
→ Actifs tokenisés
Si l’élan se poursuit et que DIA parvient à reconquérir la zone de $0,14–$0,15, je surveillerai de près la prochaine expansion.
Le graphique bouge et l’infrastructure grandit.
Positionnez-vous en conséquence !
59
·
--
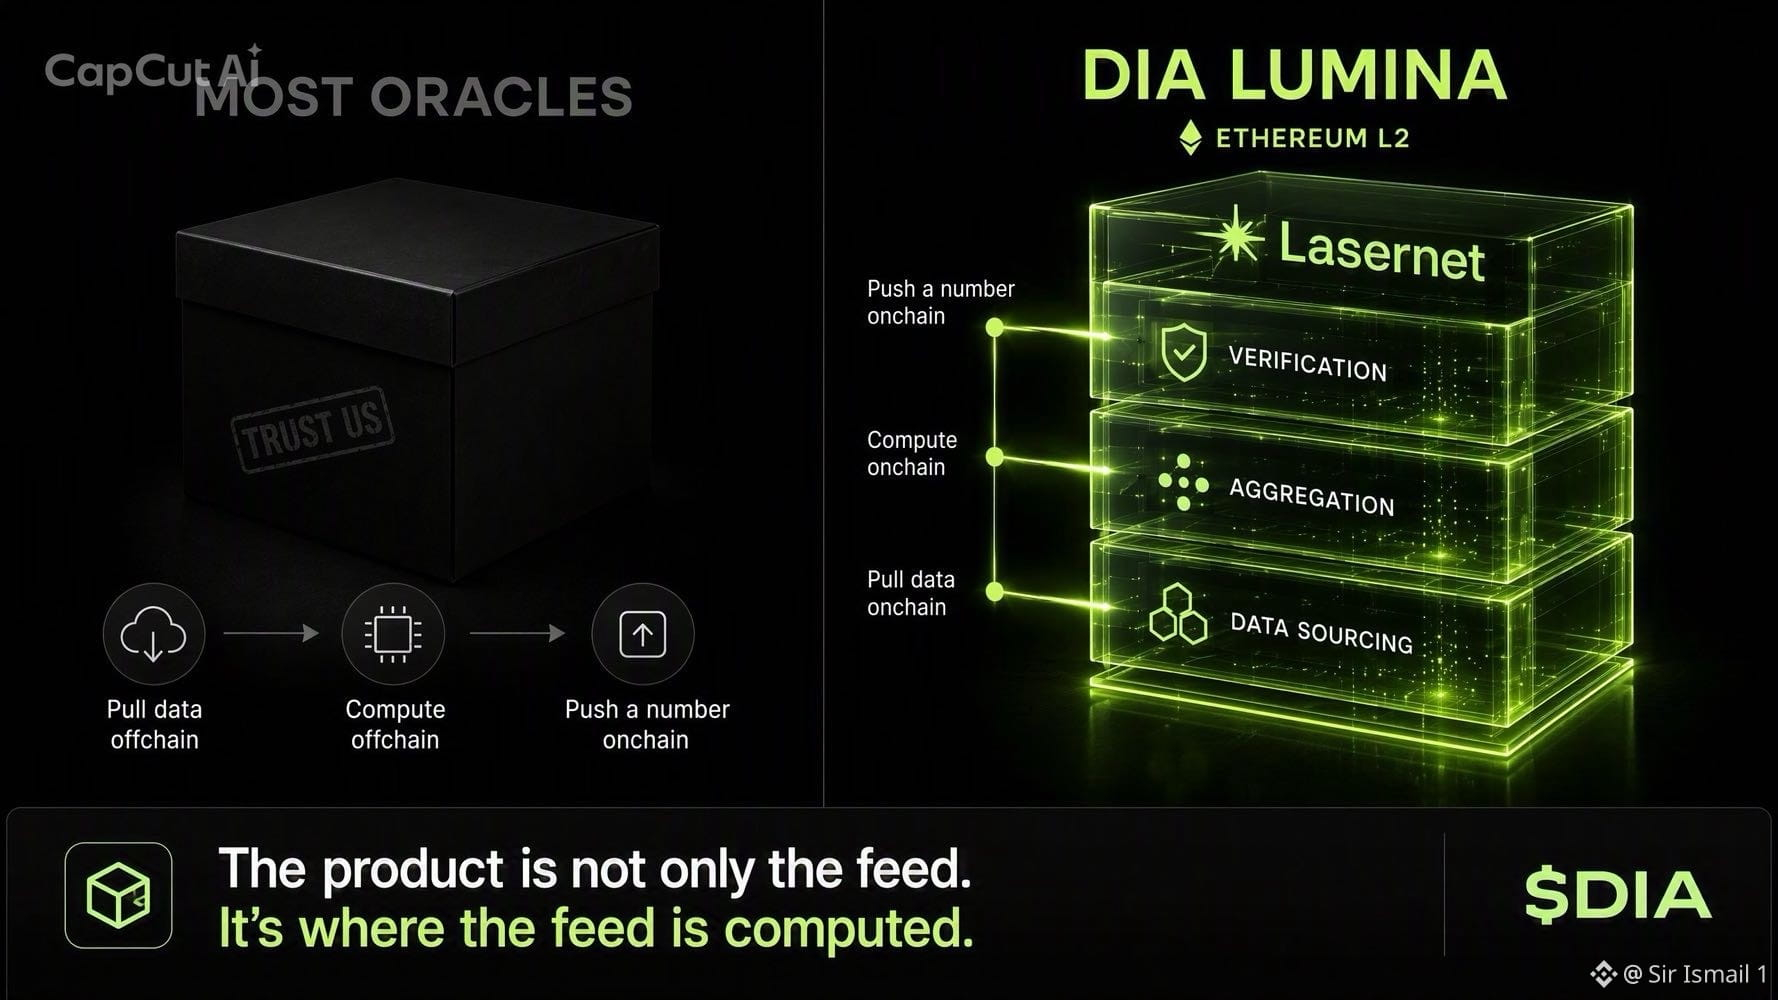
$Récapitulatif de la semaine DIA sur la pile, pas sur le ticker.
4 choses à l’intérieur de DIA qui ne sont pas « l’alimentation de prix BTC » :
1. Lumina — la stack oracle
2. Lasernet — le L2 où les données sont réellement calculées
3. Feeders — des nœuds indépendants fournissant des transactions de première partie
4. $DIA — le gas sur ce L2 + la sécurité pour le réseau
C’est la machine.
Le signal en direct de cette semaine au-dessus : DIA + pennyworks publie un audit NAV onchain prêt pour les audits pour des fonds DeFi et des curateurs.
Les flux sont le résultat.
Le NAV vérifié est la nouvelle demande.
RESTEZ OPTIMISTES !
$Récapitulatif de la semaine DIA sur la pile, pas sur le ticker.
4 choses à l’intérieur de DIA qui ne sont pas « l’alimentation de prix BTC » :
1. Lumina — la stack oracle
2. Lasernet — le L2 où les données sont réellement calculées
3. Feeders — des nœuds indépendants fournissant des transactions de première partie
4. $DIA — le gas sur ce L2 + la sécurité pour le réseau
C’est la machine.
Le signal en direct de cette semaine au-dessus : DIA + pennyworks publie un audit NAV onchain prêt pour les audits pour des fonds DeFi et des curateurs.
Les flux sont le résultat.
Le NAV vérifié est la nouvelle demande.
RESTEZ OPTIMISTES !
4 choses à l’intérieur de DIA qui ne sont pas « l’alimentation de prix BTC » :
1. Lumina — la stack oracle
2. Lasernet — le L2 où les données sont réellement calculées
3. Feeders — des nœuds indépendants fournissant des transactions de première partie
4. $DIA — le gas sur ce L2 + la sécurité pour le réseau
C’est la machine.
Le signal en direct de cette semaine au-dessus : DIA + pennyworks publie un audit NAV onchain prêt pour les audits pour des fonds DeFi et des curateurs.
Les flux sont le résultat.
Le NAV vérifié est la nouvelle demande.
RESTEZ OPTIMISTES !
62
·
--
Sous-évalué ? ✔️
Élan ? ✔️
Innovations ? ✔️
$DIA est le joyau oracle le plus prometteur en ce moment.
La valeur DIA et DIA ZK sont le changeur de jeu, tandis que Lumina/Lasernet est le moteur.
Cette semaine, ils publient le NAV on-chain avec Pennyworks
Restez haussiers, selon moi
On va beaucoup plus haut dans les prochaines semaines
Ce n’est pas un conseil financier !
Bon week-end
Sous-évalué ? ✔️
Élan ? ✔️
Innovations ? ✔️
$DIA est le joyau oracle le plus prometteur en ce moment.
La valeur DIA et DIA ZK sont le changeur de jeu, tandis que Lumina/Lasernet est le moteur.
Cette semaine, ils publient le NAV on-chain avec Pennyworks
Restez haussiers, selon moi
On va beaucoup plus haut dans les prochaines semaines
Ce n’est pas un conseil financier !
Bon week-end
Élan ? ✔️
Innovations ? ✔️
$DIA est le joyau oracle le plus prometteur en ce moment.
La valeur DIA et DIA ZK sont le changeur de jeu, tandis que Lumina/Lasernet est le moteur.
Cette semaine, ils publient le NAV on-chain avec Pennyworks
Restez haussiers, selon moi
On va beaucoup plus haut dans les prochaines semaines
Ce n’est pas un conseil financier !
Bon week-end
56
·
--
$MISE À JOUR du JOUR 4h
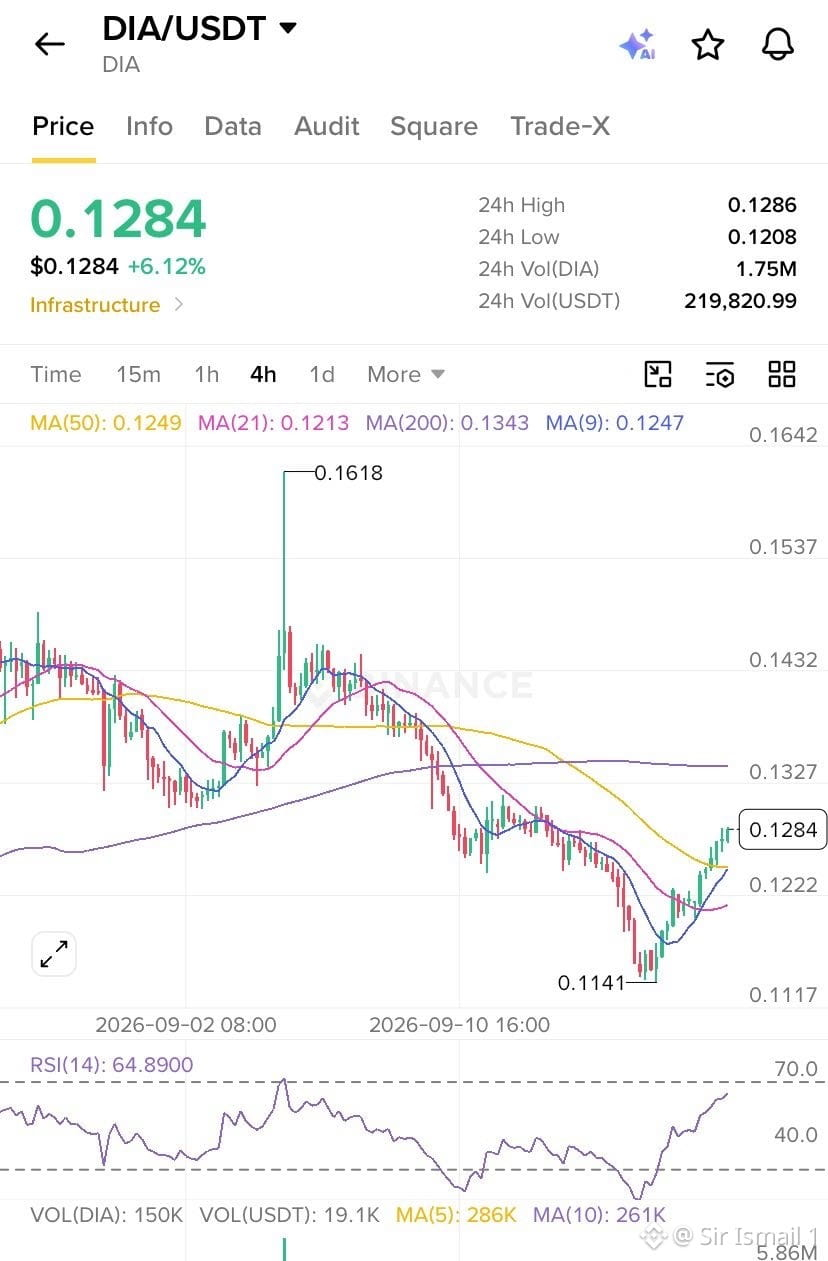
Je vais faire simple.
À 0,1166 $ et rebond à ~0,128.
C’est un plus bas plus élevé après la purge.
Ensuite : reprendre 0,129–0,133 → remettre 0,138 dans le jeu.
0,1166 $ reste la invalidation.
Quelle est ton biais ? 👀
$MISE À JOUR du JOUR 4h
Je vais faire simple.
À 0,1166 $ et rebond à ~0,128.
C’est un plus bas plus élevé après la purge.
Ensuite : reprendre 0,129–0,133 → remettre 0,138 dans le jeu.
0,1166 $ reste la invalidation.
Quelle est ton biais ? 👀
Je vais faire simple.
À 0,1166 $ et rebond à ~0,128.
C’est un plus bas plus élevé après la purge.
Ensuite : reprendre 0,129–0,133 → remettre 0,138 dans le jeu.
0,1166 $ reste la invalidation.
Quelle est ton biais ? 👀
1
134
Connectez-vous pour découvrir plus de contenu
Rejoignez la communauté mondiale des adeptes de cryptomonnaies sur Binance Square
⚡️ Suviez les dernières informations importantes sur les cryptomonnaies.
💬 Jugé digne de confiance par la plus grande plateforme d’échange de cryptomonnaies au monde.
👍 Découvrez les connaissances que partagent les créateurs vérifiés.
Adresse e-mail/Nº de téléphone
Sujets d’actualité
MetaMaskExitsLidoValidatorsAfterSecurityIncident
3,172 vues
150 mentions
🚨 METAMASK COMMENCE À QUITTER DES VALIDATEURS ETH APRÈS UN INCIDENT DE SÉCURITÉ.
MetaMask indique qu’un incident de sécurité en cours a touché une partie de son infrastructure, l’obligeant à quitter de manière proactive les validateurs concernés dans ses opérations de staking non custodial. L’entreprise affirme n’avoir constaté, pour l’instant, aucune menace immédiate pour les portefeuilles MetaMask.
Le détail clé ?
Ces validateurs sont liés au staking via Lido, et le processus de sortie peut temporairement retirer de l’ETH du staking pendant que l’enquête se poursuit. Des rapports liés à Lido indiquent que le cycle complet de sortie, de retrait et de réentrée pourrait durer jusqu’à environ 45 jours.
Cela signifie que le marché doit distinguer deux choses :
Les utilisateurs de portefeuilles ne sont pas actuellement informés d’un risque immédiat.
Mais l’infrastructure des validateurs, elle, était manifestement suffisamment sérieuse pour déclencher une sortie d’urgence.
Et lorsqu’une des plus grandes marques de portefeuilles d’Ethereum commence à retirer des validateurs par précaution, les traders font attention.
Les incidents de sécurité n’ont pas besoin de fonds volés pour devenir des catalyseurs pour le marché.
Parfois, la réaction elle-même est un signal. 👀
$ETH $LDO
#metamaskexitslidovalidatorsaftersecurityincident
KimHotbae
·0 mentions J’aime
·1.1k vues
MicronBeatsEarningsLiftsGuidance
5,939 vues
159 mentions
CFTCSubmitsTwoEventContractRulesToWhiteHouse
5,849 vues
172 mentions