

Md Asmot Ali1
4.1k Publications

Md Asmot Ali1
Signaler
Bloquer l’utilisateur
📊 Your Daily Crypto Guide. Decoding the market every single day. Stay ahead with the latest news, trends, and updates. Don't miss out—Hit the follow button! 💎
Ouvert au trading
Trade occasionnellement
3.6 an(s)
8 Suivis
323 Abonnés
2.6K+ J’aime
Publications
Portefeuille
Tous
Vidéos
PINNED
🚨 BREAKING: CRASH HISTORIQUE SUR LES MARCHÉS MONDIAUX ! INVESTISSEURS, GARDEZ VOTRE PRUDENCE ! 🚨
Dans un tournant choquant des événements, 5,9 BILLIONS de dollars ont disparu des marchés de l'or et de l'argent en seulement 30 minutes ! C'est l'une des plus grandes effacements de richesse de l'histoire financière. Si vous êtes un investisseur, lisez ceci MAINTENANT ! ⚠️
#MarketCrash #GoldPrice
#FinanceNews #TradingAlert
🚨 BREAKING: CRASH HISTORIQUE SUR LES MARCHÉS MONDIAUX ! INVESTISSEURS, GARDEZ VOTRE PRUDENCE ! 🚨
Dans un tournant choquant des événements, 5,9 BILLIONS de dollars ont disparu des marchés de l'or et de l'argent en seulement 30 minutes ! C'est l'une des plus grandes effacements de richesse de l'histoire financière. Si vous êtes un investisseur, lisez ceci MAINTENANT ! ⚠️
#MarketCrash #GoldPrice
#FinanceNews #TradingAlert
Dans un tournant choquant des événements, 5,9 BILLIONS de dollars ont disparu des marchés de l'or et de l'argent en seulement 30 minutes ! C'est l'une des plus grandes effacements de richesse de l'histoire financière. Si vous êtes un investisseur, lisez ceci MAINTENANT ! ⚠️
#MarketCrash #GoldPrice
#FinanceNews #TradingAlert
4
3
43
42.6k
Article
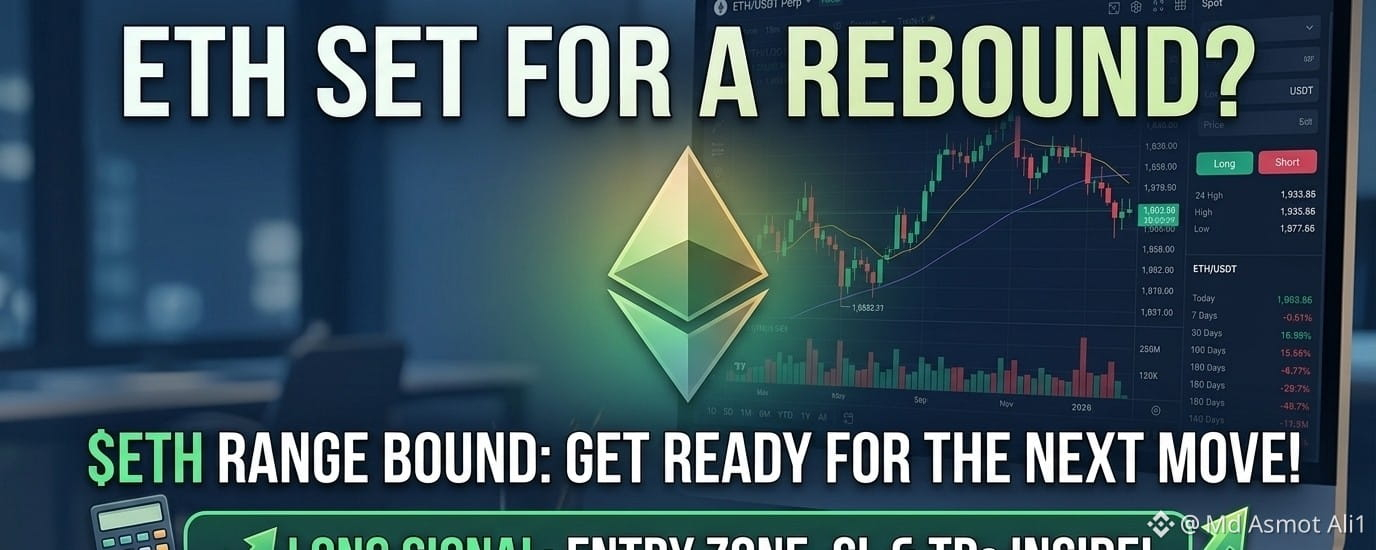
$ETH – Zone limitée & en consolidation, en visant un rebond au-dessus du support
Plan de trading Long $ETH
Entrée : 1,$ETH – Zone limitée & en consolidation, en visant un rebond au-dessus du support
Plan de trading Long $ETH
Entrée : 1 890 – 1 905
SL : 1 840
TP 1 : 1 935
TP 2 : 1 980
TP 3 : 2 050
Le prix se consolide actuellement près du niveau 1 900 sur le graphique en 4H, restant bien au-dessus de la forte zone de support proche de 1 846. Les moyennes mobiles se resserrent, signalant une expansion imminente. Avec la pression vendeuse qui diminue et un support local qui demeure intact, la structure favorise une poursuite haussière vers des objectifs plus élevés à mesure que l’élan se renforce.
$ETH – Zone limitée & en consolidation, en visant un rebond au-dessus du support Plan de trading Long $ETH Entrée : 1,
$ETH – Zone limitée & en consolidation, en visant un rebond au-dessus du support
Plan de trading Long $ETH
Entrée : 1 890 – 1 905
SL : 1 840
TP 1 : 1 935
TP 2 : 1 980
TP 3 : 2 050
Le prix se consolide actuellement près du niveau 1 900 sur le graphique en 4H, restant bien au-dessus de la forte zone de support proche de 1 846. Les moyennes mobiles se resserrent, signalant une expansion imminente. Avec la pression vendeuse qui diminue et un support local qui demeure intact, la structure favorise une poursuite haussière vers des objectifs plus élevés à mesure que l’élan se renforce.
Plan de trading Long $ETH
Entrée : 1 890 – 1 905
SL : 1 840
TP 1 : 1 935
TP 2 : 1 980
TP 3 : 2 050
Le prix se consolide actuellement près du niveau 1 900 sur le graphique en 4H, restant bien au-dessus de la forte zone de support proche de 1 846. Les moyennes mobiles se resserrent, signalant une expansion imminente. Avec la pression vendeuse qui diminue et un support local qui demeure intact, la structure favorise une poursuite haussière vers des objectifs plus élevés à mesure que l’élan se renforce.
18
Article
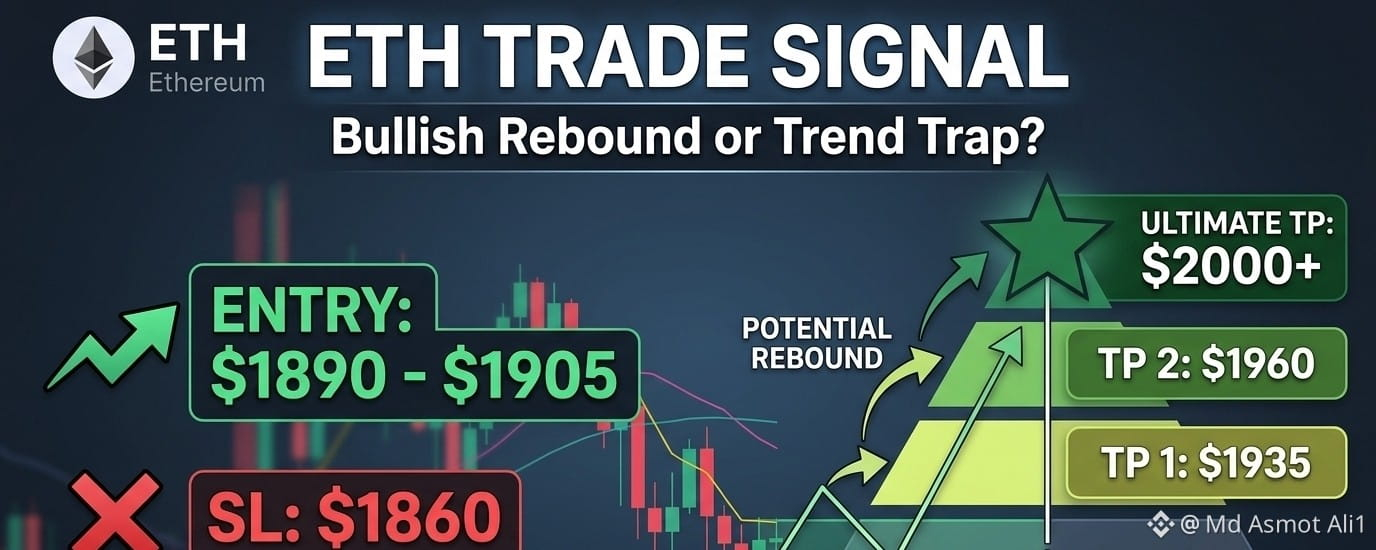
$ETH – Consolidation près du support, rebond potentiel à venir
Plan de trading Long $ETH
Entrée : 1,890 –$ETH – Consolidation près du support, rebond potentiel à venir
Plan de trading Long $ETH
Entrée : 1,890 – 1,905
SL : 1,860
TP1: 1,935
TP2: 1,960
TP3: 2,000
Le prix a subi un rejet net à 1,935, mais a rapidement absorbé la pression vendeuse et s’est stabilisé autour d’un support clé. Les moyennes mobiles à court terme s’aplatissent, indiquant que l’élan baissier s’épuise. Se maintenir au-dessus de 1,890 signale une présence solide des acheteurs, préparant une configuration d’achat long favorable en termes risque/rendement pour une poursuite.
Trade $ETH ici 👇
$ETH – Consolidation près du support, rebond potentiel à venir Plan de trading Long $ETH Entrée : 1,890 –
$ETH – Consolidation près du support, rebond potentiel à venir
Plan de trading Long $ETH
Entrée : 1,890 – 1,905
SL : 1,860
TP1: 1,935
TP2: 1,960
TP3: 2,000
Le prix a subi un rejet net à 1,935, mais a rapidement absorbé la pression vendeuse et s’est stabilisé autour d’un support clé. Les moyennes mobiles à court terme s’aplatissent, indiquant que l’élan baissier s’épuise. Se maintenir au-dessus de 1,890 signale une présence solide des acheteurs, préparant une configuration d’achat long favorable en termes risque/rendement pour une poursuite.
Trade $ETH ici 👇
Plan de trading Long $ETH
Entrée : 1,890 – 1,905
SL : 1,860
TP1: 1,935
TP2: 1,960
TP3: 2,000
Le prix a subi un rejet net à 1,935, mais a rapidement absorbé la pression vendeuse et s’est stabilisé autour d’un support clé. Les moyennes mobiles à court terme s’aplatissent, indiquant que l’élan baissier s’épuise. Se maintenir au-dessus de 1,890 signale une présence solide des acheteurs, préparant une configuration d’achat long favorable en termes risque/rendement pour une poursuite.
Trade $ETH ici 👇
22
·
--
Haussier
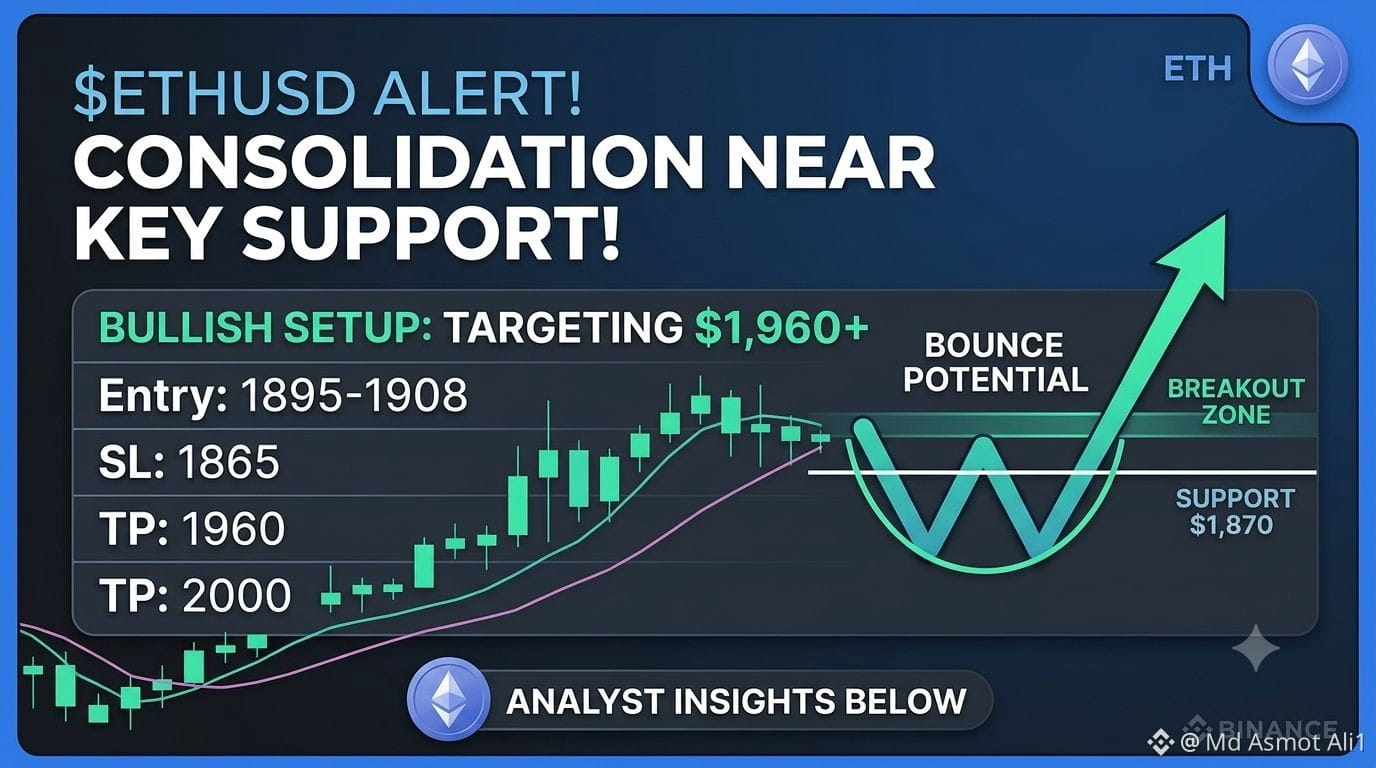
$ETH – Consolidation près du support, préparation à un rebond potentiel
Plan de trading Long $ETH
{spot}(ETHUSDT)
Entrée : 1 895 – 1 908
SL : 1 865
TP : 1 930
TP : 1 960
TP : 2 000
Après avoir testé le plus haut local autour de 1 921, le prix est reparti à la baisse et se stabilise actuellement autour de la zone de support clé. Les moyennes mobiles sur le plus petit timeframe convergent, signalant une contraction de la volatilité. Les acheteurs tiennent leur position au-dessus de 1 870, montrant une absorption maîtrisée plutôt qu'une vente panique. Une poussée au-dessus de la résistance à court terme pourrait déclencher une continuation haussière régulière.
Trade $ETH here 👇
Sentiment de marché & analyses d’experts
Bilan du marché : Les principaux médias crypto (comme CoinDesk et CoinTelegraph) soulignent qu’Ethereum traverse actuellement une consolidation à court terme, les traders évaluant les signaux macroéconomiques plus larges face à une activité réseau solide.
Consensus des analystes : Les analystes techniques de plateformes comme TradingView indiquent que le fait de rester au-dessus de la zone de demande de 1 870 – 1 890 conserve la structure haussière sur des timeframes plus courts, avec des objectifs visant le bloc de résistance à partir de 1 950+.
$ETH – Consolidation près du support, préparation à un rebond potentiel
Plan de trading Long $ETH
Entrée : 1 895 – 1 908
SL : 1 865
TP : 1 930
TP : 1 960
TP : 2 000
Après avoir testé le plus haut local autour de 1 921, le prix est reparti à la baisse et se stabilise actuellement autour de la zone de support clé. Les moyennes mobiles sur le plus petit timeframe convergent, signalant une contraction de la volatilité. Les acheteurs tiennent leur position au-dessus de 1 870, montrant une absorption maîtrisée plutôt qu'une vente panique. Une poussée au-dessus de la résistance à court terme pourrait déclencher une continuation haussière régulière.
Trade $ETH here 👇
Sentiment de marché & analyses d’experts
Bilan du marché : Les principaux médias crypto (comme CoinDesk et CoinTelegraph) soulignent qu’Ethereum traverse actuellement une consolidation à court terme, les traders évaluant les signaux macroéconomiques plus larges face à une activité réseau solide.
Consensus des analystes : Les analystes techniques de plateformes comme TradingView indiquent que le fait de rester au-dessus de la zone de demande de 1 870 – 1 890 conserve la structure haussière sur des timeframes plus courts, avec des objectifs visant le bloc de résistance à partir de 1 950+.
Plan de trading Long $ETH
Entrée : 1 895 – 1 908
SL : 1 865
TP : 1 930
TP : 1 960
TP : 2 000
Après avoir testé le plus haut local autour de 1 921, le prix est reparti à la baisse et se stabilise actuellement autour de la zone de support clé. Les moyennes mobiles sur le plus petit timeframe convergent, signalant une contraction de la volatilité. Les acheteurs tiennent leur position au-dessus de 1 870, montrant une absorption maîtrisée plutôt qu'une vente panique. Une poussée au-dessus de la résistance à court terme pourrait déclencher une continuation haussière régulière.
Trade $ETH here 👇
Sentiment de marché & analyses d’experts
Bilan du marché : Les principaux médias crypto (comme CoinDesk et CoinTelegraph) soulignent qu’Ethereum traverse actuellement une consolidation à court terme, les traders évaluant les signaux macroéconomiques plus larges face à une activité réseau solide.
Consensus des analystes : Les analystes techniques de plateformes comme TradingView indiquent que le fait de rester au-dessus de la zone de demande de 1 870 – 1 890 conserve la structure haussière sur des timeframes plus courts, avec des objectifs visant le bloc de résistance à partir de 1 950+.
47
Article
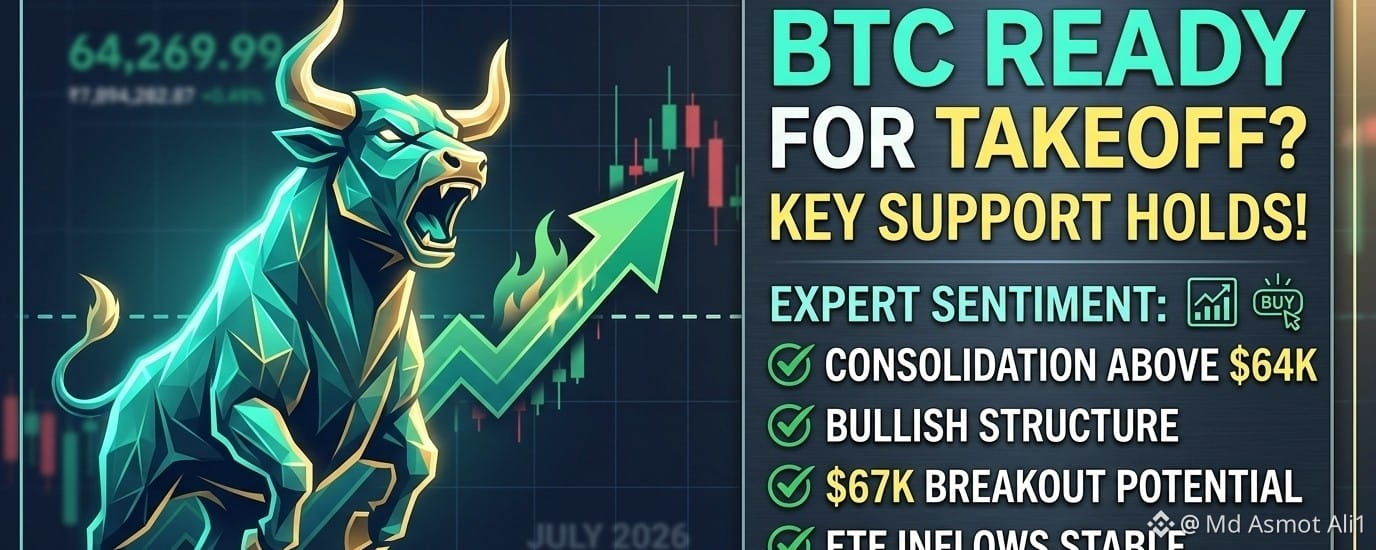
$BTC – Formation de base près d’un support clé, en préparation d’un éventuel breakout
Plan de trading Long $BTC
En$BTC – Formation de base près d’un support clé, en préparation d’un éventuel breakout
Plan de trading Long $BTC
Entrée : 63 800 – 64 300
SL : 62 500
TP : 65 800
TP : 67 200
TP : 69 000
Après avoir rebondi fortement après le récent plus bas à 57 800 $, le prix consolide au-dessus de 64 000 $. Le prix se maintient près de la MM(7) et de la MM(25), signalant une pression de vente réduite. Tant que le support vers 63 300 $ tient, cette consolidation serrée prépare la voie pour que les acheteurs fassent repartir la tendance haussière vers les niveaux de résistance supérieurs.
$BTC – Formation de base près d’un support clé, en préparation d’un éventuel breakout Plan de trading Long $BTC En
$BTC – Formation de base près d’un support clé, en préparation d’un éventuel breakout
Plan de trading Long $BTC
Entrée : 63 800 – 64 300
SL : 62 500
TP : 65 800
TP : 67 200
TP : 69 000
Après avoir rebondi fortement après le récent plus bas à 57 800 $, le prix consolide au-dessus de 64 000 $. Le prix se maintient près de la MM(7) et de la MM(25), signalant une pression de vente réduite. Tant que le support vers 63 300 $ tient, cette consolidation serrée prépare la voie pour que les acheteurs fassent repartir la tendance haussière vers les niveaux de résistance supérieurs.
Plan de trading Long $BTC
Entrée : 63 800 – 64 300
SL : 62 500
TP : 65 800
TP : 67 200
TP : 69 000
Après avoir rebondi fortement après le récent plus bas à 57 800 $, le prix consolide au-dessus de 64 000 $. Le prix se maintient près de la MM(7) et de la MM(25), signalant une pression de vente réduite. Tant que le support vers 63 300 $ tient, cette consolidation serrée prépare la voie pour que les acheteurs fassent repartir la tendance haussière vers les niveaux de résistance supérieurs.
47
·
--
Haussier
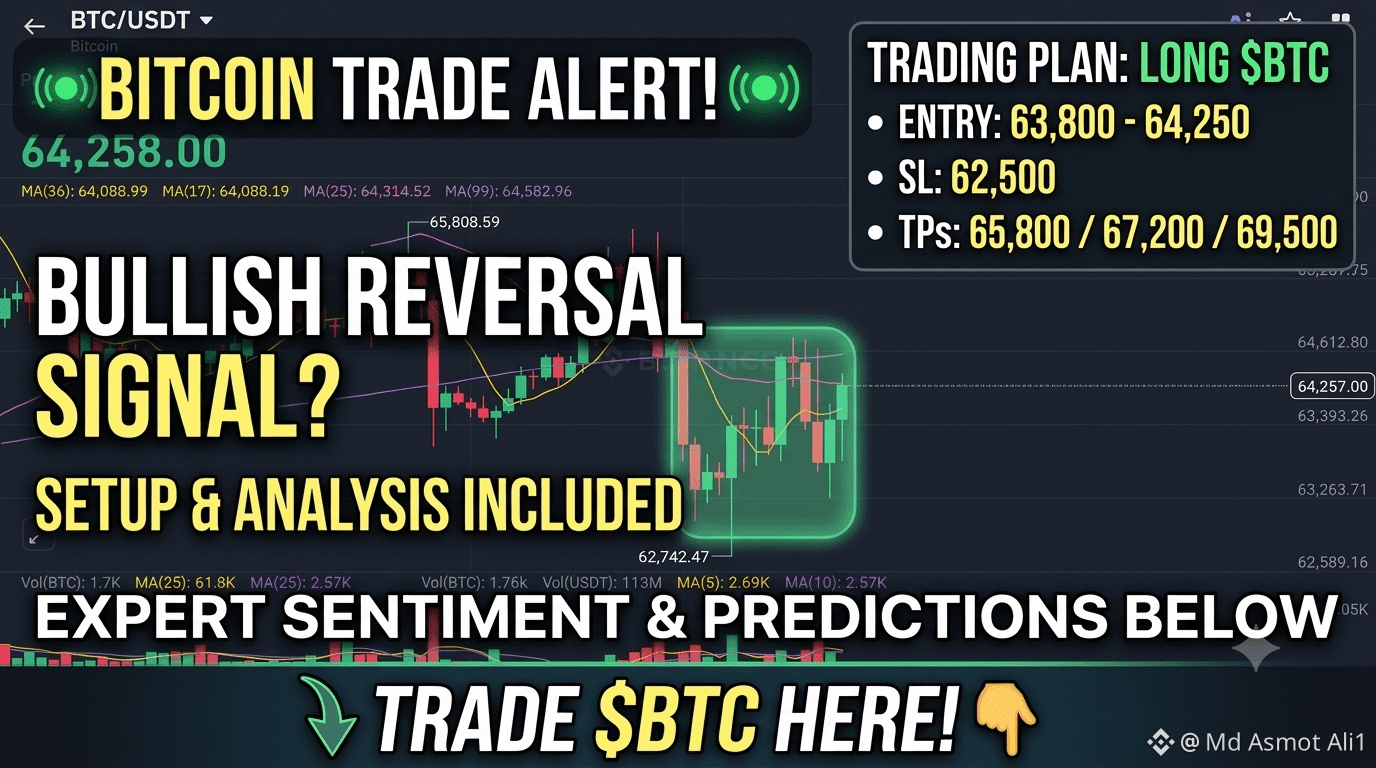
$BTC – Formation à la hausse au niveau du support, inversion haussière potentielle en cours
Plan de trading Long $BTC
{spot}(BTCUSDT)
Entrée : 63,800 – 64,250
SL : 62,500
TP : 65,800
TP : 67,200
TP : 69,500
Après avoir balayé la liquidité vers le bas jusqu’à 62,742 $, le prix a rapidement rebondi et est actuellement en phase de consolidation au-dessus d’un support clé autour de 64,000 $. La dynamique baissière s’affaiblit tandis que des bougies vertes commencent à absorber la pression vendeuse. Tant que le BTC reste au-dessus de cette nouvelle zone de demande établie, une remontée pour retester des niveaux de résistance plus élevés semble très probable.
Trade $BTC ici 👇
Ce que disent les experts du marché sur le Bitcoin :
Economic Times / CoinSwitch Markets : Les analystes notent que le BTC défend sa zone de support immédiate entre 62,500 $ et 63,300 $. Le maintien au-dessus des moyennes mobiles dans cette zone préserve l’espoir d’un rebond à court terme, bien que la reprise de 65,500 $–66,000 $ soit cruciale pour une dynamique haussière durable.
Delta Exchange Research : Le sentiment de marché reflète une consolidation après un “leverage shakeout”. Le $ BTC continue de montrer une force structurelle par rapport à l’ensemble du marché des altcoins, formant une phase de creux local potentiel au-dessus de 62,800 $.
Analyse Mudrex & WazirX : Malgré l’incertitude macro liée aux politiques de taux de la Fed et aux sorties d’ETF, l’intérêt institutionnel reste intact. Les indicateurs techniques suggèrent que la pression vendeuse se calme, posant les bases d’une accumulation progressive de positions près des supports clés
$BTC – Formation à la hausse au niveau du support, inversion haussière potentielle en cours
Plan de trading Long $BTC
Entrée : 63,800 – 64,250
SL : 62,500
TP : 65,800
TP : 67,200
TP : 69,500
Après avoir balayé la liquidité vers le bas jusqu’à 62,742 $, le prix a rapidement rebondi et est actuellement en phase de consolidation au-dessus d’un support clé autour de 64,000 $. La dynamique baissière s’affaiblit tandis que des bougies vertes commencent à absorber la pression vendeuse. Tant que le BTC reste au-dessus de cette nouvelle zone de demande établie, une remontée pour retester des niveaux de résistance plus élevés semble très probable.
Trade $BTC ici 👇
Ce que disent les experts du marché sur le Bitcoin :
Economic Times / CoinSwitch Markets : Les analystes notent que le BTC défend sa zone de support immédiate entre 62,500 $ et 63,300 $. Le maintien au-dessus des moyennes mobiles dans cette zone préserve l’espoir d’un rebond à court terme, bien que la reprise de 65,500 $–66,000 $ soit cruciale pour une dynamique haussière durable.
Delta Exchange Research : Le sentiment de marché reflète une consolidation après un “leverage shakeout”. Le $ BTC continue de montrer une force structurelle par rapport à l’ensemble du marché des altcoins, formant une phase de creux local potentiel au-dessus de 62,800 $.
Analyse Mudrex & WazirX : Malgré l’incertitude macro liée aux politiques de taux de la Fed et aux sorties d’ETF, l’intérêt institutionnel reste intact. Les indicateurs techniques suggèrent que la pression vendeuse se calme, posant les bases d’une accumulation progressive de positions près des supports clés
Plan de trading Long $BTC
Entrée : 63,800 – 64,250
SL : 62,500
TP : 65,800
TP : 67,200
TP : 69,500
Après avoir balayé la liquidité vers le bas jusqu’à 62,742 $, le prix a rapidement rebondi et est actuellement en phase de consolidation au-dessus d’un support clé autour de 64,000 $. La dynamique baissière s’affaiblit tandis que des bougies vertes commencent à absorber la pression vendeuse. Tant que le BTC reste au-dessus de cette nouvelle zone de demande établie, une remontée pour retester des niveaux de résistance plus élevés semble très probable.
Trade $BTC ici 👇
Ce que disent les experts du marché sur le Bitcoin :
Economic Times / CoinSwitch Markets : Les analystes notent que le BTC défend sa zone de support immédiate entre 62,500 $ et 63,300 $. Le maintien au-dessus des moyennes mobiles dans cette zone préserve l’espoir d’un rebond à court terme, bien que la reprise de 65,500 $–66,000 $ soit cruciale pour une dynamique haussière durable.
Delta Exchange Research : Le sentiment de marché reflète une consolidation après un “leverage shakeout”. Le $ BTC continue de montrer une force structurelle par rapport à l’ensemble du marché des altcoins, formant une phase de creux local potentiel au-dessus de 62,800 $.
Analyse Mudrex & WazirX : Malgré l’incertitude macro liée aux politiques de taux de la Fed et aux sorties d’ETF, l’intérêt institutionnel reste intact. Les indicateurs techniques suggèrent que la pression vendeuse se calme, posant les bases d’une accumulation progressive de positions près des supports clés
74
Article
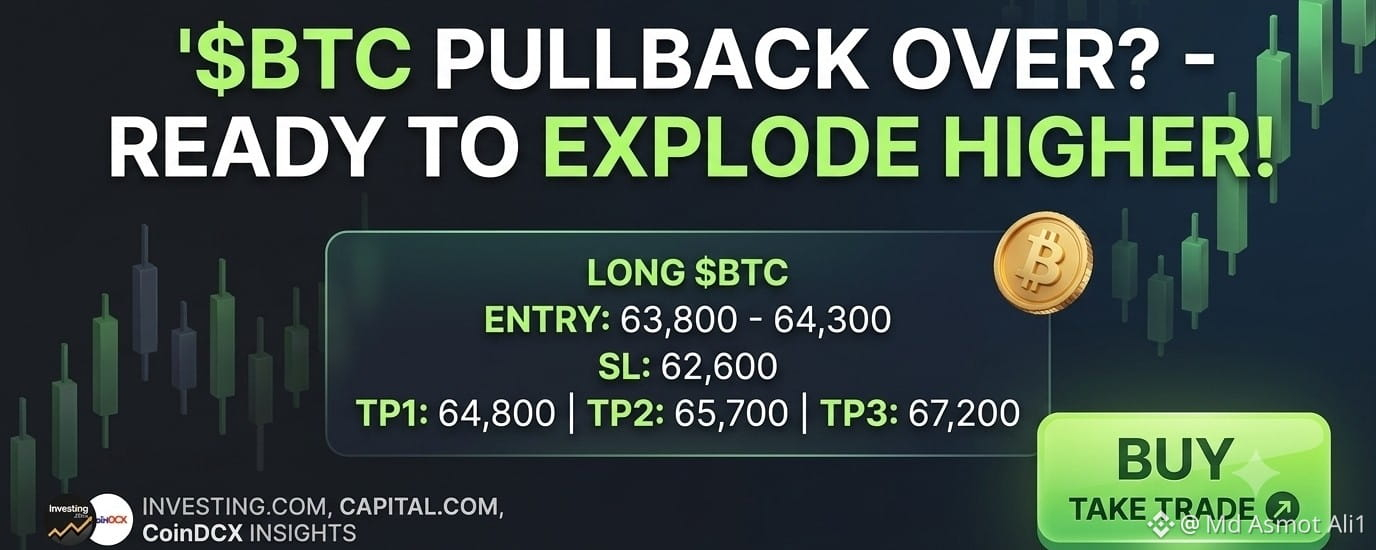
$BTC – Maintien du support central, prêt pour la prochaine étape à la hausse
Plan de trading Long $BTC
Entrée : 63,800 – 6$BTC – Maintien du support central, prêt pour la prochaine étape à la hausse
Plan de trading Long $BTC
Entrée : 63,800 – 64,300
SL : 62,600
TP1 : 64,800
TP2 : 65,700
TP3 : 67,200
Le prix a rebondi de façon satisfaisante sur la borne inférieure et consolide désormais fermement au-dessus des moyennes mobiles clés. Le volume de vente a nettement diminué tandis que les acheteurs continuent de défendre la structure de plus bas plus hauts. Lorsque le prix absorbe la résistance locale après un rebond, cela déclenche généralement une nouvelle vague de continuation haussière vers les principales zones d’offre.
$BTC – Maintien du support central, prêt pour la prochaine étape à la hausse Plan de trading Long $BTC Entrée : 63,800 – 6
$BTC – Maintien du support central, prêt pour la prochaine étape à la hausse
Plan de trading Long $BTC
Entrée : 63,800 – 64,300
SL : 62,600
TP1 : 64,800
TP2 : 65,700
TP3 : 67,200
Le prix a rebondi de façon satisfaisante sur la borne inférieure et consolide désormais fermement au-dessus des moyennes mobiles clés. Le volume de vente a nettement diminué tandis que les acheteurs continuent de défendre la structure de plus bas plus hauts. Lorsque le prix absorbe la résistance locale après un rebond, cela déclenche généralement une nouvelle vague de continuation haussière vers les principales zones d’offre.
Plan de trading Long $BTC
Entrée : 63,800 – 64,300
SL : 62,600
TP1 : 64,800
TP2 : 65,700
TP3 : 67,200
Le prix a rebondi de façon satisfaisante sur la borne inférieure et consolide désormais fermement au-dessus des moyennes mobiles clés. Le volume de vente a nettement diminué tandis que les acheteurs continuent de défendre la structure de plus bas plus hauts. Lorsque le prix absorbe la résistance locale après un rebond, cela déclenche généralement une nouvelle vague de continuation haussière vers les principales zones d’offre.
79
·
--
Haussier
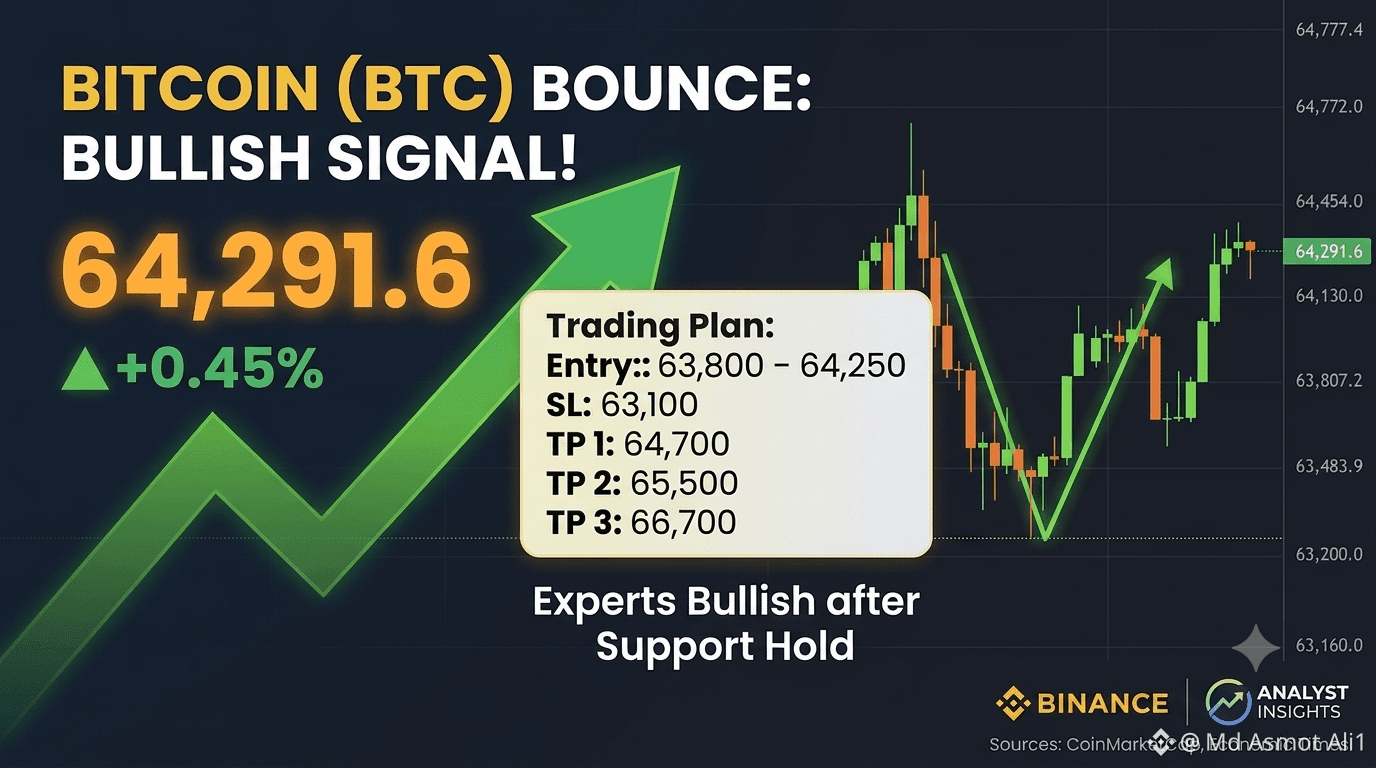
$BTC – Rebond Fort sur le Support, Les Bulls Visent une Continuation à 66,7K$
Plan de trading : Long $BTC
{spot}(BTCUSDT)
Entrée : 63 800 – 64 250
SL : 63 100
TP 1 : 64 700
TP 2 : 65 500
TP 3 : 66 700
Le Bitcoin est tombé dans la zone de support des 63 200 $ et a trouvé une demande immédiate, affichant un redressement net en forme de V au-dessus de 64 200 $. Le prix se maintient désormais solidement au-dessus des moyennes mobiles à court terme, indiquant que la pression vendeuse s’est tarie. Tant que BTC conserve cette base au-dessus du support, l’élan acheteur favorise une retouche des plus hauts récents.
Analyse d’expert & Mises à jour du marché
D’après les récentes mises à jour du marché de CoinMarketCap et les analystes cités dans The Economic Times :
Sentiment institutionnel & Réserve fédérale : Les experts du marché soulignent que malgré la volatilité à court terme et les liquidations récentes, l’intérêt institutionnel pour le Bitcoin reste intact. Les traders surveillent actuellement de près les signaux macro, notamment la décision de politique de la Réserve fédérale à venir et les données d’inflation PCE.
Niveaux clés : Des analystes de recherche notent que même si le Bitcoin a réussi à reprendre le support clé près de 63 000–63 500 $, une cassure au-dessus de la zone de résistance immédiate à 64 500–65 500 est cruciale pour confirmer un élan haussier complet vers 66 700+.
$BTC – Rebond Fort sur le Support, Les Bulls Visent une Continuation à 66,7K$
Plan de trading : Long $BTC
Entrée : 63 800 – 64 250
SL : 63 100
TP 1 : 64 700
TP 2 : 65 500
TP 3 : 66 700
Le Bitcoin est tombé dans la zone de support des 63 200 $ et a trouvé une demande immédiate, affichant un redressement net en forme de V au-dessus de 64 200 $. Le prix se maintient désormais solidement au-dessus des moyennes mobiles à court terme, indiquant que la pression vendeuse s’est tarie. Tant que BTC conserve cette base au-dessus du support, l’élan acheteur favorise une retouche des plus hauts récents.
Analyse d’expert & Mises à jour du marché
D’après les récentes mises à jour du marché de CoinMarketCap et les analystes cités dans The Economic Times :
Sentiment institutionnel & Réserve fédérale : Les experts du marché soulignent que malgré la volatilité à court terme et les liquidations récentes, l’intérêt institutionnel pour le Bitcoin reste intact. Les traders surveillent actuellement de près les signaux macro, notamment la décision de politique de la Réserve fédérale à venir et les données d’inflation PCE.
Niveaux clés : Des analystes de recherche notent que même si le Bitcoin a réussi à reprendre le support clé près de 63 000–63 500 $, une cassure au-dessus de la zone de résistance immédiate à 64 500–65 500 est cruciale pour confirmer un élan haussier complet vers 66 700+.
Plan de trading : Long $BTC
Entrée : 63 800 – 64 250
SL : 63 100
TP 1 : 64 700
TP 2 : 65 500
TP 3 : 66 700
Le Bitcoin est tombé dans la zone de support des 63 200 $ et a trouvé une demande immédiate, affichant un redressement net en forme de V au-dessus de 64 200 $. Le prix se maintient désormais solidement au-dessus des moyennes mobiles à court terme, indiquant que la pression vendeuse s’est tarie. Tant que BTC conserve cette base au-dessus du support, l’élan acheteur favorise une retouche des plus hauts récents.
Analyse d’expert & Mises à jour du marché
D’après les récentes mises à jour du marché de CoinMarketCap et les analystes cités dans The Economic Times :
Sentiment institutionnel & Réserve fédérale : Les experts du marché soulignent que malgré la volatilité à court terme et les liquidations récentes, l’intérêt institutionnel pour le Bitcoin reste intact. Les traders surveillent actuellement de près les signaux macro, notamment la décision de politique de la Réserve fédérale à venir et les données d’inflation PCE.
Niveaux clés : Des analystes de recherche notent que même si le Bitcoin a réussi à reprendre le support clé près de 63 000–63 500 $, une cassure au-dessus de la zone de résistance immédiate à 64 500–65 500 est cruciale pour confirmer un élan haussier complet vers 66 700+.
119
·
--
Haussier
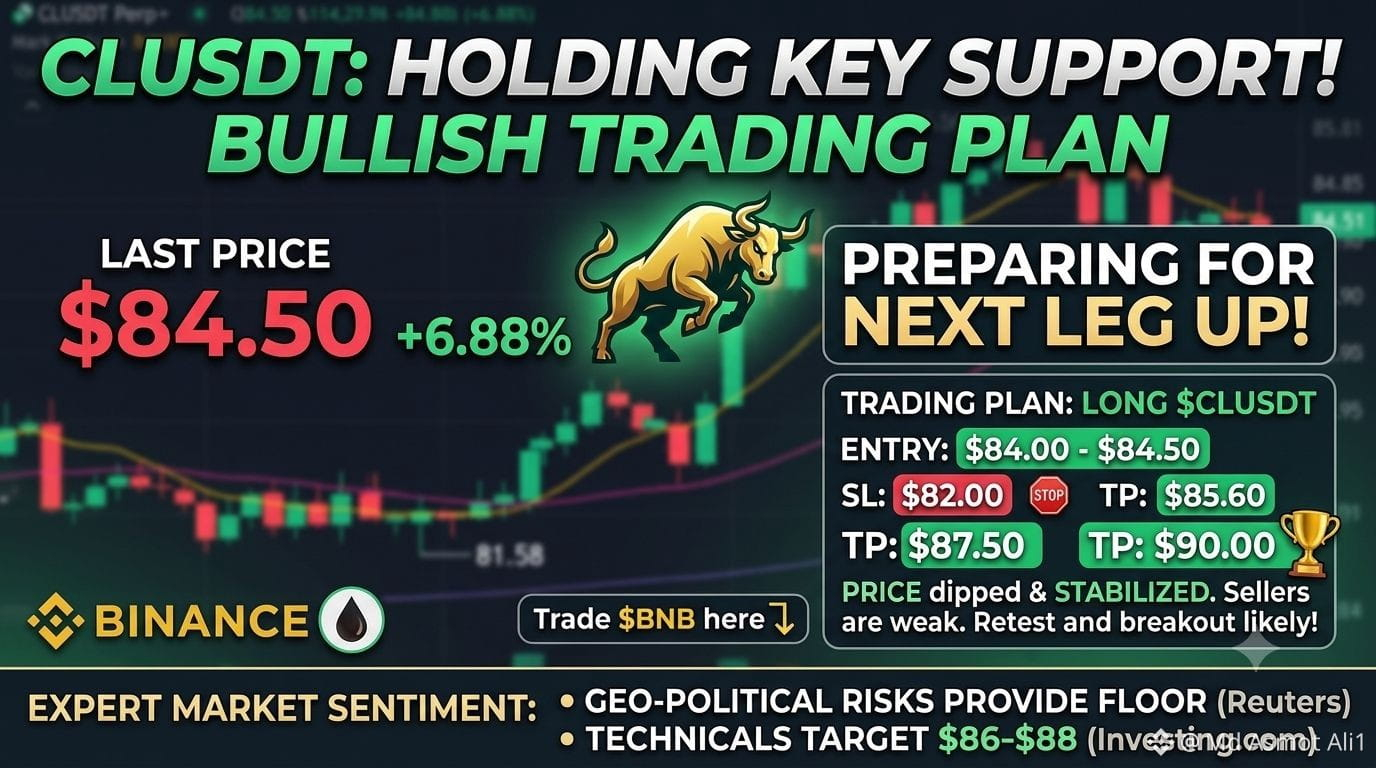
$CL USDT – Consolidation au-dessus du support clé, préparation de la prochaine impulsion vers le haut !
Plan de trading Long $CL
{future}(CLUSDT)
USDT
Entrée : 84,00 – 84,50
SL : 82,00
TP : 85,60
TP : 87,50
TP : 90,00
Après avoir atteint un plus haut sur 24h de 85,60, le prix a légèrement corrigé à la baisse et maintient désormais fermement la zone de support de la MA(25). Le volume pendant cette phase de repli reste faible, ce qui indique une pression vendeuse faible. Tant que le prix conserve cette structure au-dessus de 84 $, les acheteurs sont bien placés pour déclencher une cassure haussière vers des niveaux plus élevés.
Trade $CL USDT ici 👇
Sentiment de marché & perspective des experts pour le pétrole brut WTI (CL) :
Prime de risque géopolitique : Les principales plateformes financières comme Bloomberg et Reuters soulignent que les tensions persistantes au Moyen-Orient et d’éventuelles restrictions d’approvisionnement de l’OPEP+ continuent d’offrir un solide plancher de prix pour le pétrole brut.
Consensus technique : Les analystes de TradingView et Investing.com notent un élan haussier à moyen terme, les prix se maintenant constamment au-dessus des moyennes mobiles quotidiennes clés, avec pour objectif des zones de résistance majeures autour de 86–88 $.
$CL USDT – Consolidation au-dessus du support clé, préparation de la prochaine impulsion vers le haut !
Plan de trading Long $CL
USDT
Entrée : 84,00 – 84,50
SL : 82,00
TP : 85,60
TP : 87,50
TP : 90,00
Après avoir atteint un plus haut sur 24h de 85,60, le prix a légèrement corrigé à la baisse et maintient désormais fermement la zone de support de la MA(25). Le volume pendant cette phase de repli reste faible, ce qui indique une pression vendeuse faible. Tant que le prix conserve cette structure au-dessus de 84 $, les acheteurs sont bien placés pour déclencher une cassure haussière vers des niveaux plus élevés.
Trade $CL USDT ici 👇
Sentiment de marché & perspective des experts pour le pétrole brut WTI (CL) :
Prime de risque géopolitique : Les principales plateformes financières comme Bloomberg et Reuters soulignent que les tensions persistantes au Moyen-Orient et d’éventuelles restrictions d’approvisionnement de l’OPEP+ continuent d’offrir un solide plancher de prix pour le pétrole brut.
Consensus technique : Les analystes de TradingView et Investing.com notent un élan haussier à moyen terme, les prix se maintenant constamment au-dessus des moyennes mobiles quotidiennes clés, avec pour objectif des zones de résistance majeures autour de 86–88 $.
Plan de trading Long $CL
USDT
Entrée : 84,00 – 84,50
SL : 82,00
TP : 85,60
TP : 87,50
TP : 90,00
Après avoir atteint un plus haut sur 24h de 85,60, le prix a légèrement corrigé à la baisse et maintient désormais fermement la zone de support de la MA(25). Le volume pendant cette phase de repli reste faible, ce qui indique une pression vendeuse faible. Tant que le prix conserve cette structure au-dessus de 84 $, les acheteurs sont bien placés pour déclencher une cassure haussière vers des niveaux plus élevés.
Trade $CL USDT ici 👇
Sentiment de marché & perspective des experts pour le pétrole brut WTI (CL) :
Prime de risque géopolitique : Les principales plateformes financières comme Bloomberg et Reuters soulignent que les tensions persistantes au Moyen-Orient et d’éventuelles restrictions d’approvisionnement de l’OPEP+ continuent d’offrir un solide plancher de prix pour le pétrole brut.
Consensus technique : Les analystes de TradingView et Investing.com notent un élan haussier à moyen terme, les prix se maintenant constamment au-dessus des moyennes mobiles quotidiennes clés, avec pour objectif des zones de résistance majeures autour de 86–88 $.
51
Article
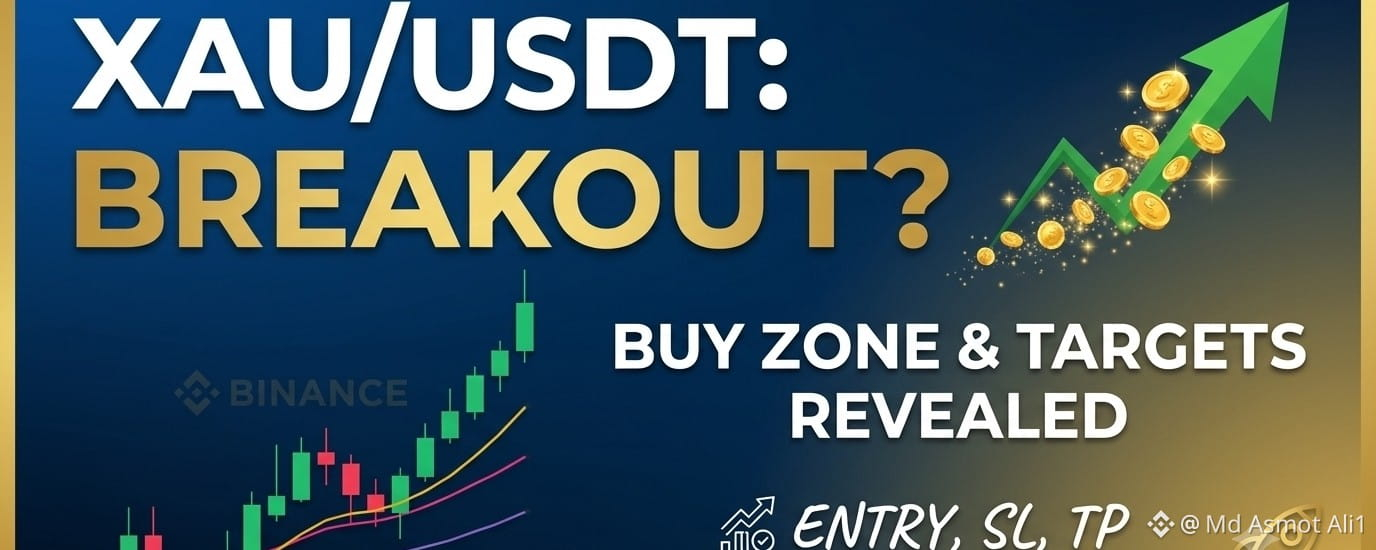
$XAU – Les acheteurs défendent le support clé, prêts pour la prochaine vague à la hausse 🚀
Plan de trading : Long $XAU
Entrée :$XAU – Les acheteurs défendent le support clé, prêts pour la prochaine vague à la hausse 🚀
Plan de trading : Long $XAU
Entrée : 4 030 – 4 055
SL : 3 980
TP1 : 4 090
TP2 : 4 180
TP3 : 4 250
Analyse :
Le prix a fortement rebondi à partir du niveau de base de 3 948 et consolide désormais régulièrement au-dessus du support crucial à 4 000. La pression vendeuse a considérablement diminué, montrant des signes clairs d’accumulation. Tant que cette structure tient, les acheteurs ont la faveur pour faire monter le prix vers des niveaux de résistance plus élevés.
Négociation $XAU içi 👇
$XAU – Les acheteurs défendent le support clé, prêts pour la prochaine vague à la hausse 🚀 Plan de trading : Long $XAU Entrée :
$XAU – Les acheteurs défendent le support clé, prêts pour la prochaine vague à la hausse 🚀
Plan de trading : Long $XAU
Entrée : 4 030 – 4 055
SL : 3 980
TP1 : 4 090
TP2 : 4 180
TP3 : 4 250
Analyse :
Le prix a fortement rebondi à partir du niveau de base de 3 948 et consolide désormais régulièrement au-dessus du support crucial à 4 000. La pression vendeuse a considérablement diminué, montrant des signes clairs d’accumulation. Tant que cette structure tient, les acheteurs ont la faveur pour faire monter le prix vers des niveaux de résistance plus élevés.
Négociation $XAU içi 👇
Plan de trading : Long $XAU
Entrée : 4 030 – 4 055
SL : 3 980
TP1 : 4 090
TP2 : 4 180
TP3 : 4 250
Analyse :
Le prix a fortement rebondi à partir du niveau de base de 3 948 et consolide désormais régulièrement au-dessus du support crucial à 4 000. La pression vendeuse a considérablement diminué, montrant des signes clairs d’accumulation. Tant que cette structure tient, les acheteurs ont la faveur pour faire monter le prix vers des niveaux de résistance plus élevés.
Négociation $XAU içi 👇
102
·
--
Haussier
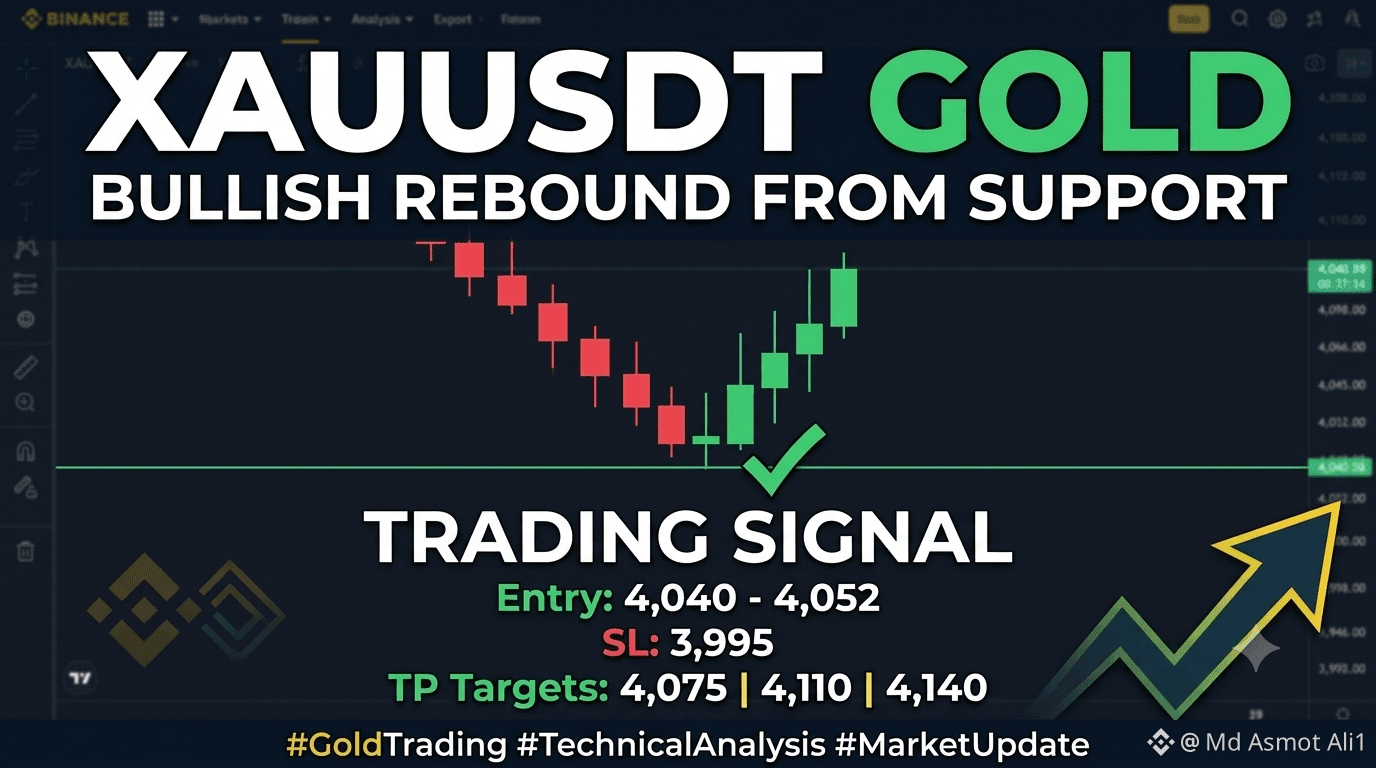
$XAU – Rebondir depuis un support clé, les acheteurs visent un renversement de tendance
Plan de trading Long $XAU
{future}(XAUUSDT)
* Entrée : 4 040 – 4 052
SL : 3 995
TP1 : 4 075
TP2 : 4 110
TP3 : 4 140
Le prix a testé un solide support autour du niveau 4 003 et s’est maintenu fermement, montrant des signes précoces d’une réaction haussière. La dynamique immédiate de vente s’estompe et les chandeliers repassent au-dessus des Moyennes Mobiles à court terme. Tant que la base psychologique des 4 000 reste intacte, la structure favorise une continuation haussière vers des zones de résistance plus élevées.
🌐 Analyse d’experts & mises à jour des analystes pour l’or ($XAU)
Focus marché : Les analystes de grands médias financiers (comme TradingView, FXStreet et Investing.com) soulignent que l’or se stabilise actuellement à de grands niveaux de support psychologiques.
Catalyseurs haussiers : Les experts indiquent que des tensions géopolitiques persistantes, les achats d’or par les banques centrales et des baisses de taux d’intérêt anticipées apportent un soutien de fond aux prix de l’or.
Perspective clé : À court terme, les consolidations du marché sont largement considérées par les traders institutionnels comme des replis sains, beaucoup prévoyant une poursuite à moyen et long terme de la tendance haussière globale de l’or.
$XAU – Rebondir depuis un support clé, les acheteurs visent un renversement de tendance
Plan de trading Long $XAU
* Entrée : 4 040 – 4 052
SL : 3 995
TP1 : 4 075
TP2 : 4 110
TP3 : 4 140
Le prix a testé un solide support autour du niveau 4 003 et s’est maintenu fermement, montrant des signes précoces d’une réaction haussière. La dynamique immédiate de vente s’estompe et les chandeliers repassent au-dessus des Moyennes Mobiles à court terme. Tant que la base psychologique des 4 000 reste intacte, la structure favorise une continuation haussière vers des zones de résistance plus élevées.
🌐 Analyse d’experts & mises à jour des analystes pour l’or ($XAU )
Focus marché : Les analystes de grands médias financiers (comme TradingView, FXStreet et Investing.com) soulignent que l’or se stabilise actuellement à de grands niveaux de support psychologiques.
Catalyseurs haussiers : Les experts indiquent que des tensions géopolitiques persistantes, les achats d’or par les banques centrales et des baisses de taux d’intérêt anticipées apportent un soutien de fond aux prix de l’or.
Perspective clé : À court terme, les consolidations du marché sont largement considérées par les traders institutionnels comme des replis sains, beaucoup prévoyant une poursuite à moyen et long terme de la tendance haussière globale de l’or.
Plan de trading Long $XAU
* Entrée : 4 040 – 4 052
SL : 3 995
TP1 : 4 075
TP2 : 4 110
TP3 : 4 140
Le prix a testé un solide support autour du niveau 4 003 et s’est maintenu fermement, montrant des signes précoces d’une réaction haussière. La dynamique immédiate de vente s’estompe et les chandeliers repassent au-dessus des Moyennes Mobiles à court terme. Tant que la base psychologique des 4 000 reste intacte, la structure favorise une continuation haussière vers des zones de résistance plus élevées.
🌐 Analyse d’experts & mises à jour des analystes pour l’or ($XAU )
Focus marché : Les analystes de grands médias financiers (comme TradingView, FXStreet et Investing.com) soulignent que l’or se stabilise actuellement à de grands niveaux de support psychologiques.
Catalyseurs haussiers : Les experts indiquent que des tensions géopolitiques persistantes, les achats d’or par les banques centrales et des baisses de taux d’intérêt anticipées apportent un soutien de fond aux prix de l’or.
Perspective clé : À court terme, les consolidations du marché sont largement considérées par les traders institutionnels comme des replis sains, beaucoup prévoyant une poursuite à moyen et long terme de la tendance haussière globale de l’or.
73
Article
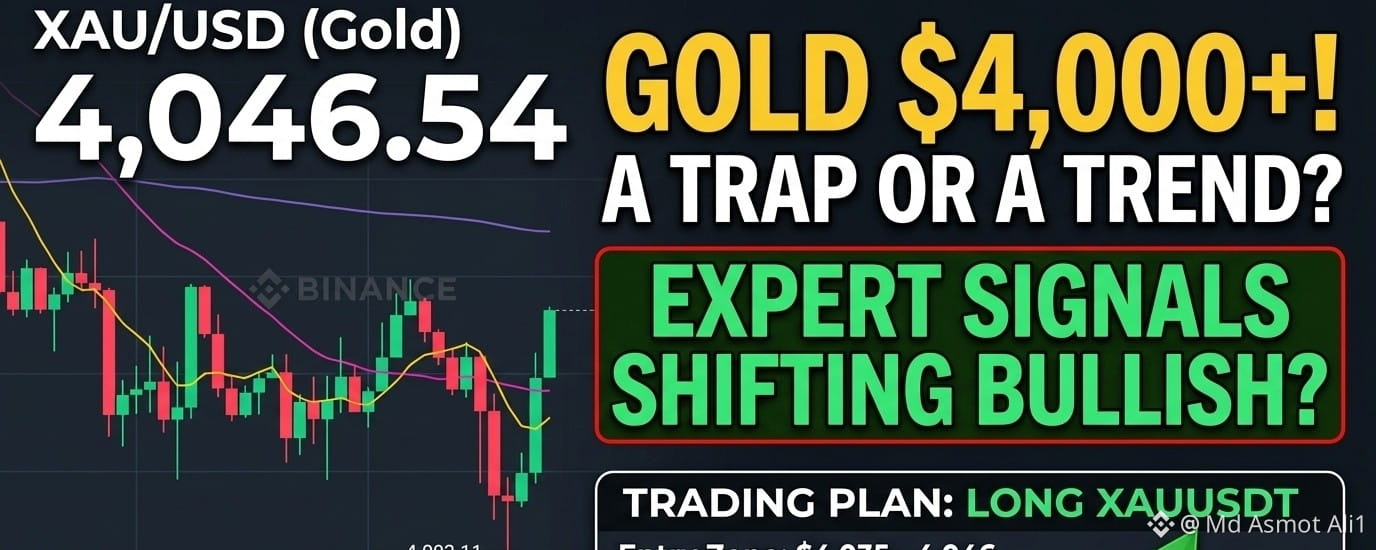
$XAUUSDT – Rebond fort depuis le support local, momentum qui bascule haussier
Plan de trading Long $XAUUSDT$XAU USDT – Rebond fort depuis le support local, momentum qui bascule haussier
Plan de trading Long $XAU USDT
Entrée : 4 035 – 4 046
SL : 3 995
TP1 : 4 070
TP2 : 4 085
TP3 : 4 120
Le prix a connu une forte baisse jusqu’au niveau de support à 4 003 $, mais a rapidement rencontré une réaction acheteuse solide et a reconquis de manière agressive les moyennes mobiles clés sur le plus court terme. Le rejet marqué au bas du mouvement forme une récupération en forme de V, avec un volume élevé, indiquant que la pression vendeuse est entièrement épuisée. Tant que le prix reste au-dessus de la zone de support locale, une poursuite vers des niveaux de résistance plus élevés demeure très probable.
$XAUUSDT – Rebond fort depuis le support local, momentum qui bascule haussier Plan de trading Long $XAUUSDT
$XAU USDT – Rebond fort depuis le support local, momentum qui bascule haussier
Plan de trading Long $XAU USDT
Entrée : 4 035 – 4 046
SL : 3 995
TP1 : 4 070
TP2 : 4 085
TP3 : 4 120
Le prix a connu une forte baisse jusqu’au niveau de support à 4 003 $, mais a rapidement rencontré une réaction acheteuse solide et a reconquis de manière agressive les moyennes mobiles clés sur le plus court terme. Le rejet marqué au bas du mouvement forme une récupération en forme de V, avec un volume élevé, indiquant que la pression vendeuse est entièrement épuisée. Tant que le prix reste au-dessus de la zone de support locale, une poursuite vers des niveaux de résistance plus élevés demeure très probable.
Plan de trading Long $XAU USDT
Entrée : 4 035 – 4 046
SL : 3 995
TP1 : 4 070
TP2 : 4 085
TP3 : 4 120
Le prix a connu une forte baisse jusqu’au niveau de support à 4 003 $, mais a rapidement rencontré une réaction acheteuse solide et a reconquis de manière agressive les moyennes mobiles clés sur le plus court terme. Le rejet marqué au bas du mouvement forme une récupération en forme de V, avec un volume élevé, indiquant que la pression vendeuse est entièrement épuisée. Tant que le prix reste au-dessus de la zone de support locale, une poursuite vers des niveaux de résistance plus élevés demeure très probable.
121
·
--
Haussier
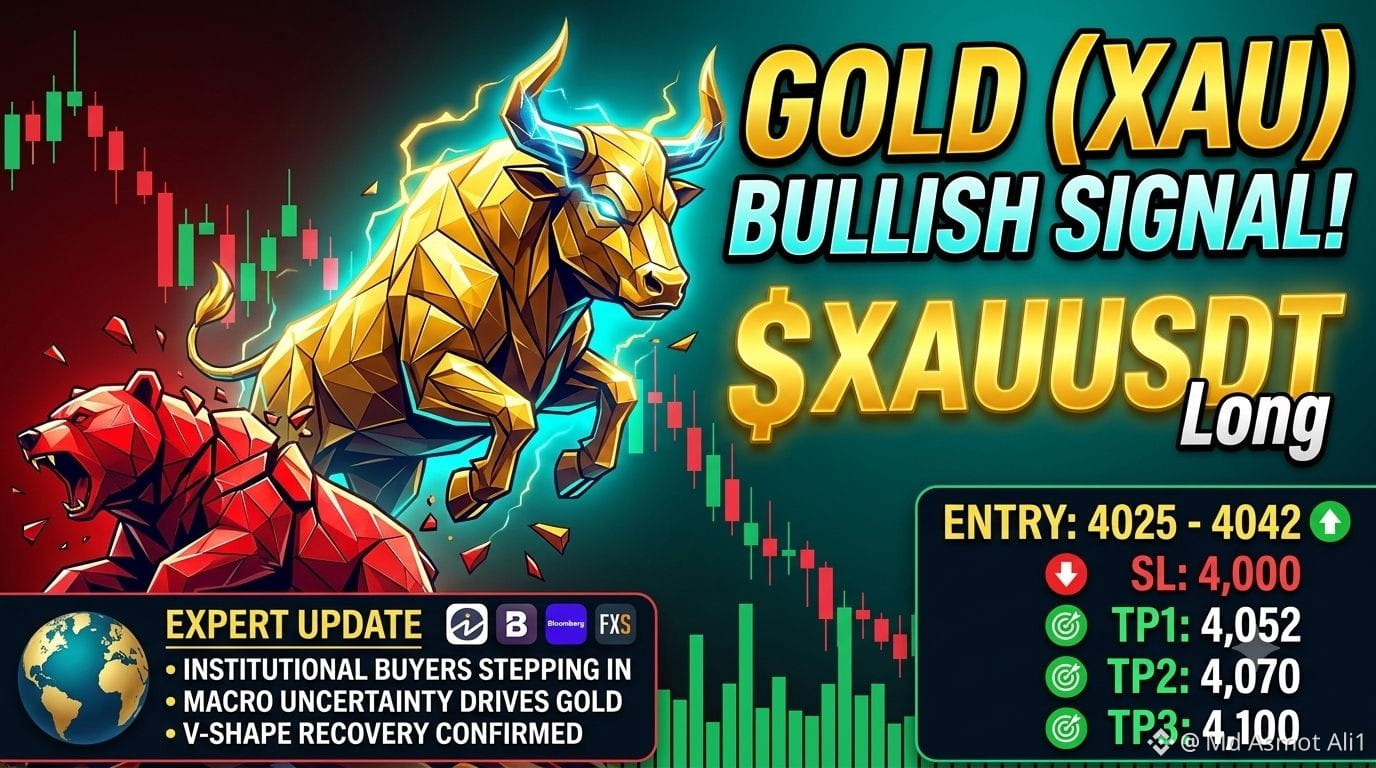
$XAU USDT – Signaux de Reprise en V Forte Inversion Haussière
Plan de Trading Long $XAU
{future}(XAUUSDT)
USDT
Entrée : 4 025 – 4 042
SL : 4 000
TP1 : 4 052
TP2 : 4 070
TP3 : 4 100
Après avoir rebondi de manière marquée sur le niveau de support 4 003, des acheteurs agressifs sont intervenus avec un volume élevé, entraînant une forte reprise en V au-dessus des moyennes mobiles clés. L’élan a clairement repris du côté des haussiers, alors que la pression vendeuse s’est dissipée rapidement, mettant en place une structure solide pour une poursuite à la hausse.
Analyse d’Expert & Sentiment de Marché
Sentiment Institutionnel : Des analystes mondiaux de grandes places comme Investing.com et FXStreet indiquent que l’Or (XAU) reste soutenu par des tensions géopolitiques persistantes et une incertitude macroéconomique, ce qui maintient les replis bien achetés.
Consensus Technique : Les stratégistes du marché soulignent que le maintien au-dessus du seuil psychologique critique de 4 000 renforce une tendance haussière à moyen terme, avec l’évolution des prix signalant des retests potentiels des niveaux de résistance locaux proches de 4 050 et au-delà.
$XAU USDT – Signaux de Reprise en V Forte Inversion Haussière
Plan de Trading Long $XAU
USDT
Entrée : 4 025 – 4 042
SL : 4 000
TP1 : 4 052
TP2 : 4 070
TP3 : 4 100
Après avoir rebondi de manière marquée sur le niveau de support 4 003, des acheteurs agressifs sont intervenus avec un volume élevé, entraînant une forte reprise en V au-dessus des moyennes mobiles clés. L’élan a clairement repris du côté des haussiers, alors que la pression vendeuse s’est dissipée rapidement, mettant en place une structure solide pour une poursuite à la hausse.
Analyse d’Expert & Sentiment de Marché
Sentiment Institutionnel : Des analystes mondiaux de grandes places comme Investing.com et FXStreet indiquent que l’Or (XAU) reste soutenu par des tensions géopolitiques persistantes et une incertitude macroéconomique, ce qui maintient les replis bien achetés.
Consensus Technique : Les stratégistes du marché soulignent que le maintien au-dessus du seuil psychologique critique de 4 000 renforce une tendance haussière à moyen terme, avec l’évolution des prix signalant des retests potentiels des niveaux de résistance locaux proches de 4 050 et au-delà.
Plan de Trading Long $XAU
USDT
Entrée : 4 025 – 4 042
SL : 4 000
TP1 : 4 052
TP2 : 4 070
TP3 : 4 100
Après avoir rebondi de manière marquée sur le niveau de support 4 003, des acheteurs agressifs sont intervenus avec un volume élevé, entraînant une forte reprise en V au-dessus des moyennes mobiles clés. L’élan a clairement repris du côté des haussiers, alors que la pression vendeuse s’est dissipée rapidement, mettant en place une structure solide pour une poursuite à la hausse.
Analyse d’Expert & Sentiment de Marché
Sentiment Institutionnel : Des analystes mondiaux de grandes places comme Investing.com et FXStreet indiquent que l’Or (XAU) reste soutenu par des tensions géopolitiques persistantes et une incertitude macroéconomique, ce qui maintient les replis bien achetés.
Consensus Technique : Les stratégistes du marché soulignent que le maintien au-dessus du seuil psychologique critique de 4 000 renforce une tendance haussière à moyen terme, avec l’évolution des prix signalant des retests potentiels des niveaux de résistance locaux proches de 4 050 et au-delà.
173
Article
$SKHY – Mèche de liquidation récupérée, reprise haussière en préparation
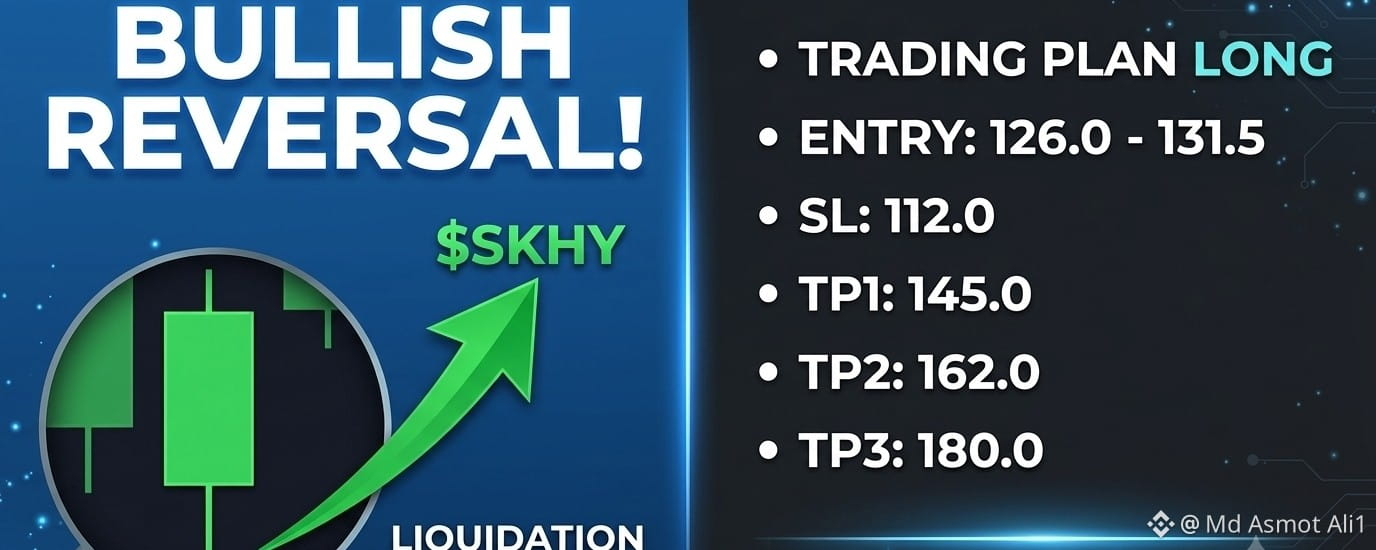
Plan de trading (Long) $SKHY * Entrée : 126.$SKHY – Mèche de liquidation récupérée, reprise haussière en préparation
Plan de trading (Long) $SKHY * Entrée : 126,0 – 131,5
SL : 112,0
TP : 145,0
TP : 162,0
TP : 180,0
Le prix a balayé la liquidité en faisant chuter jusqu’à 114 $ avec un volume massif et une forte absorption, puis a rebondi vivement. Les acheteurs sont intervenus agressivement au niveau du support, laissant une longue mèche inférieure bien visible. À mesure que la vente panique s’estompe et que le prix se consolide au-dessus de 125 $, la structure favorise un rebond haussier vers des niveaux clés à la hausse.
Ce que disent les experts du marché et des sources fiables à propos de SK Hynix ($SKHY )
$SKHY – Mèche de liquidation récupérée, reprise haussière en préparation Plan de trading (Long) $SKHY * Entrée : 126.
$SKHY – Mèche de liquidation récupérée, reprise haussière en préparation
Plan de trading (Long) $SKHY * Entrée : 126,0 – 131,5
SL : 112,0
TP : 145,0
TP : 162,0
TP : 180,0
Le prix a balayé la liquidité en faisant chuter jusqu’à 114 $ avec un volume massif et une forte absorption, puis a rebondi vivement. Les acheteurs sont intervenus agressivement au niveau du support, laissant une longue mèche inférieure bien visible. À mesure que la vente panique s’estompe et que le prix se consolide au-dessus de 125 $, la structure favorise un rebond haussier vers des niveaux clés à la hausse.
Ce que disent les experts du marché et des sources fiables à propos de SK Hynix ($SKHY )
Plan de trading (Long) $SKHY * Entrée : 126,0 – 131,5
SL : 112,0
TP : 145,0
TP : 162,0
TP : 180,0
Le prix a balayé la liquidité en faisant chuter jusqu’à 114 $ avec un volume massif et une forte absorption, puis a rebondi vivement. Les acheteurs sont intervenus agressivement au niveau du support, laissant une longue mèche inférieure bien visible. À mesure que la vente panique s’estompe et que le prix se consolide au-dessus de 125 $, la structure favorise un rebond haussier vers des niveaux clés à la hausse.
Ce que disent les experts du marché et des sources fiables à propos de SK Hynix ($SKHY )
66
·
--
Haussier
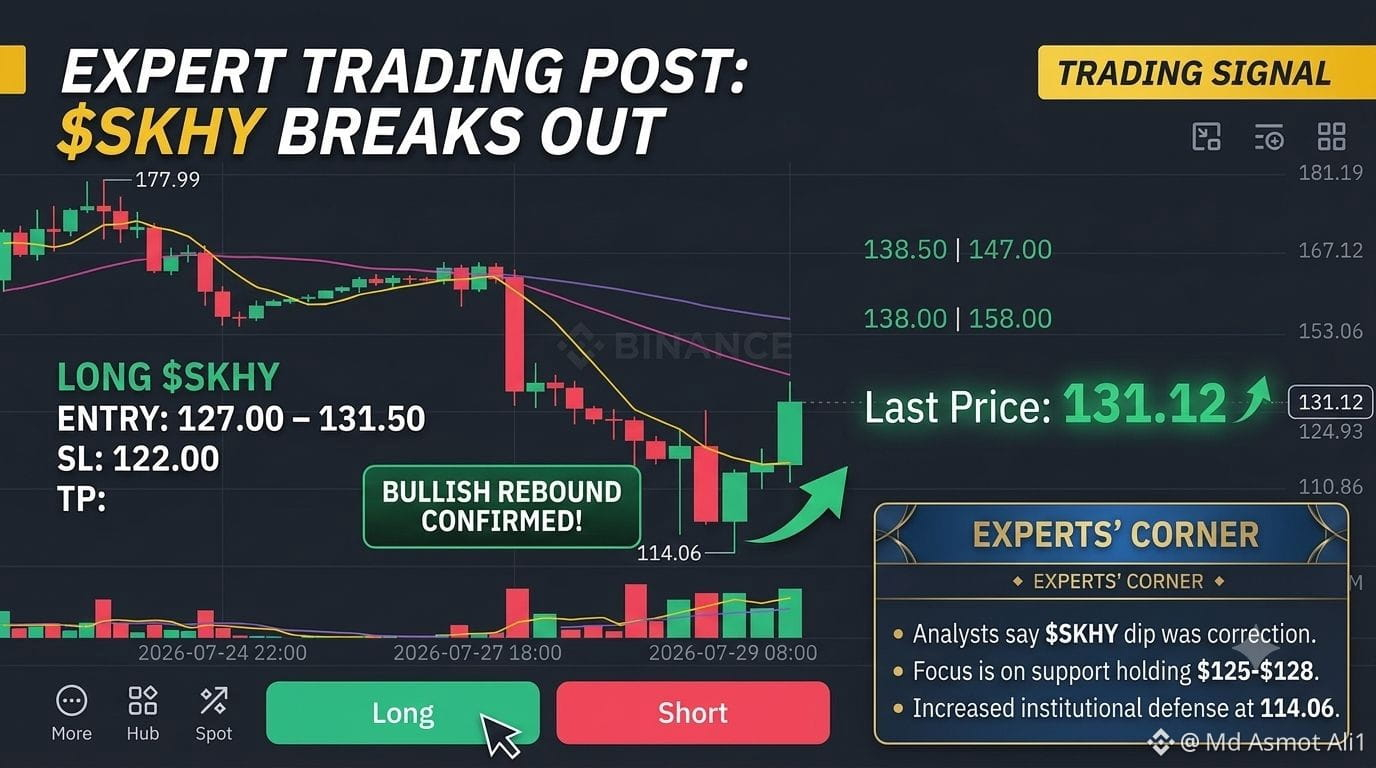
🚀 $SKHY – Rebond depuis le bas à 114 $ : un rebond de soulagement est en cours !
Plan de trading Long $SKHY
{future}(SKHYUSDT)
Entrée : 127,00 – 131,50
SL : 122,00
TP1 : 138,50
TP2 : 147,00
TP3 : 158,00
Après une forte baisse ayant atteint un plus bas sur 24 h de 114,06, le prix montre des signes d’essoufflement localisé et une puissante bougie de reprise haussière avec un volume élevé. Le prix se maintient désormais au-dessus de la ligne de la MA(7) à 129,13. Alors que la pression vendeuse se calme, un repli technique vers les moyennes mobiles majeures semble très probable.
Trade $SKHY ici 👇
💡 Points de vue d’experts sur le marché & analyses :
Sentiment du marché : des analystes de premier plan du marché des semi-conducteurs et de la tech soulignent que la baisse récente de l’ADR de SK Hynix a été principalement causée par des corrections plus larges du secteur technologique et des prises de bénéfices macro, plutôt que par un échec fondamental de l’entreprise.
Niveaux clés à surveiller : des experts du marché sur des plateformes comme Bloomberg et TradingView indiquent que le maintien au-dessus de la zone de support de 125 $ – 128 $ est crucial pour soutenir ce rebond haussier à court terme vers le niveau de résistance à 147 $.
Indicateurs de volume : l’augmentation du volume d’achat près du récent plus bas indique une défense institutionnelle, soutenant une opportunité Long à fort potentiel de gains à court/moyen terme.
🚀 $SKHY – Rebond depuis le bas à 114 $ : un rebond de soulagement est en cours !
Plan de trading Long $SKHY
Entrée : 127,00 – 131,50
SL : 122,00
TP1 : 138,50
TP2 : 147,00
TP3 : 158,00
Après une forte baisse ayant atteint un plus bas sur 24 h de 114,06, le prix montre des signes d’essoufflement localisé et une puissante bougie de reprise haussière avec un volume élevé. Le prix se maintient désormais au-dessus de la ligne de la MA(7) à 129,13. Alors que la pression vendeuse se calme, un repli technique vers les moyennes mobiles majeures semble très probable.
Trade $SKHY ici 👇
💡 Points de vue d’experts sur le marché & analyses :
Sentiment du marché : des analystes de premier plan du marché des semi-conducteurs et de la tech soulignent que la baisse récente de l’ADR de SK Hynix a été principalement causée par des corrections plus larges du secteur technologique et des prises de bénéfices macro, plutôt que par un échec fondamental de l’entreprise.
Niveaux clés à surveiller : des experts du marché sur des plateformes comme Bloomberg et TradingView indiquent que le maintien au-dessus de la zone de support de 125 $ – 128 $ est crucial pour soutenir ce rebond haussier à court terme vers le niveau de résistance à 147 $.
Indicateurs de volume : l’augmentation du volume d’achat près du récent plus bas indique une défense institutionnelle, soutenant une opportunité Long à fort potentiel de gains à court/moyen terme.
Plan de trading Long $SKHY
Entrée : 127,00 – 131,50
SL : 122,00
TP1 : 138,50
TP2 : 147,00
TP3 : 158,00
Après une forte baisse ayant atteint un plus bas sur 24 h de 114,06, le prix montre des signes d’essoufflement localisé et une puissante bougie de reprise haussière avec un volume élevé. Le prix se maintient désormais au-dessus de la ligne de la MA(7) à 129,13. Alors que la pression vendeuse se calme, un repli technique vers les moyennes mobiles majeures semble très probable.
Trade $SKHY ici 👇
💡 Points de vue d’experts sur le marché & analyses :
Sentiment du marché : des analystes de premier plan du marché des semi-conducteurs et de la tech soulignent que la baisse récente de l’ADR de SK Hynix a été principalement causée par des corrections plus larges du secteur technologique et des prises de bénéfices macro, plutôt que par un échec fondamental de l’entreprise.
Niveaux clés à surveiller : des experts du marché sur des plateformes comme Bloomberg et TradingView indiquent que le maintien au-dessus de la zone de support de 125 $ – 128 $ est crucial pour soutenir ce rebond haussier à court terme vers le niveau de résistance à 147 $.
Indicateurs de volume : l’augmentation du volume d’achat près du récent plus bas indique une défense institutionnelle, soutenant une opportunité Long à fort potentiel de gains à court/moyen terme.
73
Article
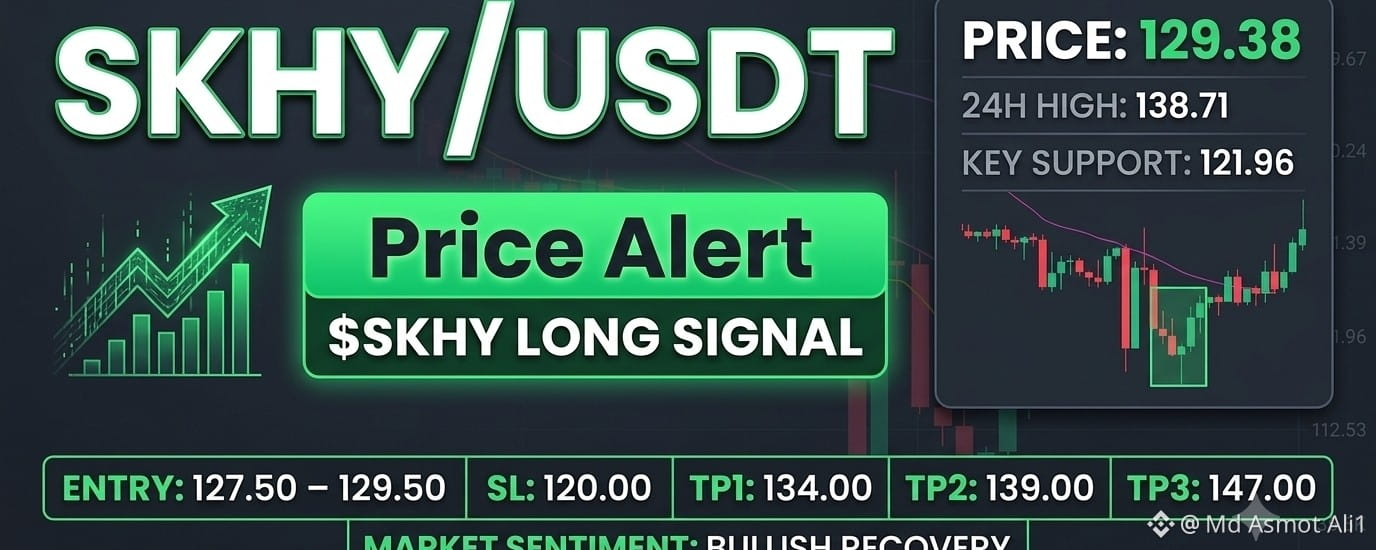
$SKHY – Rebond en formation après un balayage de liquidité, les acheteurs interviennent
Plan de trading Long $SKHY
Entrée :$SKHY – Rebond en formation après un balayage de liquidité, les acheteurs interviennent
Plan de trading Long $SKHY
Entrée : 127,50 – 129,50
SL : 120.00
TP1: 134.00
TP2: 139.00
TP3: 147.00
Le prix a balayé agressivement la liquidité vers le bas jusqu’à 114,06 $ avant de réagir avec un fort rebond haussier. Il se stabilise désormais au-dessus des moyennes mobiles à court terme (MA7 & MA25), ce qui montre une vente maîtrisée et un début de retournement de la dynamique en faveur des acheteurs. Tant que le support local tient, une continuation vers les moyennes mobiles supérieures reste privilégiée.
$SKHY – Rebond en formation après un balayage de liquidité, les acheteurs interviennent Plan de trading Long $SKHY Entrée :
$SKHY – Rebond en formation après un balayage de liquidité, les acheteurs interviennent
Plan de trading Long $SKHY
Entrée : 127,50 – 129,50
SL : 120.00
TP1: 134.00
TP2: 139.00
TP3: 147.00
Le prix a balayé agressivement la liquidité vers le bas jusqu’à 114,06 $ avant de réagir avec un fort rebond haussier. Il se stabilise désormais au-dessus des moyennes mobiles à court terme (MA7 & MA25), ce qui montre une vente maîtrisée et un début de retournement de la dynamique en faveur des acheteurs. Tant que le support local tient, une continuation vers les moyennes mobiles supérieures reste privilégiée.
Plan de trading Long $SKHY
Entrée : 127,50 – 129,50
SL : 120.00
TP1: 134.00
TP2: 139.00
TP3: 147.00
Le prix a balayé agressivement la liquidité vers le bas jusqu’à 114,06 $ avant de réagir avec un fort rebond haussier. Il se stabilise désormais au-dessus des moyennes mobiles à court terme (MA7 & MA25), ce qui montre une vente maîtrisée et un début de retournement de la dynamique en faveur des acheteurs. Tant que le support local tient, une continuation vers les moyennes mobiles supérieures reste privilégiée.
42
·
--
Haussier
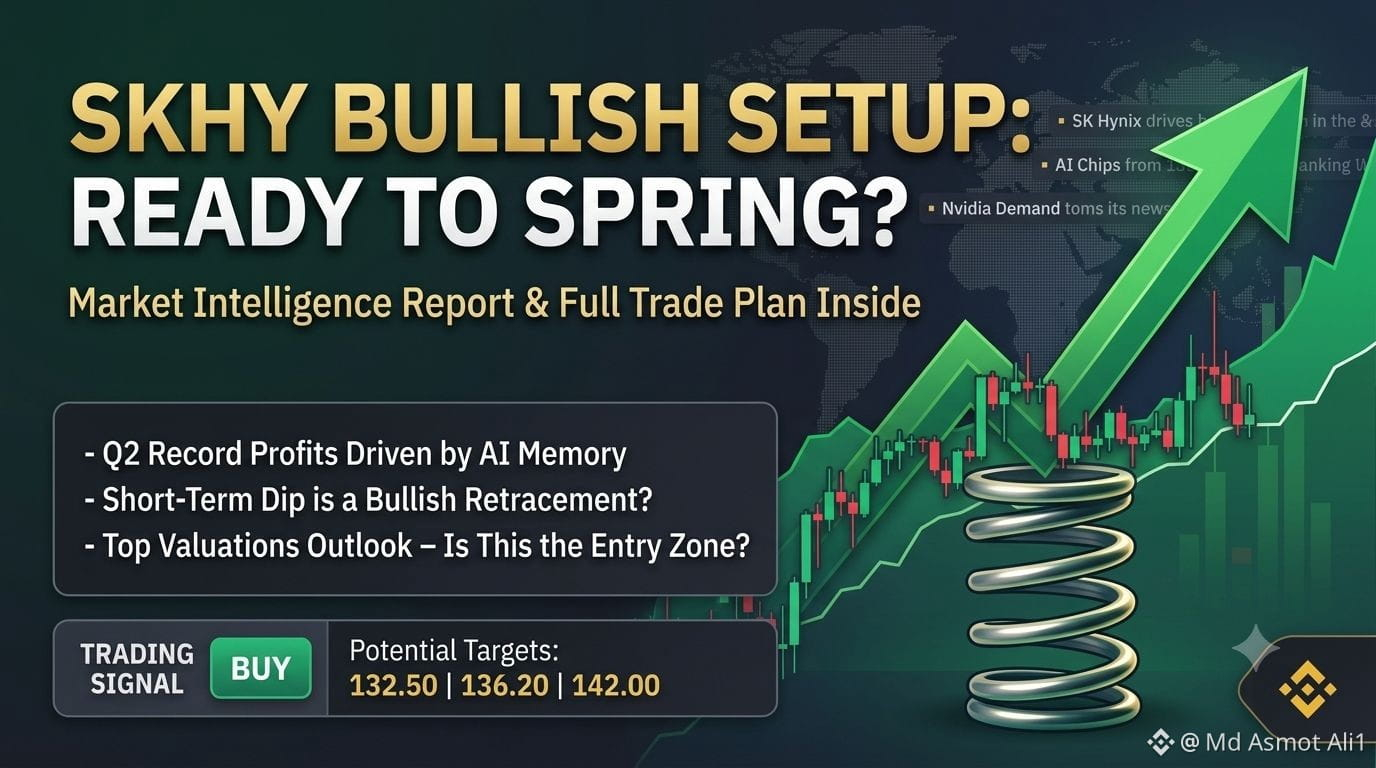
$SKHY – Le repli temporaire touche un support clé, configuration prête pour un rebond
Plan de trading : Long $SKHY
{future}(SKHYUSDT)
Entrée : 127,50 – 129,50
SL : 122,00
TP1 : 132,50
TP2 : 136,20
TP3 : 142,00
Le prix a récemment fait face à un rejet net près de la zone de résistance à 136,20, mais le repli trouve désormais une demande claire autour de la zone de support horizontale 127,50 – 129,00. Le graphique en 15 minutes montre que l’élan baissier s’essouffle, les bougies se stabilisant juste au-dessus du niveau dynamique de la MM(99). Le volume à la baisse diminue, signalant l’absence de vendeurs agressifs. Tant que cette structure tient, une poursuite haussière vers les plus hauts locaux reste très favorable.
Sentiment actuel du marché & Analyse d’experts
Ce que disent les analystes financiers & les médias :
Croissance trimestrielle & fondamentaux : Reuters et Bloomberg indiquent que SK Hynix a atteint un chiffre d’affaires et un bénéfice opérationnel records pour le T2, porté par une demande incessante pour les puces mémoire liées à l’IA et par des contrats d’approvisionnement en HBM avec des géants de la tech comme Nvidia.
Repli des résultats à court terme : D’après Quartz et Dow Jones, malgré des résultats records, l’action a subi un repli impulsif en bourse, dû à des attentes consensuelles élevées et au calendrier temporaire d’expédition des produits.
Perspectives de valorisation : Les analystes de Simply Wall St et de Morningstar soulignent que la demande fondamentale pour l’infrastructure liée à l’IA reste intacte, et que l’action ressort comme structurellement sous-évaluée après la baisse récente du cours, ce qui rend les niveaux actuels attrayants pour les acheteurs à long terme
$SKHY – Le repli temporaire touche un support clé, configuration prête pour un rebond
Plan de trading : Long $SKHY
Entrée : 127,50 – 129,50
SL : 122,00
TP1 : 132,50
TP2 : 136,20
TP3 : 142,00
Le prix a récemment fait face à un rejet net près de la zone de résistance à 136,20, mais le repli trouve désormais une demande claire autour de la zone de support horizontale 127,50 – 129,00. Le graphique en 15 minutes montre que l’élan baissier s’essouffle, les bougies se stabilisant juste au-dessus du niveau dynamique de la MM(99). Le volume à la baisse diminue, signalant l’absence de vendeurs agressifs. Tant que cette structure tient, une poursuite haussière vers les plus hauts locaux reste très favorable.
Sentiment actuel du marché & Analyse d’experts
Ce que disent les analystes financiers & les médias :
Croissance trimestrielle & fondamentaux : Reuters et Bloomberg indiquent que SK Hynix a atteint un chiffre d’affaires et un bénéfice opérationnel records pour le T2, porté par une demande incessante pour les puces mémoire liées à l’IA et par des contrats d’approvisionnement en HBM avec des géants de la tech comme Nvidia.
Repli des résultats à court terme : D’après Quartz et Dow Jones, malgré des résultats records, l’action a subi un repli impulsif en bourse, dû à des attentes consensuelles élevées et au calendrier temporaire d’expédition des produits.
Perspectives de valorisation : Les analystes de Simply Wall St et de Morningstar soulignent que la demande fondamentale pour l’infrastructure liée à l’IA reste intacte, et que l’action ressort comme structurellement sous-évaluée après la baisse récente du cours, ce qui rend les niveaux actuels attrayants pour les acheteurs à long terme
Plan de trading : Long $SKHY
Entrée : 127,50 – 129,50
SL : 122,00
TP1 : 132,50
TP2 : 136,20
TP3 : 142,00
Le prix a récemment fait face à un rejet net près de la zone de résistance à 136,20, mais le repli trouve désormais une demande claire autour de la zone de support horizontale 127,50 – 129,00. Le graphique en 15 minutes montre que l’élan baissier s’essouffle, les bougies se stabilisant juste au-dessus du niveau dynamique de la MM(99). Le volume à la baisse diminue, signalant l’absence de vendeurs agressifs. Tant que cette structure tient, une poursuite haussière vers les plus hauts locaux reste très favorable.
Sentiment actuel du marché & Analyse d’experts
Ce que disent les analystes financiers & les médias :
Croissance trimestrielle & fondamentaux : Reuters et Bloomberg indiquent que SK Hynix a atteint un chiffre d’affaires et un bénéfice opérationnel records pour le T2, porté par une demande incessante pour les puces mémoire liées à l’IA et par des contrats d’approvisionnement en HBM avec des géants de la tech comme Nvidia.
Repli des résultats à court terme : D’après Quartz et Dow Jones, malgré des résultats records, l’action a subi un repli impulsif en bourse, dû à des attentes consensuelles élevées et au calendrier temporaire d’expédition des produits.
Perspectives de valorisation : Les analystes de Simply Wall St et de Morningstar soulignent que la demande fondamentale pour l’infrastructure liée à l’IA reste intacte, et que l’action ressort comme structurellement sous-évaluée après la baisse récente du cours, ce qui rend les niveaux actuels attrayants pour les acheteurs à long terme
53
·
--
Haussier
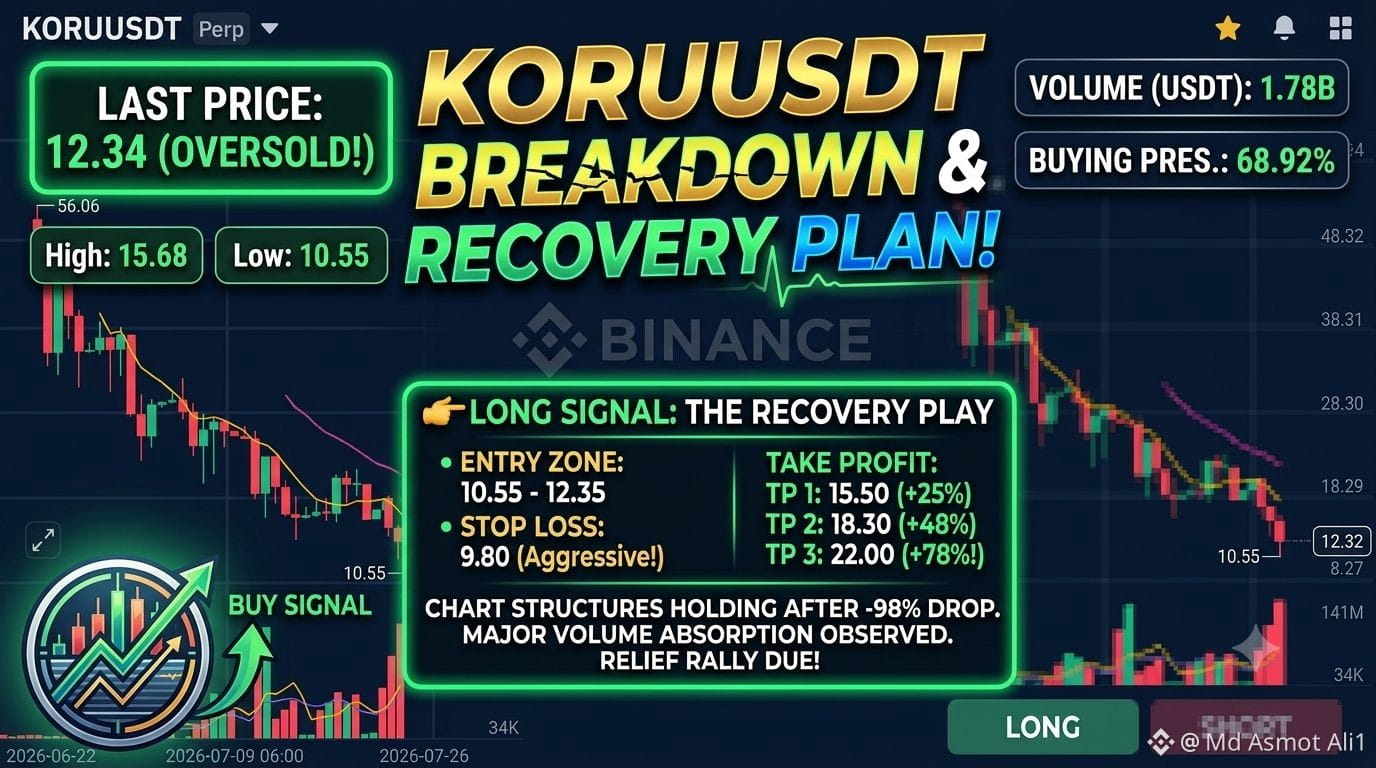
$KORU – Baisse prolongée atteignant un support clé, conditions de survente suggérant une potentielle reprise
Plan de trading : Long $KORU
{future}(KORUUSDT)
* Entrée : 10,55 – 12,35
SL : 9,80
TP1 : 15,50
TP2 : 18,30
TP3 : 22,00
Après une chute massive de son sommet à 56,06 jusqu’à 10,55, la dynamique de vente se stabilise enfin près d’un support solide. Le graphique montre un volume de ventes élevé associé à des bougies à mèche basse, indiquant que les acheteurs interviennent à ces niveaux déprimés pour absorber la liquidité. Avec des moyennes mobiles étirées, une reprise de type retour à la moyenne vers une résistance supérieure paraît de plus en plus probable.
Trade $KORU ici 👇
Analyse du marché & sentiment d’experts
Selon les analyses récentes de grandes plateformes d’intelligence crypto :
Potentiel de rebond en survente : Les analystes indiquent que $ KORU est fortement en survente sur le timeframe journalier après une baisse proche de -98 % sur 30 jours. Les indicateurs techniques suggèrent que l’épuisement des vendeurs se manifeste près de la zone des 10,50 $.
Activité de pic de volume : Les indicateurs de volume mettent en évidence un important pic de volume de trading autour des niveaux actuels. Les analystes crypto y voient un signe d’absorption institutionnelle ou de rachat de positions courtes (short-covering) avant un éventuel rebond technique.
Avertissement sur le risque : Les experts restent prudents, soulignant que bien qu’un rebond tactique/scalp soit favorable en raison d’une survente extrême, la confirmation d’un retournement de tendance à long terme nécessite que $ KORU casse et tienne au-dessus du niveau de résistance clé à 18,30 $ (MA25). Une gestion stricte du stop-loss est recommandée.
$KORU – Baisse prolongée atteignant un support clé, conditions de survente suggérant une potentielle reprise
Plan de trading : Long $KORU
* Entrée : 10,55 – 12,35
SL : 9,80
TP1 : 15,50
TP2 : 18,30
TP3 : 22,00
Après une chute massive de son sommet à 56,06 jusqu’à 10,55, la dynamique de vente se stabilise enfin près d’un support solide. Le graphique montre un volume de ventes élevé associé à des bougies à mèche basse, indiquant que les acheteurs interviennent à ces niveaux déprimés pour absorber la liquidité. Avec des moyennes mobiles étirées, une reprise de type retour à la moyenne vers une résistance supérieure paraît de plus en plus probable.
Trade $KORU ici 👇
Analyse du marché & sentiment d’experts
Selon les analyses récentes de grandes plateformes d’intelligence crypto :
Potentiel de rebond en survente : Les analystes indiquent que $ KORU est fortement en survente sur le timeframe journalier après une baisse proche de -98 % sur 30 jours. Les indicateurs techniques suggèrent que l’épuisement des vendeurs se manifeste près de la zone des 10,50 $.
Activité de pic de volume : Les indicateurs de volume mettent en évidence un important pic de volume de trading autour des niveaux actuels. Les analystes crypto y voient un signe d’absorption institutionnelle ou de rachat de positions courtes (short-covering) avant un éventuel rebond technique.
Avertissement sur le risque : Les experts restent prudents, soulignant que bien qu’un rebond tactique/scalp soit favorable en raison d’une survente extrême, la confirmation d’un retournement de tendance à long terme nécessite que $ KORU casse et tienne au-dessus du niveau de résistance clé à 18,30 $ (MA25). Une gestion stricte du stop-loss est recommandée.
Plan de trading : Long $KORU
* Entrée : 10,55 – 12,35
SL : 9,80
TP1 : 15,50
TP2 : 18,30
TP3 : 22,00
Après une chute massive de son sommet à 56,06 jusqu’à 10,55, la dynamique de vente se stabilise enfin près d’un support solide. Le graphique montre un volume de ventes élevé associé à des bougies à mèche basse, indiquant que les acheteurs interviennent à ces niveaux déprimés pour absorber la liquidité. Avec des moyennes mobiles étirées, une reprise de type retour à la moyenne vers une résistance supérieure paraît de plus en plus probable.
Trade $KORU ici 👇
Analyse du marché & sentiment d’experts
Selon les analyses récentes de grandes plateformes d’intelligence crypto :
Potentiel de rebond en survente : Les analystes indiquent que $ KORU est fortement en survente sur le timeframe journalier après une baisse proche de -98 % sur 30 jours. Les indicateurs techniques suggèrent que l’épuisement des vendeurs se manifeste près de la zone des 10,50 $.
Activité de pic de volume : Les indicateurs de volume mettent en évidence un important pic de volume de trading autour des niveaux actuels. Les analystes crypto y voient un signe d’absorption institutionnelle ou de rachat de positions courtes (short-covering) avant un éventuel rebond technique.
Avertissement sur le risque : Les experts restent prudents, soulignant que bien qu’un rebond tactique/scalp soit favorable en raison d’une survente extrême, la confirmation d’un retournement de tendance à long terme nécessite que $ KORU casse et tienne au-dessus du niveau de résistance clé à 18,30 $ (MA25). Une gestion stricte du stop-loss est recommandée.
9
·
--
Baissier
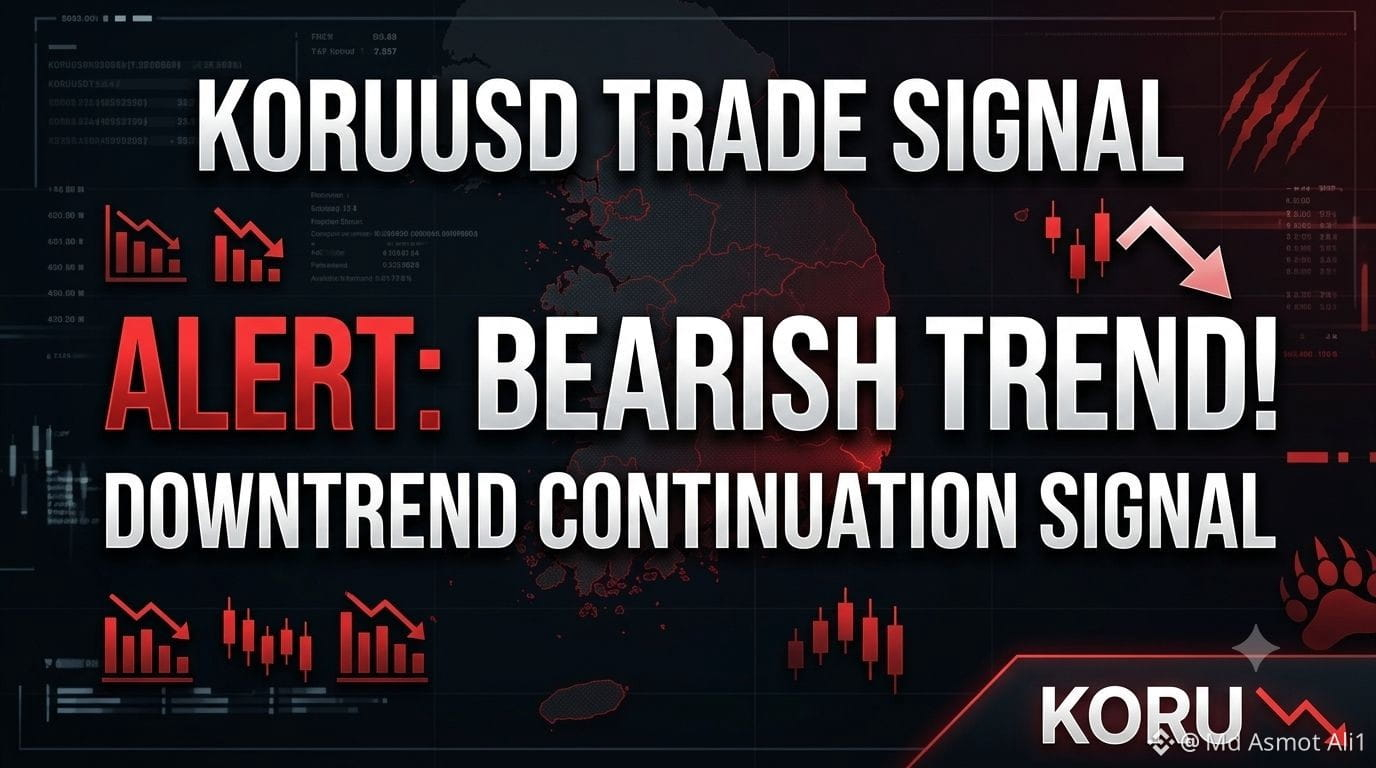
🔥 $KORU – Poursuite baissière attendue après un léger rebond de soulagement
Plan de trading Short $KORU
{future}(KORUUSDT)
Entrée : 12.50 – 13.10
SL : 14.20
TP1 : 11.20
TP2 : 10.55
TP3 : 9.50
Analyse : Le prix reste fortement enfermé dans une puissante tendance baissière sur le graphique 4H, évoluant bien en dessous des moyennes mobiles clés (MA7, MA25, MA99). Le rebond récent depuis 10.55 $ manque de fort volume acheteur et correspond à un classique “dead-cat bounce” (rebond de vendeur mort) vers une zone de résistance. Tant que le prix reste plafonné sous 13.50 $, les haussiers ne reprennent pas la main et les baissiers conservent un contrôle total pour une baisse supplémentaire.
🌐 Informations d’expert actuelles & mises à jour du marché
TradingView / Sentiment du marché : Les analystes indiquent que les produits à effet de levier qui suivent la Corée du Sud (comme KORU) subissent une pression immense suite à une forte vente mondiale des valeurs technologiques et des semi-conducteurs (y compris la volatilité des résultats de SK Hynix).
Investing.com & Analystes de marché : Les experts soulignent une volatilité implicite élevée et une pression de margin call (appel de marge) au sein des fonds régionaux fortement levier. Le sentiment du marché reste prudent, avec des risques de baisse à court terme qui persistent jusqu’à ce que les semi-conducteurs sud-coréens et les indices technologiques plus larges se stabilisent.
🔥 $KORU – Poursuite baissière attendue après un léger rebond de soulagement
Plan de trading Short $KORU
Entrée : 12.50 – 13.10
SL : 14.20
TP1 : 11.20
TP2 : 10.55
TP3 : 9.50
Analyse : Le prix reste fortement enfermé dans une puissante tendance baissière sur le graphique 4H, évoluant bien en dessous des moyennes mobiles clés (MA7, MA25, MA99). Le rebond récent depuis 10.55 $ manque de fort volume acheteur et correspond à un classique “dead-cat bounce” (rebond de vendeur mort) vers une zone de résistance. Tant que le prix reste plafonné sous 13.50 $, les haussiers ne reprennent pas la main et les baissiers conservent un contrôle total pour une baisse supplémentaire.
🌐 Informations d’expert actuelles & mises à jour du marché
TradingView / Sentiment du marché : Les analystes indiquent que les produits à effet de levier qui suivent la Corée du Sud (comme KORU) subissent une pression immense suite à une forte vente mondiale des valeurs technologiques et des semi-conducteurs (y compris la volatilité des résultats de SK Hynix).
Investing.com & Analystes de marché : Les experts soulignent une volatilité implicite élevée et une pression de margin call (appel de marge) au sein des fonds régionaux fortement levier. Le sentiment du marché reste prudent, avec des risques de baisse à court terme qui persistent jusqu’à ce que les semi-conducteurs sud-coréens et les indices technologiques plus larges se stabilisent.
Plan de trading Short $KORU
Entrée : 12.50 – 13.10
SL : 14.20
TP1 : 11.20
TP2 : 10.55
TP3 : 9.50
Analyse : Le prix reste fortement enfermé dans une puissante tendance baissière sur le graphique 4H, évoluant bien en dessous des moyennes mobiles clés (MA7, MA25, MA99). Le rebond récent depuis 10.55 $ manque de fort volume acheteur et correspond à un classique “dead-cat bounce” (rebond de vendeur mort) vers une zone de résistance. Tant que le prix reste plafonné sous 13.50 $, les haussiers ne reprennent pas la main et les baissiers conservent un contrôle total pour une baisse supplémentaire.
🌐 Informations d’expert actuelles & mises à jour du marché
TradingView / Sentiment du marché : Les analystes indiquent que les produits à effet de levier qui suivent la Corée du Sud (comme KORU) subissent une pression immense suite à une forte vente mondiale des valeurs technologiques et des semi-conducteurs (y compris la volatilité des résultats de SK Hynix).
Investing.com & Analystes de marché : Les experts soulignent une volatilité implicite élevée et une pression de margin call (appel de marge) au sein des fonds régionaux fortement levier. Le sentiment du marché reste prudent, avec des risques de baisse à court terme qui persistent jusqu’à ce que les semi-conducteurs sud-coréens et les indices technologiques plus larges se stabilisent.
247
·
--
Haussier
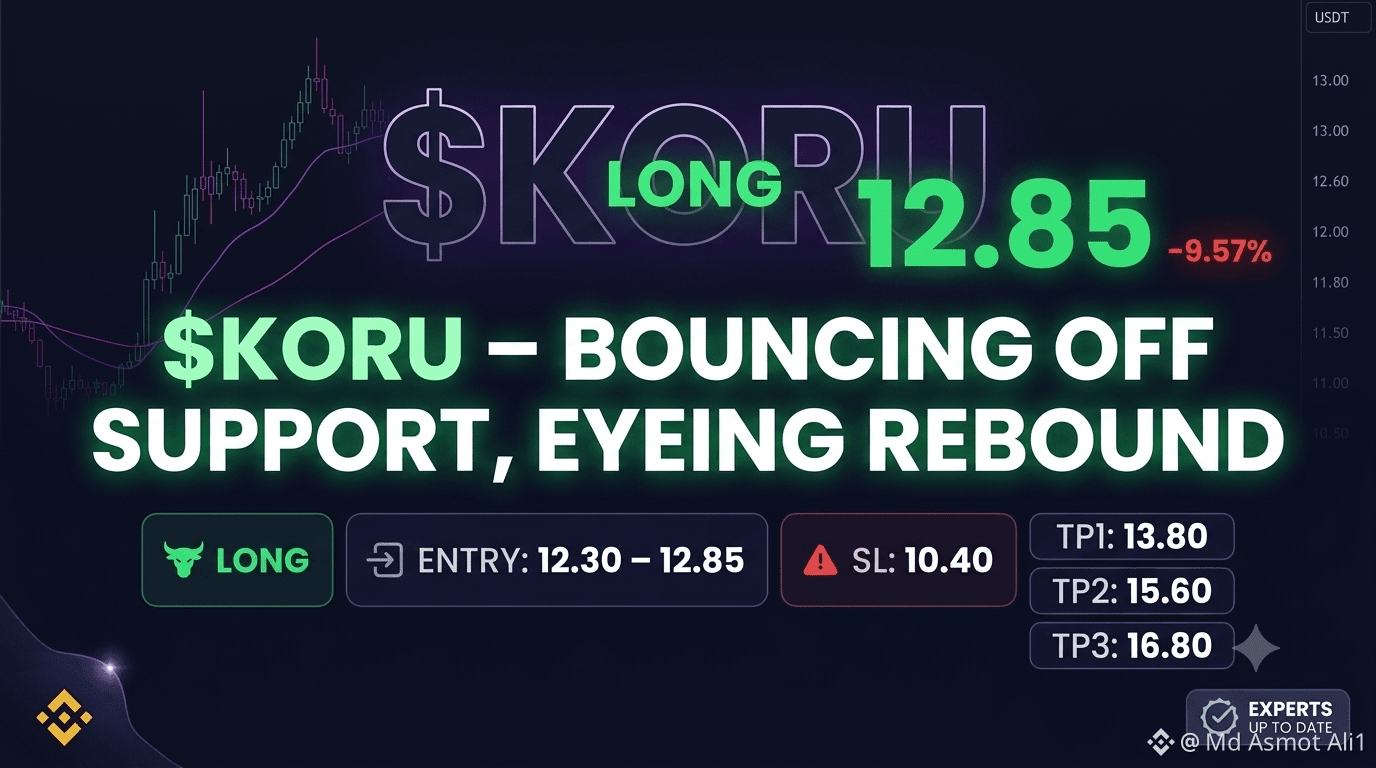
$KORU – Rebondir sur le support, viser un rebond
Plan de trading Long $KORU
{future}(KORUUSDT)
Entrée : 12,30 – 12,85
SL : 10,40
TP1 : 13,80
TP2 : 15,60
TP3 : 16,80
Le prix a testé un fort support autour de 10,55 et a commencé à former des plus bas plus élevés sur des unités de temps plus courtes. La dynamique baissière s’affaiblit clairement, montrant des signes d’absorption par les acheteurs. Tant que le support clé reste intact, un rallye de soulagement haussier vers les moyennes mobiles supérieures demeure très probable.
Trade $KORU ici 👇
Dernier marché & analyse d’experts sur KORU
Sentiment de marché : Les analystes considèrent les niveaux de prix actuels comme une zone potentielle de rebond après une situation de survente, suite à une forte correction, notant une stabilisation près du plus bas local à 10,55.
Perspective technique : Les commentateurs techniques crypto soulignent qu’une cassure au-dessus de la résistance immédiate vers 13,50–13,80 (25 MA) pourrait ouvrir la voie à une progression vers la zone 15,60–16,80.
Alerte sur le risque : Les analystes recommandent fortement une gestion stricte du risque en raison d’une volatilité élevée récente et d’une forte pression baissière observée sur l’ensemble des graphiques d’altcoins.
$KORU – Rebondir sur le support, viser un rebond
Plan de trading Long $KORU
Entrée : 12,30 – 12,85
SL : 10,40
TP1 : 13,80
TP2 : 15,60
TP3 : 16,80
Le prix a testé un fort support autour de 10,55 et a commencé à former des plus bas plus élevés sur des unités de temps plus courtes. La dynamique baissière s’affaiblit clairement, montrant des signes d’absorption par les acheteurs. Tant que le support clé reste intact, un rallye de soulagement haussier vers les moyennes mobiles supérieures demeure très probable.
Trade $KORU ici 👇
Dernier marché & analyse d’experts sur KORU
Sentiment de marché : Les analystes considèrent les niveaux de prix actuels comme une zone potentielle de rebond après une situation de survente, suite à une forte correction, notant une stabilisation près du plus bas local à 10,55.
Perspective technique : Les commentateurs techniques crypto soulignent qu’une cassure au-dessus de la résistance immédiate vers 13,50–13,80 (25 MA) pourrait ouvrir la voie à une progression vers la zone 15,60–16,80.
Alerte sur le risque : Les analystes recommandent fortement une gestion stricte du risque en raison d’une volatilité élevée récente et d’une forte pression baissière observée sur l’ensemble des graphiques d’altcoins.
Plan de trading Long $KORU
Entrée : 12,30 – 12,85
SL : 10,40
TP1 : 13,80
TP2 : 15,60
TP3 : 16,80
Le prix a testé un fort support autour de 10,55 et a commencé à former des plus bas plus élevés sur des unités de temps plus courtes. La dynamique baissière s’affaiblit clairement, montrant des signes d’absorption par les acheteurs. Tant que le support clé reste intact, un rallye de soulagement haussier vers les moyennes mobiles supérieures demeure très probable.
Trade $KORU ici 👇
Dernier marché & analyse d’experts sur KORU
Sentiment de marché : Les analystes considèrent les niveaux de prix actuels comme une zone potentielle de rebond après une situation de survente, suite à une forte correction, notant une stabilisation près du plus bas local à 10,55.
Perspective technique : Les commentateurs techniques crypto soulignent qu’une cassure au-dessus de la résistance immédiate vers 13,50–13,80 (25 MA) pourrait ouvrir la voie à une progression vers la zone 15,60–16,80.
Alerte sur le risque : Les analystes recommandent fortement une gestion stricte du risque en raison d’une volatilité élevée récente et d’une forte pression baissière observée sur l’ensemble des graphiques d’altcoins.
9
Connectez-vous pour découvrir plus de contenu
Rejoignez la communauté mondiale des adeptes de cryptomonnaies sur Binance Square
⚡️ Suviez les dernières informations importantes sur les cryptomonnaies.
💬 Jugé digne de confiance par la plus grande plateforme d’échange de cryptomonnaies au monde.
👍 Découvrez les connaissances que partagent les créateurs vérifiés.
Adresse e-mail/Nº de téléphone
Sujets d’actualité
BinanceLaunchesBinanceIntelligence
334,753 vues
2,777 mentions
#BinanceLaunchesBinanceIntelligence
La révolution de l’intelligence artificielle arrive dans le monde du trading numérique
La plateforme Binance a officiellement annoncé le lancement de son nouvel écosystème intelligent, Binance Intelligence. Cette initiative marque une avancée majeure vers l’intégration d’outils d’intelligence artificielle dans l’expérience quotidienne de trading des utilisateurs. Elle vise à combler le fossé des connaissances sur les marchés financiers et à permettre aux traders, des débutants aux professionnels, d’analyser des données et de concevoir des stratégies de trading en langage naturel, sans avoir besoin de compétences en programmation.
Les trois piliers de l’écosystème Binance Intelligence
Ce nouvel écosystème se compose de trois produits principaux conçus pour répondre à tous les besoins des utilisateurs et des développeurs :
Binance AI (gratuit pour tous) :
Rassemble les signaux dispersés du marché (graphiques, actualités, données on-chain et indicateurs économiques) dans une interface unique et centralisée.
Propose un résumé automatisé du marché (Market Brief), mis à jour toutes les 4 heures, en audio et en texte, qui couvre les cryptomonnaies et les marchés mondiaux.
Binance AI Pro (pour créer des stratégies) :
Permet à l’utilisateur de décrire une idée de trading en termes simples, que l’intelligence artificielle transforme en un organigramme visuel (Visual Flowchart).
Propose une fonctionnalité de trading simulé (Paper Trading) pour tester les stratégies avant de les mettre en œuvre avec de l’argent réel.
#BinanceLaunchesBinanceIntelligence
#BinanceSquareFamily #AI
Redouanecrypto
·8 mentions J’aime
·7.9k vues
BitcoinTargets2026OpenAt$87570
1,258 vues
56 mentions
BitcoinRejectedAt$87KThirdTime
1,476 vues
48 mentions