
asiftahsin
2.3k Publications

asiftahsin
Signaler
Bloquer l’utilisateur
Share Crypto Related Market Analysis, Share Crypto Related knowledge for my follower(brother and Sister)
32 Suivis
335 Abonnés
1.3K+ J’aime
Publications
Tous
Citations
·
--
Article
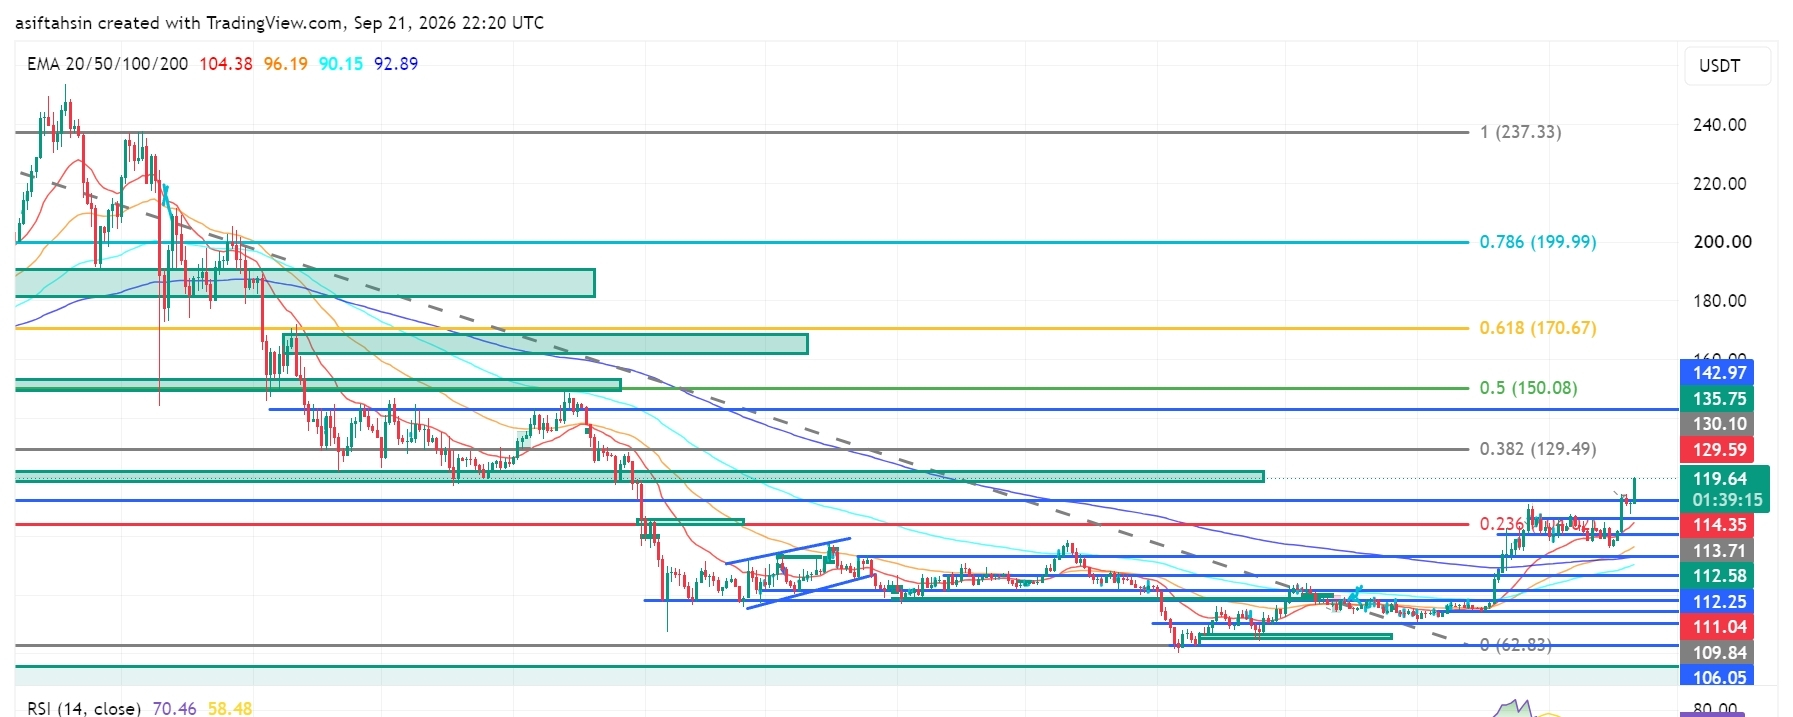
Prévision technique SOL : Solana s’approche de 120 $ à mesure que la structure de cassure se renforceSOL se négocie actuellement autour de 119,61 $, restant bien au-dessus de la zone des 112–114 $ après un fort rebond depuis la zone de support des 104–110 $.
La structure globale s’est nettement améliorée : SOL a regagné la zone des 110–114 $ et teste désormais la zone de résistance des 119–120 $. Une cassure durable au-dessus de cette zone remettrait les niveaux Fibonacci supérieurs de nouveau au premier plan.
📈 Structure des moyennes mobiles exponentielles (EMA)
20 EMA : 104,38 $
50 EMA : 96,19 $
100 EMA : 90,15 $
200 EMA : 92,89 $
SOL se négocie nettement au-dessus des quatre principales moyennes mobiles exponentielles (EMA).
Prévision technique SOL : Solana s’approche de 120 $ à mesure que la structure de cassure se renforce
SOL se négocie actuellement autour de 119,61 $, restant bien au-dessus de la zone des 112–114 $ après un fort rebond depuis la zone de support des 104–110 $.
La structure globale s’est nettement améliorée : SOL a regagné la zone des 110–114 $ et teste désormais la zone de résistance des 119–120 $. Une cassure durable au-dessus de cette zone remettrait les niveaux Fibonacci supérieurs de nouveau au premier plan.
📈 Structure des moyennes mobiles exponentielles (EMA)
20 EMA : 104,38 $
50 EMA : 96,19 $
100 EMA : 90,15 $
200 EMA : 92,89 $
SOL se négocie nettement au-dessus des quatre principales moyennes mobiles exponentielles (EMA).
La structure globale s’est nettement améliorée : SOL a regagné la zone des 110–114 $ et teste désormais la zone de résistance des 119–120 $. Une cassure durable au-dessus de cette zone remettrait les niveaux Fibonacci supérieurs de nouveau au premier plan.
📈 Structure des moyennes mobiles exponentielles (EMA)
20 EMA : 104,38 $
50 EMA : 96,19 $
100 EMA : 90,15 $
200 EMA : 92,89 $
SOL se négocie nettement au-dessus des quatre principales moyennes mobiles exponentielles (EMA).
35
·
--
Article
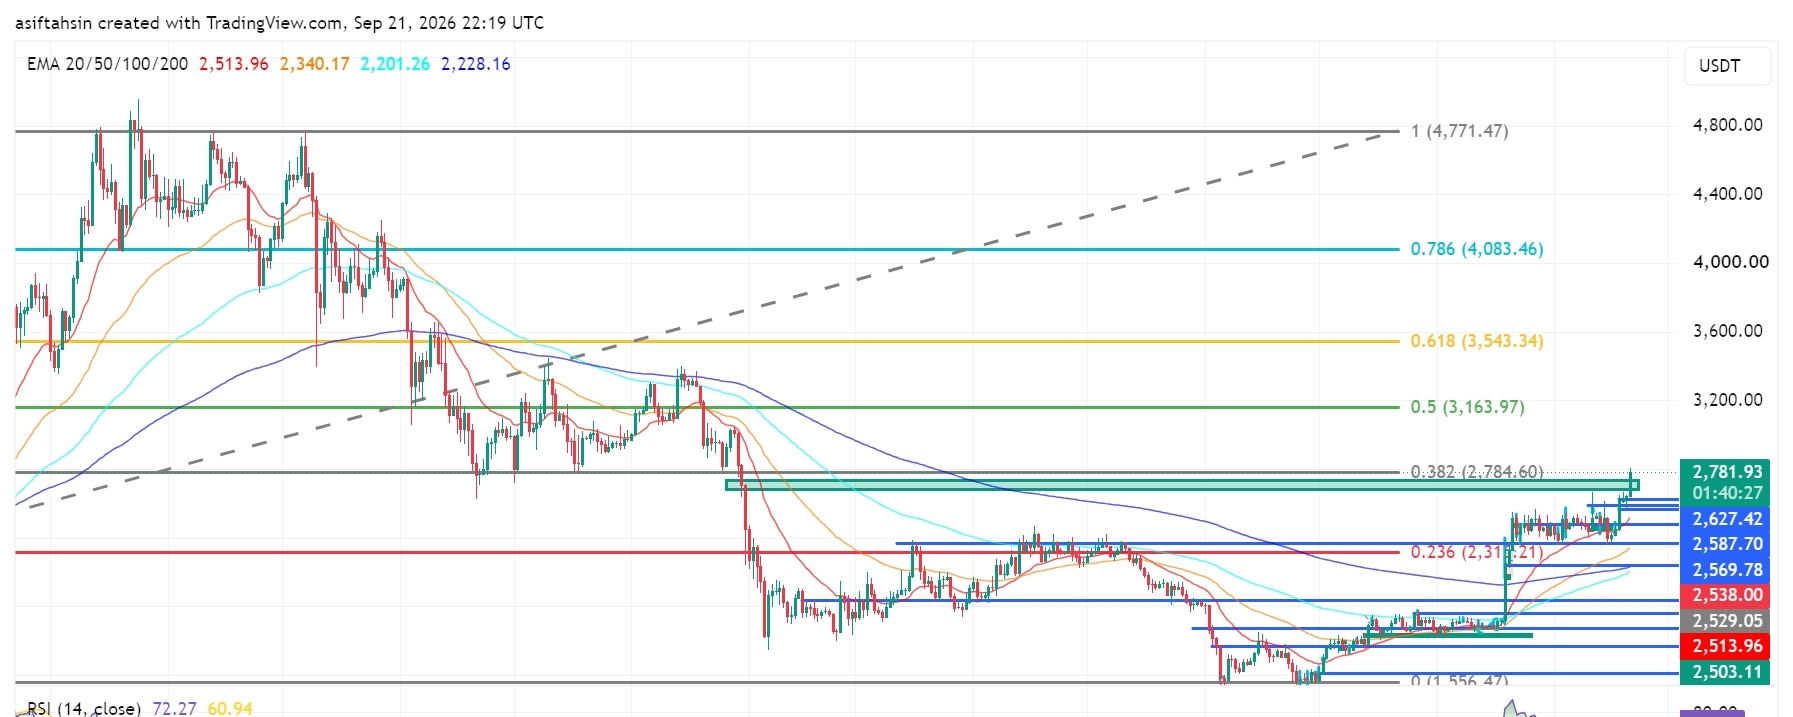
Perspectives techniques sur l’ETH : Ethereum reprend 2,78 K$ tandis que la structure de cassure se renforceL’ETH se négocie actuellement autour de $2,781.93, s’approchant de la résistance Fibonacci majeure $2,784.60 après une forte reprise depuis la zone $2,475–$2,500.
La structure globale s’est nettement améliorée : l’ETH a repris la zone des $2,500–$2,600 et a cassé l’ancienne fourchette de consolidation. Une cassure maintenue au-dessus de $2,784.60 mettrait l’attention sur les niveaux Fibonacci supérieurs.
📈 Structure des moyennes mobiles exponentielles (EMA)
EMA 20 : $2,513.96
EMA 50 : $2,340.17
EMA 100 : $2,201.26
EMA 200 : $2,228.16
L’ETH se négocie bien au-dessus des quatre principales EMA.
Perspectives techniques sur l’ETH : Ethereum reprend 2,78 K$ tandis que la structure de cassure se renforce
L’ETH se négocie actuellement autour de $2,781.93, s’approchant de la résistance Fibonacci majeure $2,784.60 après une forte reprise depuis la zone $2,475–$2,500.
La structure globale s’est nettement améliorée : l’ETH a repris la zone des $2,500–$2,600 et a cassé l’ancienne fourchette de consolidation. Une cassure maintenue au-dessus de $2,784.60 mettrait l’attention sur les niveaux Fibonacci supérieurs.
📈 Structure des moyennes mobiles exponentielles (EMA)
EMA 20 : $2,513.96
EMA 50 : $2,340.17
EMA 100 : $2,201.26
EMA 200 : $2,228.16
L’ETH se négocie bien au-dessus des quatre principales EMA.
La structure globale s’est nettement améliorée : l’ETH a repris la zone des $2,500–$2,600 et a cassé l’ancienne fourchette de consolidation. Une cassure maintenue au-dessus de $2,784.60 mettrait l’attention sur les niveaux Fibonacci supérieurs.
📈 Structure des moyennes mobiles exponentielles (EMA)
EMA 20 : $2,513.96
EMA 50 : $2,340.17
EMA 100 : $2,201.26
EMA 200 : $2,228.16
L’ETH se négocie bien au-dessus des quatre principales EMA.
58
·
--
Article
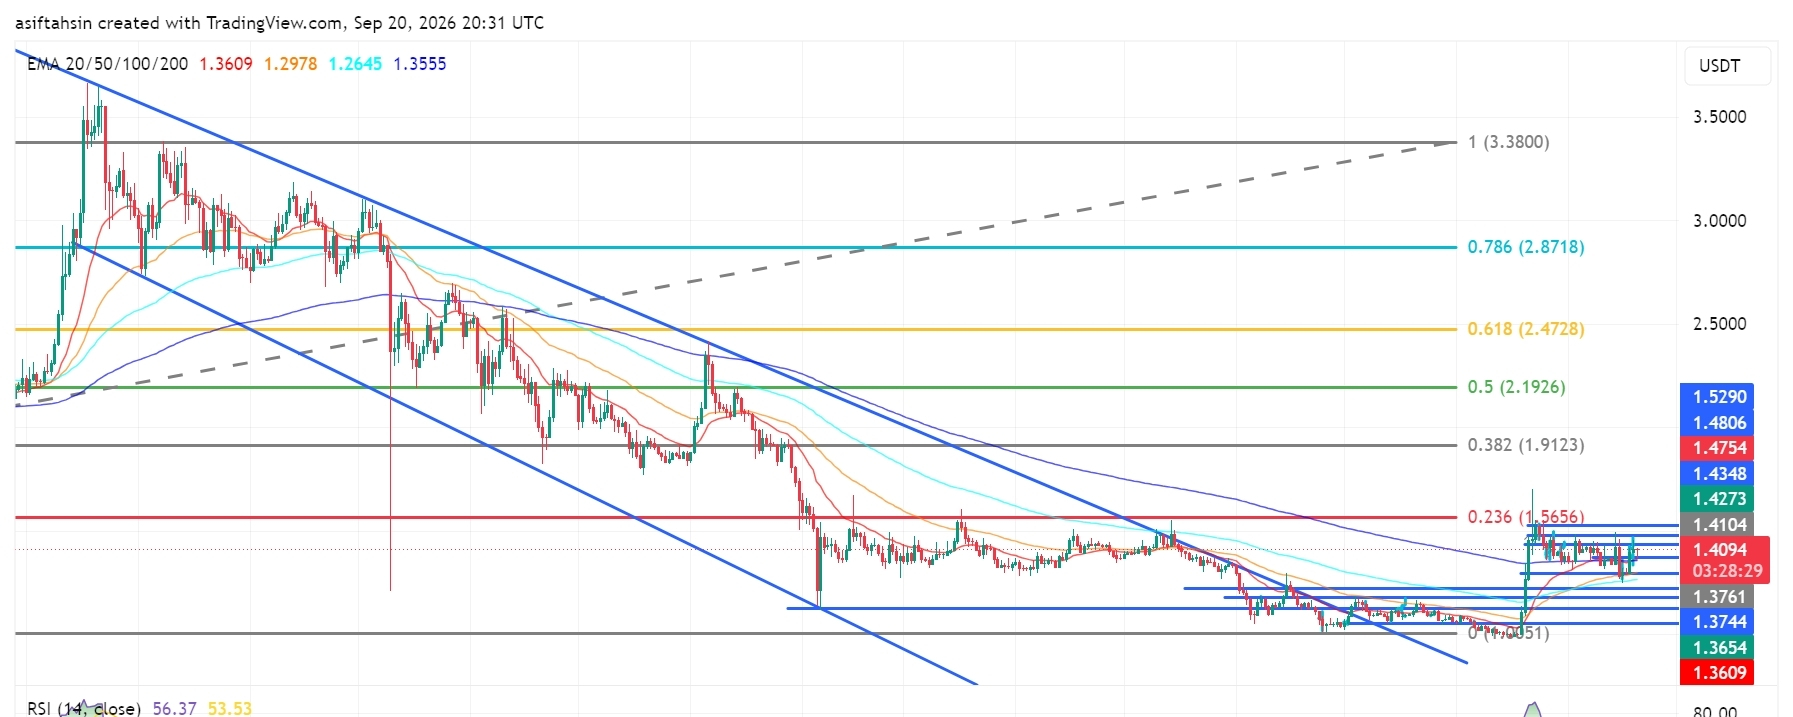
Point de vue technique sur XRP : XRP reste au-dessus de 1,40 $ alors que la structure de reprise se renforcePoint de vue technique sur XRP : XRP reste au-dessus de 1,40 $ alors que la structure de reprise se renforce
XRP s’échange actuellement autour de 1,41 $, en restant au-dessus de la zone des 1,37 $ à 1,40 $ après la récente reprise depuis la zone de support des 1,25 $ à 1,30 $.
La structure globale s’est améliorée : le prix a regagné la zone des 1,40 $ et est revenu vers la zone de résistance majeure comprise entre 1,41 $ et 1,48 $. Un mouvement durable à travers cette zone remettrait les niveaux de Fibonacci les plus élevés de nouveau au premier plan.
Des commentaires récents du marché ont également identifié la zone des 1,40 $ comme un niveau de résistance/reprise important, bien que l’élan à court terme reste sensible autour de cette zone.
Point de vue technique sur XRP : XRP reste au-dessus de 1,40 $ alors que la structure de reprise se renforce
Point de vue technique sur XRP : XRP reste au-dessus de 1,40 $ alors que la structure de reprise se renforce
XRP s’échange actuellement autour de 1,41 $, en restant au-dessus de la zone des 1,37 $ à 1,40 $ après la récente reprise depuis la zone de support des 1,25 $ à 1,30 $.
La structure globale s’est améliorée : le prix a regagné la zone des 1,40 $ et est revenu vers la zone de résistance majeure comprise entre 1,41 $ et 1,48 $. Un mouvement durable à travers cette zone remettrait les niveaux de Fibonacci les plus élevés de nouveau au premier plan.
Des commentaires récents du marché ont également identifié la zone des 1,40 $ comme un niveau de résistance/reprise important, bien que l’élan à court terme reste sensible autour de cette zone.
XRP s’échange actuellement autour de 1,41 $, en restant au-dessus de la zone des 1,37 $ à 1,40 $ après la récente reprise depuis la zone de support des 1,25 $ à 1,30 $.
La structure globale s’est améliorée : le prix a regagné la zone des 1,40 $ et est revenu vers la zone de résistance majeure comprise entre 1,41 $ et 1,48 $. Un mouvement durable à travers cette zone remettrait les niveaux de Fibonacci les plus élevés de nouveau au premier plan.
Des commentaires récents du marché ont également identifié la zone des 1,40 $ comme un niveau de résistance/reprise important, bien que l’élan à court terme reste sensible autour de cette zone.
2
1.2k
·
--
Article
Voir la traduction
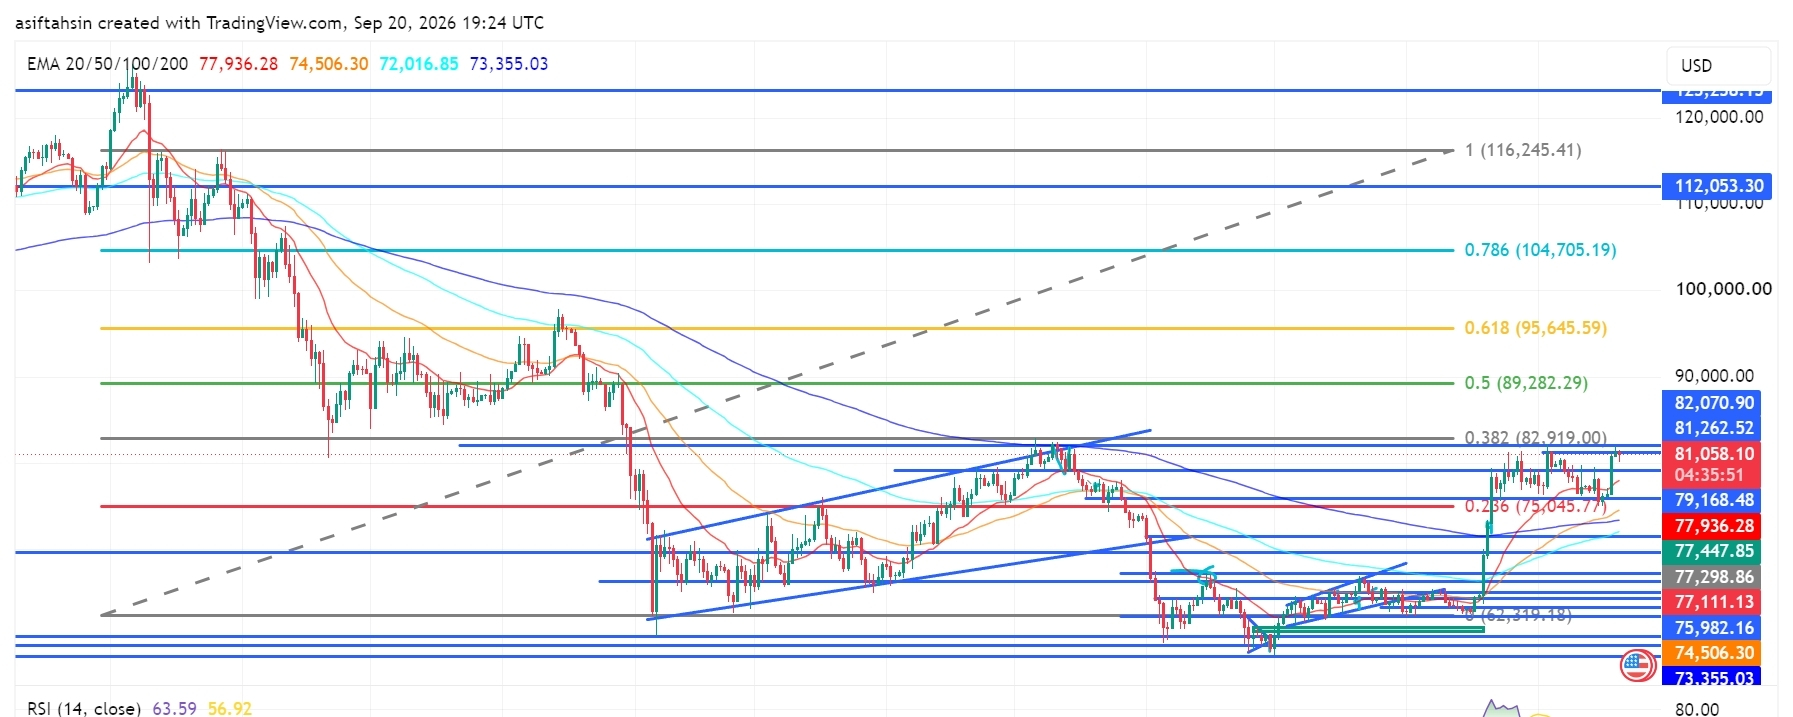
BTC Technical Outlook: Bitcoin Reclaims $81K as Recovery Structure StrengthensBTC is currently trading around $81,058, holding above the $79K–$80K region after the recent recovery from the $72K–$75K support area.
The broader structure has improved, with price reclaiming the $80K area and moving back toward the major $81.26K–$82.92K resistance zone. A sustained move through this area would put the higher Fibonacci levels back into focus.
📈 EMA Structure
20 EMA: $77,936.12
50 EMA: $74,506.24
100 EMA: $72,016.82
200 EMA: $73,355.02
BTC is currently trading well above the 20 EMA at $77,936.
The recovery above the 50 EMA at $74,506, 100 EMA at $72,016, and 200 EMA at $73,355 keeps the broader recovery structure constructive.
The 20 EMA remains above the longer-term EMA levels, showing improving short-term structure.
The $77.9K area remains an important dynamic support during any short-term pullback.
📐 Fibonacci Levels
Key Fibonacci levels:
0.236: $75,045.77
0.382: $82,919.00
0.5: $89,282.29
0.618: $95,645.59
0.786: $104,705.19
1.0: $116,245.41
BTC is currently trading above the 0.236 Fibonacci level at $75,045.77.
The next major Fibonacci reference is $82,919 — 0.382 Fib.
A sustained move above the $81K–$82.9K resistance area could bring $89,282 into focus, followed by $95,645.
🟢 Bullish Scenario
BTC has recovered strongly from the lower support structure and is now consolidating around $80K–$81K.
Immediate resistance:
$81,262.52
$82,070.90
$82,919.00 — 0.382 Fibonacci
$89,282.29 — 0.5 Fibonacci
$95,645.59 — 0.618 Fibonacci
A clean breakout and sustained close above $82K–$82.92K would provide stronger confirmation of continued recovery.
🎯 Target 1: $82,070.90
🎯 Target 2: $82,919.00 — 0.382 Fibonacci
🎯 Target 3: $89,282.29 — 0.5 Fibonacci
🎯 Target 4: $95,645.59 — 0.618 Fibonacci
🎯 Target 5: $104,705.19 — 0.786 Fibonacci
🎯 Target 6: $112,053.30
🎯 Target 7: $116,245.41 — 1.0 Fibonacci
A confirmed move through the $82.92K zone could strengthen the medium-term recovery structure and bring the $89K–$95K region into focus.
🔴 Pullback Scenario
After the recent expansion from the $75K region toward $81K, a retest of the breakout area would be normal.
Key supports:
$79,168.48
$77,936.12 — 20 EMA
$77,447.85
$77,298.86
$77,111.13
$75,982.16
$75,045.77 — 0.236 Fibonacci
$74,506.24 — 50 EMA
$73,355.02 — 200 EMA
$72,016.82 — 100 EMA
The $77K–$79K zone is particularly important.
If BTC continues to hold this area during a pullback, the current recovery structure remains active.
A sustained loss of $75,045 would weaken the current structure and bring the lower EMA support region back into focus.
🧠 Market Structure & Liquidity
BTC has formed a recovery structure after sweeping liquidity around the $72K–$75K region.
The recent move produced a strong recovery through $75K, followed by a breakout toward $80K–$81K.
BTC is now moving through an important:
Liquidity Sweep → Accumulation → Higher Lows → Breakout → Expansion → Retest → Consolidation → Continuation
structure.
The major upside liquidity and resistance are concentrated around the $81.26K–$82.92K region.
A decisive move through this area would place $89,282 as the next major Fibonacci reference.
📊 RSI Momentum
RSI (14): 63.59
RSI MA: 56.92
RSI has moved above the neutral 50 level and remains firmly in positive territory after the recent expansion.
The current reading around 63.59 shows stronger short-term momentum while remaining below the traditional 70 overbought threshold.
A sustained RSI above 60 would keep momentum supportive, while a move back below 50 would indicate increasing short-term weakness.
🎯 Key Levels
🔴 Major Resistance:
$81,262.52 → $82,070.90 → $82,919.00 → $89,282.29 → $95,645.59
🟢 Major Support:
$79,168.48 → $77,936.12 → $77,447.85 → $77,298.86 → $77,111.13 → $75,982.16 → $75,045.77
📉 Dynamic EMA Support:
$77,936.12 — 20 EMA | $74,506.24 — 50 EMA | $73,355.02 — 200 EMA | $72,016.82 — 100 EMA
🚀 Upside References:
$82,919 → $89,282 → $95,645 → $104,705 → $112,053 → $116,245
📌 Final Outlook
BTC's broader structure has strengthened after the recent recovery, with price now holding around $81K and above the major $75K–$79K support structure.
The $77K–$79K area is now an important short-term support region, while $81.26K–$82.92K remains the immediate major resistance zone.
A confirmed move above $82,919 could open the path toward $89,282, followed by $95,645 and $104,705.
However, rejection from the upper resistance area followed by a sustained loss of $75,045 would weaken the current recovery structure and bring the lower support zones back into focus.
Bias: 🟢 Recovery structure intact above $75,045. A sustained move above $82,919 could open the path toward $89,282, with $95,645 as the next major Fibonacci reference.
$BTC
{future}(BTCUSDT)
BTC Technical Outlook: Bitcoin Reclaims $81K as Recovery Structure Strengthens
BTC is currently trading around $81,058, holding above the $79K–$80K region after the recent recovery from the $72K–$75K support area.
The broader structure has improved, with price reclaiming the $80K area and moving back toward the major $81.26K–$82.92K resistance zone. A sustained move through this area would put the higher Fibonacci levels back into focus.
📈 EMA Structure
20 EMA: $77,936.12
50 EMA: $74,506.24
100 EMA: $72,016.82
200 EMA: $73,355.02
BTC is currently trading well above the 20 EMA at $77,936.
The recovery above the 50 EMA at $74,506, 100 EMA at $72,016, and 200 EMA at $73,355 keeps the broader recovery structure constructive.
The 20 EMA remains above the longer-term EMA levels, showing improving short-term structure.
The $77.9K area remains an important dynamic support during any short-term pullback.
📐 Fibonacci Levels
Key Fibonacci levels:
0.236: $75,045.77
0.382: $82,919.00
0.5: $89,282.29
0.618: $95,645.59
0.786: $104,705.19
1.0: $116,245.41
BTC is currently trading above the 0.236 Fibonacci level at $75,045.77.
The next major Fibonacci reference is $82,919 — 0.382 Fib.
A sustained move above the $81K–$82.9K resistance area could bring $89,282 into focus, followed by $95,645.
🟢 Bullish Scenario
BTC has recovered strongly from the lower support structure and is now consolidating around $80K–$81K.
Immediate resistance:
$81,262.52
$82,070.90
$82,919.00 — 0.382 Fibonacci
$89,282.29 — 0.5 Fibonacci
$95,645.59 — 0.618 Fibonacci
A clean breakout and sustained close above $82K–$82.92K would provide stronger confirmation of continued recovery.
🎯 Target 1: $82,070.90
🎯 Target 2: $82,919.00 — 0.382 Fibonacci
🎯 Target 3: $89,282.29 — 0.5 Fibonacci
🎯 Target 4: $95,645.59 — 0.618 Fibonacci
🎯 Target 5: $104,705.19 — 0.786 Fibonacci
🎯 Target 6: $112,053.30
🎯 Target 7: $116,245.41 — 1.0 Fibonacci
A confirmed move through the $82.92K zone could strengthen the medium-term recovery structure and bring the $89K–$95K region into focus.
🔴 Pullback Scenario
After the recent expansion from the $75K region toward $81K, a retest of the breakout area would be normal.
Key supports:
$79,168.48
$77,936.12 — 20 EMA
$77,447.85
$77,298.86
$77,111.13
$75,982.16
$75,045.77 — 0.236 Fibonacci
$74,506.24 — 50 EMA
$73,355.02 — 200 EMA
$72,016.82 — 100 EMA
The $77K–$79K zone is particularly important.
If BTC continues to hold this area during a pullback, the current recovery structure remains active.
A sustained loss of $75,045 would weaken the current structure and bring the lower EMA support region back into focus.
🧠 Market Structure & Liquidity
BTC has formed a recovery structure after sweeping liquidity around the $72K–$75K region.
The recent move produced a strong recovery through $75K, followed by a breakout toward $80K–$81K.
BTC is now moving through an important:
Liquidity Sweep → Accumulation → Higher Lows → Breakout → Expansion → Retest → Consolidation → Continuation
structure.
The major upside liquidity and resistance are concentrated around the $81.26K–$82.92K region.
A decisive move through this area would place $89,282 as the next major Fibonacci reference.
📊 RSI Momentum
RSI (14): 63.59
RSI MA: 56.92
RSI has moved above the neutral 50 level and remains firmly in positive territory after the recent expansion.
The current reading around 63.59 shows stronger short-term momentum while remaining below the traditional 70 overbought threshold.
A sustained RSI above 60 would keep momentum supportive, while a move back below 50 would indicate increasing short-term weakness.
🎯 Key Levels
🔴 Major Resistance:
$81,262.52 → $82,070.90 → $82,919.00 → $89,282.29 → $95,645.59
🟢 Major Support:
$79,168.48 → $77,936.12 → $77,447.85 → $77,298.86 → $77,111.13 → $75,982.16 → $75,045.77
📉 Dynamic EMA Support:
$77,936.12 — 20 EMA | $74,506.24 — 50 EMA | $73,355.02 — 200 EMA | $72,016.82 — 100 EMA
🚀 Upside References:
$82,919 → $89,282 → $95,645 → $104,705 → $112,053 → $116,245
📌 Final Outlook
BTC's broader structure has strengthened after the recent recovery, with price now holding around $81K and above the major $75K–$79K support structure.
The $77K–$79K area is now an important short-term support region, while $81.26K–$82.92K remains the immediate major resistance zone.
A confirmed move above $82,919 could open the path toward $89,282, followed by $95,645 and $104,705.
However, rejection from the upper resistance area followed by a sustained loss of $75,045 would weaken the current recovery structure and bring the lower support zones back into focus.
Bias: 🟢 Recovery structure intact above $75,045. A sustained move above $82,919 could open the path toward $89,282, with $95,645 as the next major Fibonacci reference.
$BTC
The broader structure has improved, with price reclaiming the $80K area and moving back toward the major $81.26K–$82.92K resistance zone. A sustained move through this area would put the higher Fibonacci levels back into focus.
📈 EMA Structure
20 EMA: $77,936.12
50 EMA: $74,506.24
100 EMA: $72,016.82
200 EMA: $73,355.02
BTC is currently trading well above the 20 EMA at $77,936.
The recovery above the 50 EMA at $74,506, 100 EMA at $72,016, and 200 EMA at $73,355 keeps the broader recovery structure constructive.
The 20 EMA remains above the longer-term EMA levels, showing improving short-term structure.
The $77.9K area remains an important dynamic support during any short-term pullback.
📐 Fibonacci Levels
Key Fibonacci levels:
0.236: $75,045.77
0.382: $82,919.00
0.5: $89,282.29
0.618: $95,645.59
0.786: $104,705.19
1.0: $116,245.41
BTC is currently trading above the 0.236 Fibonacci level at $75,045.77.
The next major Fibonacci reference is $82,919 — 0.382 Fib.
A sustained move above the $81K–$82.9K resistance area could bring $89,282 into focus, followed by $95,645.
🟢 Bullish Scenario
BTC has recovered strongly from the lower support structure and is now consolidating around $80K–$81K.
Immediate resistance:
$81,262.52
$82,070.90
$82,919.00 — 0.382 Fibonacci
$89,282.29 — 0.5 Fibonacci
$95,645.59 — 0.618 Fibonacci
A clean breakout and sustained close above $82K–$82.92K would provide stronger confirmation of continued recovery.
🎯 Target 1: $82,070.90
🎯 Target 2: $82,919.00 — 0.382 Fibonacci
🎯 Target 3: $89,282.29 — 0.5 Fibonacci
🎯 Target 4: $95,645.59 — 0.618 Fibonacci
🎯 Target 5: $104,705.19 — 0.786 Fibonacci
🎯 Target 6: $112,053.30
🎯 Target 7: $116,245.41 — 1.0 Fibonacci
A confirmed move through the $82.92K zone could strengthen the medium-term recovery structure and bring the $89K–$95K region into focus.
🔴 Pullback Scenario
After the recent expansion from the $75K region toward $81K, a retest of the breakout area would be normal.
Key supports:
$79,168.48
$77,936.12 — 20 EMA
$77,447.85
$77,298.86
$77,111.13
$75,982.16
$75,045.77 — 0.236 Fibonacci
$74,506.24 — 50 EMA
$73,355.02 — 200 EMA
$72,016.82 — 100 EMA
The $77K–$79K zone is particularly important.
If BTC continues to hold this area during a pullback, the current recovery structure remains active.
A sustained loss of $75,045 would weaken the current structure and bring the lower EMA support region back into focus.
🧠 Market Structure & Liquidity
BTC has formed a recovery structure after sweeping liquidity around the $72K–$75K region.
The recent move produced a strong recovery through $75K, followed by a breakout toward $80K–$81K.
BTC is now moving through an important:
Liquidity Sweep → Accumulation → Higher Lows → Breakout → Expansion → Retest → Consolidation → Continuation
structure.
The major upside liquidity and resistance are concentrated around the $81.26K–$82.92K region.
A decisive move through this area would place $89,282 as the next major Fibonacci reference.
📊 RSI Momentum
RSI (14): 63.59
RSI MA: 56.92
RSI has moved above the neutral 50 level and remains firmly in positive territory after the recent expansion.
The current reading around 63.59 shows stronger short-term momentum while remaining below the traditional 70 overbought threshold.
A sustained RSI above 60 would keep momentum supportive, while a move back below 50 would indicate increasing short-term weakness.
🎯 Key Levels
🔴 Major Resistance:
$81,262.52 → $82,070.90 → $82,919.00 → $89,282.29 → $95,645.59
🟢 Major Support:
$79,168.48 → $77,936.12 → $77,447.85 → $77,298.86 → $77,111.13 → $75,982.16 → $75,045.77
📉 Dynamic EMA Support:
$77,936.12 — 20 EMA | $74,506.24 — 50 EMA | $73,355.02 — 200 EMA | $72,016.82 — 100 EMA
🚀 Upside References:
$82,919 → $89,282 → $95,645 → $104,705 → $112,053 → $116,245
📌 Final Outlook
BTC's broader structure has strengthened after the recent recovery, with price now holding around $81K and above the major $75K–$79K support structure.
The $77K–$79K area is now an important short-term support region, while $81.26K–$82.92K remains the immediate major resistance zone.
A confirmed move above $82,919 could open the path toward $89,282, followed by $95,645 and $104,705.
However, rejection from the upper resistance area followed by a sustained loss of $75,045 would weaken the current recovery structure and bring the lower support zones back into focus.
Bias: 🟢 Recovery structure intact above $75,045. A sustained move above $82,919 could open the path toward $89,282, with $95,645 as the next major Fibonacci reference.
$BTC
43
·
--
Article
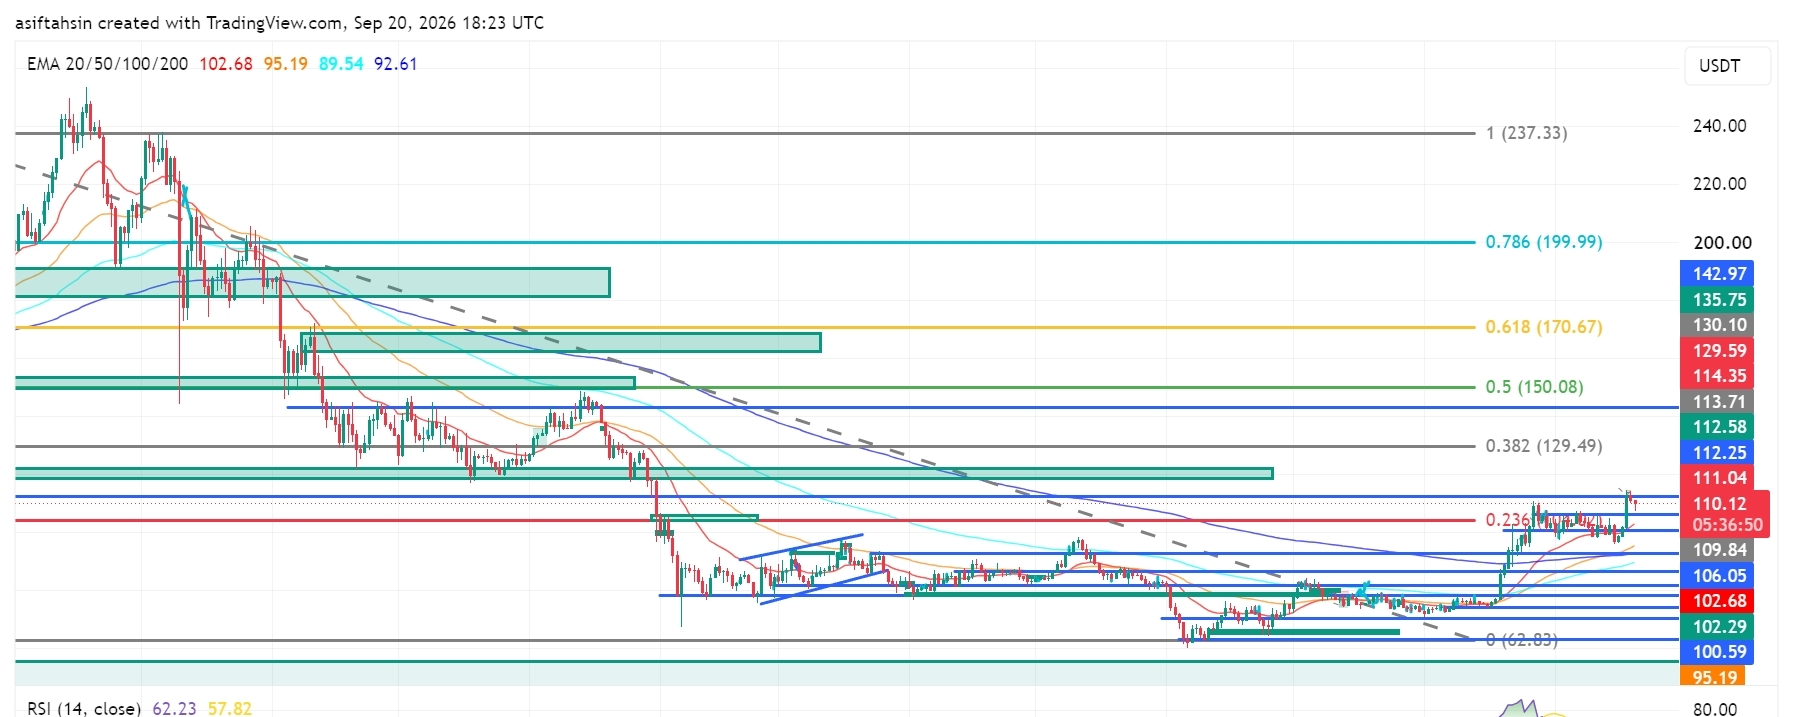
Perspectives techniques de SOL : Solana reprend 110 $ alors que la structure de reprise se renforceSOL se négocie actuellement autour de 110,1 $, en restant au-dessus de la zone 106–109 $ après la récente reprise depuis la zone de support 92–100 $.
La structure globale s’est améliorée : le prix a repris la zone des 100 $ et revient vers la zone de résistance majeure des 111–114 $. Un mouvement durable au-dessus de cette zone remettrait les niveaux Fibonacci supérieurs au premier plan.
📈 Structure des moyennes mobiles
Moyenne mobile 20 : 102,68 $
Moyenne mobile 50 : 95,19 $
Moyenne mobile 100 : 89,54 $
Moyenne mobile 200 : 92,61 $
SOL se négocie actuellement bien au-dessus de la moyenne mobile 20 à 102,68 $.
La reprise au-dessus de la moyenne mobile 50 à 95,19 $, de la moyenne mobile 100 à 89,54 $ et de la moyenne mobile 200 à 92,61 $ maintient une structure de reprise plus large constructive.
Perspectives techniques de SOL : Solana reprend 110 $ alors que la structure de reprise se renforce
SOL se négocie actuellement autour de 110,1 $, en restant au-dessus de la zone 106–109 $ après la récente reprise depuis la zone de support 92–100 $.
La structure globale s’est améliorée : le prix a repris la zone des 100 $ et revient vers la zone de résistance majeure des 111–114 $. Un mouvement durable au-dessus de cette zone remettrait les niveaux Fibonacci supérieurs au premier plan.
📈 Structure des moyennes mobiles
Moyenne mobile 20 : 102,68 $
Moyenne mobile 50 : 95,19 $
Moyenne mobile 100 : 89,54 $
Moyenne mobile 200 : 92,61 $
SOL se négocie actuellement bien au-dessus de la moyenne mobile 20 à 102,68 $.
La reprise au-dessus de la moyenne mobile 50 à 95,19 $, de la moyenne mobile 100 à 89,54 $ et de la moyenne mobile 200 à 92,61 $ maintient une structure de reprise plus large constructive.
La structure globale s’est améliorée : le prix a repris la zone des 100 $ et revient vers la zone de résistance majeure des 111–114 $. Un mouvement durable au-dessus de cette zone remettrait les niveaux Fibonacci supérieurs au premier plan.
📈 Structure des moyennes mobiles
Moyenne mobile 20 : 102,68 $
Moyenne mobile 50 : 95,19 $
Moyenne mobile 100 : 89,54 $
Moyenne mobile 200 : 92,61 $
SOL se négocie actuellement bien au-dessus de la moyenne mobile 20 à 102,68 $.
La reprise au-dessus de la moyenne mobile 50 à 95,19 $, de la moyenne mobile 100 à 89,54 $ et de la moyenne mobile 200 à 92,61 $ maintient une structure de reprise plus large constructive.
1.1k
·
--
Article
Voir la traduction
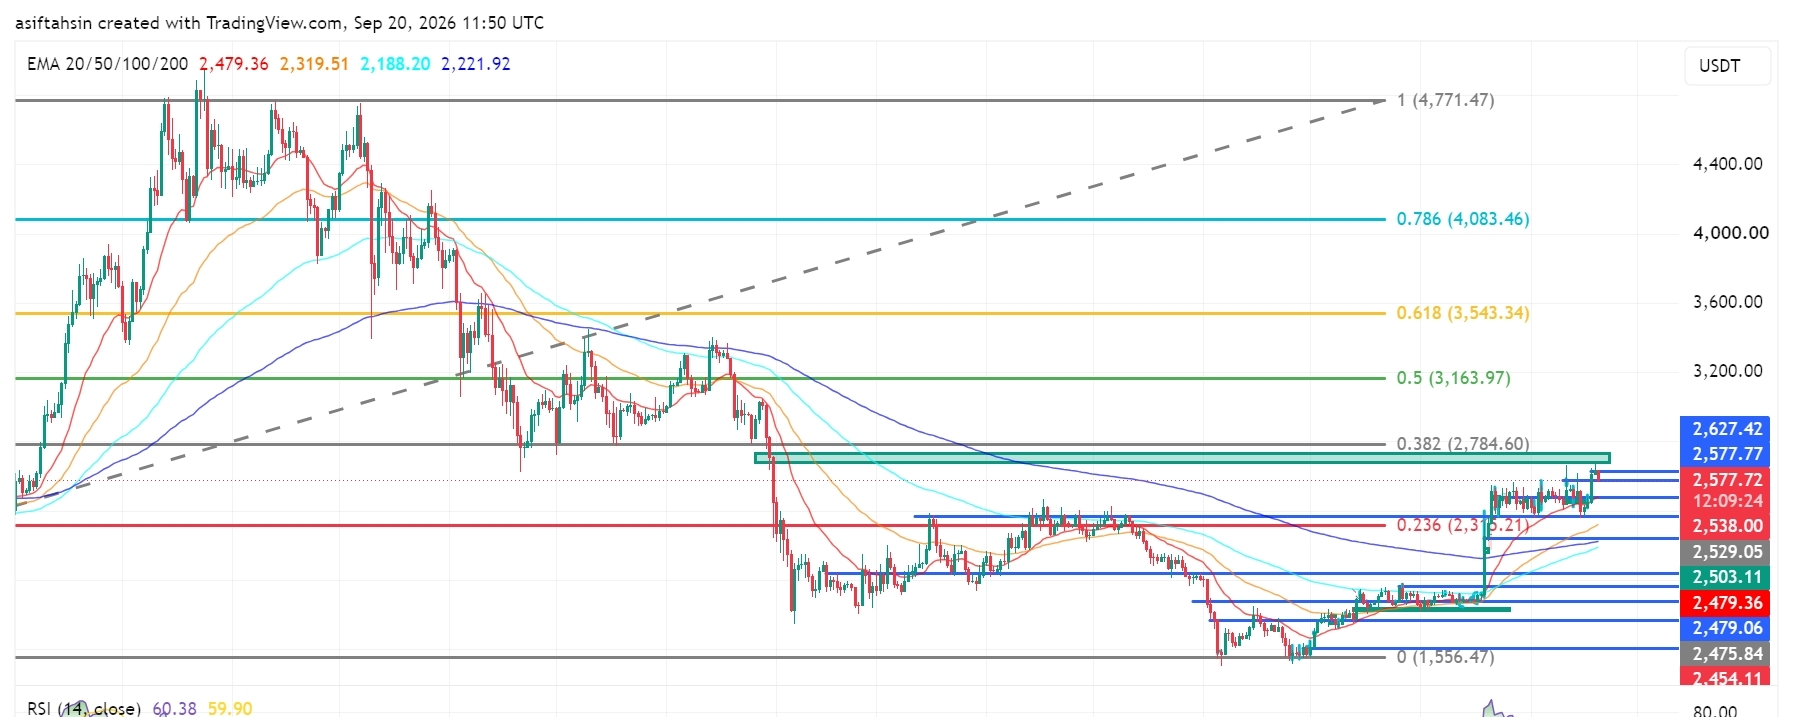
ETH Technical Outlook: Ethereum Holds Near $2.58K as Recovery ContinuesETH is currently trading around $2,577, holding above the $2,500–$2,540 support area after the recent recovery from the $2,280–$2,360 demand zone.
The broader recovery structure remains constructive, with price now approaching the important $2,627–$2,785 resistance zone. The $2,784.60 level is the major 0.382 Fibonacci reference on the chart.
📈 EMA Structure
20 EMA: $2,479.36
50 EMA: $2,319.51
100 EMA: $2,188.20
200 EMA: $2,221.92
ETH is currently trading well above the 20 EMA at $2,479.36.
The recovery above the 50 EMA at $2,319.51, 100 EMA at $2,188.20, and 200 EMA at $2,221.92 keeps the broader recovery structure constructive.
The 20 EMA is now acting as an important dynamic reference. A sustained hold above this level would keep the short-term structure supported.
📐 Fibonacci Levels
Key Fibonacci levels:
0.236: $2,315.21
0.382: $2,784.60
0.5: $3,163.97
0.618: $3,543.34
0.786: $4,083.46
1.0: $4,771.47
ETH has moved significantly above the 0.236 Fibonacci level at $2,315.21.
The next major Fibonacci resistance is $2,784.60 — 0.382 Fib.
A sustained move through the $2,627–$2,785 resistance structure would bring the higher Fibonacci levels into focus.
🟢 Upside Scenario
ETH is consolidating near $2,577 after the recent recovery and is now approaching the upper resistance structure.
Immediate resistance:
$2,577.77
$2,627.42
$2,784.60 — 0.382 Fibonacci
$3,163.97 — 0.5 Fibonacci
$3,543.34 — 0.618 Fibonacci
A clean breakout and sustained close above the $2,627–$2,785 zone would provide stronger confirmation of continued recovery.
🎯 Target 1: $2,627.42
🎯 Target 2: $2,784.60 — 0.382 Fibonacci
🎯 Target 3: $3,163.97 — 0.5 Fibonacci
🎯 Target 4: $3,543.34 — 0.618 Fibonacci
🎯 Target 5: $4,083.46 — 0.786 Fibonacci
🎯 Target 6: $4,771.47 — 1.0 Fibonacci
A sustained move above $2,784.60 could strengthen the medium-term recovery structure and bring the $3,164–$3,543 region into focus.
🔴 Pullback Scenario
After the recent expansion, a retest of the breakout area would be normal.
Key supports:
$2,538.00
$2,529.05
$2,503.11
$2,479.36 — 20 EMA
$2,479.06
$2,475.84
$2,454.11
$2,405.75
$2,319.51 — 50 EMA
The $2,475–$2,540 zone is particularly important.
If ETH continues to hold this area during a pullback, the current recovery structure remains active.
A sustained loss of the $2,475–$2,454 area would weaken the short-term structure and could expose the lower $2,405–$2,320 region.
🧠 Market Structure & Liquidity
ETH has formed a clear recovery structure after sweeping liquidity around the $2,280–$2,360 region.
The recent move produced a strong breakout from the previous consolidation and pushed price toward the $2,600 area.
ETH is now moving through an important:
Recovery → Breakout → Consolidation → Continuation
structure.
The major upside liquidity is concentrated around $2,627–$2,785. A decisive move through this zone would place $3,163.97 as the next major Fibonacci reference.
📊 RSI Momentum
RSI (14): 60.38
RSI remains above the neutral 50 level and is currently around 60, showing positive momentum.
The RSI signal line is around 59.90, keeping momentum relatively balanced near the 60 area.
A sustained RSI above 60 would support continued momentum, while a move back below 50 would indicate increasing short-term weakness.
🎯 Key Levels
🔴 Major Resistance: $2,627.42 → $2,784.60 → $3,163.97 → $3,543.34
🟢 Major Support: $2,538.00 → $2,529.05 → $2,503.11 → $2,479.36 → $2,454.11
📉 Dynamic EMA Support: $2,479.36 — 20 EMA | $2,319.51 — 50 EMA | $2,221.92 — 200 EMA | $2,188.20 — 100 EMA
🚀 Upside References: $2,784.60 → $3,163.97 → $3,543.34 → $4,083.46
📌 Final Outlook
ETH's broader structure remains constructive after the recent recovery, with price now holding around $2,577 and above the major $2,475–$2,540 support structure.
The $2,475–$2,540 area is now an important short-term support region, while $2,627–$2,785 remains the immediate major resistance zone.
A confirmed move above $2,784.60 could open the path toward $3,163.97, followed by $3,543.34 and potentially $4,083.46.
However, rejection from the upper resistance area followed by a sustained loss of $2,454.11 would weaken the current structure and bring the lower support zones back into focus.
Bias: 🟢 Recovery structure intact above $2,454.11. A sustained move above $2,784.60 could open the path toward $3,163.97, with $3,543.34 as the next major Fibonacci reference.
$ETH
{future}(ETHUSDT)
ETH Technical Outlook: Ethereum Holds Near $2.58K as Recovery Continues
ETH is currently trading around $2,577, holding above the $2,500–$2,540 support area after the recent recovery from the $2,280–$2,360 demand zone.
The broader recovery structure remains constructive, with price now approaching the important $2,627–$2,785 resistance zone. The $2,784.60 level is the major 0.382 Fibonacci reference on the chart.
📈 EMA Structure
20 EMA: $2,479.36
50 EMA: $2,319.51
100 EMA: $2,188.20
200 EMA: $2,221.92
ETH is currently trading well above the 20 EMA at $2,479.36.
The recovery above the 50 EMA at $2,319.51, 100 EMA at $2,188.20, and 200 EMA at $2,221.92 keeps the broader recovery structure constructive.
The 20 EMA is now acting as an important dynamic reference. A sustained hold above this level would keep the short-term structure supported.
📐 Fibonacci Levels
Key Fibonacci levels:
0.236: $2,315.21
0.382: $2,784.60
0.5: $3,163.97
0.618: $3,543.34
0.786: $4,083.46
1.0: $4,771.47
ETH has moved significantly above the 0.236 Fibonacci level at $2,315.21.
The next major Fibonacci resistance is $2,784.60 — 0.382 Fib.
A sustained move through the $2,627–$2,785 resistance structure would bring the higher Fibonacci levels into focus.
🟢 Upside Scenario
ETH is consolidating near $2,577 after the recent recovery and is now approaching the upper resistance structure.
Immediate resistance:
$2,577.77
$2,627.42
$2,784.60 — 0.382 Fibonacci
$3,163.97 — 0.5 Fibonacci
$3,543.34 — 0.618 Fibonacci
A clean breakout and sustained close above the $2,627–$2,785 zone would provide stronger confirmation of continued recovery.
🎯 Target 1: $2,627.42
🎯 Target 2: $2,784.60 — 0.382 Fibonacci
🎯 Target 3: $3,163.97 — 0.5 Fibonacci
🎯 Target 4: $3,543.34 — 0.618 Fibonacci
🎯 Target 5: $4,083.46 — 0.786 Fibonacci
🎯 Target 6: $4,771.47 — 1.0 Fibonacci
A sustained move above $2,784.60 could strengthen the medium-term recovery structure and bring the $3,164–$3,543 region into focus.
🔴 Pullback Scenario
After the recent expansion, a retest of the breakout area would be normal.
Key supports:
$2,538.00
$2,529.05
$2,503.11
$2,479.36 — 20 EMA
$2,479.06
$2,475.84
$2,454.11
$2,405.75
$2,319.51 — 50 EMA
The $2,475–$2,540 zone is particularly important.
If ETH continues to hold this area during a pullback, the current recovery structure remains active.
A sustained loss of the $2,475–$2,454 area would weaken the short-term structure and could expose the lower $2,405–$2,320 region.
🧠 Market Structure & Liquidity
ETH has formed a clear recovery structure after sweeping liquidity around the $2,280–$2,360 region.
The recent move produced a strong breakout from the previous consolidation and pushed price toward the $2,600 area.
ETH is now moving through an important:
Recovery → Breakout → Consolidation → Continuation
structure.
The major upside liquidity is concentrated around $2,627–$2,785. A decisive move through this zone would place $3,163.97 as the next major Fibonacci reference.
📊 RSI Momentum
RSI (14): 60.38
RSI remains above the neutral 50 level and is currently around 60, showing positive momentum.
The RSI signal line is around 59.90, keeping momentum relatively balanced near the 60 area.
A sustained RSI above 60 would support continued momentum, while a move back below 50 would indicate increasing short-term weakness.
🎯 Key Levels
🔴 Major Resistance: $2,627.42 → $2,784.60 → $3,163.97 → $3,543.34
🟢 Major Support: $2,538.00 → $2,529.05 → $2,503.11 → $2,479.36 → $2,454.11
📉 Dynamic EMA Support: $2,479.36 — 20 EMA | $2,319.51 — 50 EMA | $2,221.92 — 200 EMA | $2,188.20 — 100 EMA
🚀 Upside References: $2,784.60 → $3,163.97 → $3,543.34 → $4,083.46
📌 Final Outlook
ETH's broader structure remains constructive after the recent recovery, with price now holding around $2,577 and above the major $2,475–$2,540 support structure.
The $2,475–$2,540 area is now an important short-term support region, while $2,627–$2,785 remains the immediate major resistance zone.
A confirmed move above $2,784.60 could open the path toward $3,163.97, followed by $3,543.34 and potentially $4,083.46.
However, rejection from the upper resistance area followed by a sustained loss of $2,454.11 would weaken the current structure and bring the lower support zones back into focus.
Bias: 🟢 Recovery structure intact above $2,454.11. A sustained move above $2,784.60 could open the path toward $3,163.97, with $3,543.34 as the next major Fibonacci reference.
$ETH
The broader recovery structure remains constructive, with price now approaching the important $2,627–$2,785 resistance zone. The $2,784.60 level is the major 0.382 Fibonacci reference on the chart.
📈 EMA Structure
20 EMA: $2,479.36
50 EMA: $2,319.51
100 EMA: $2,188.20
200 EMA: $2,221.92
ETH is currently trading well above the 20 EMA at $2,479.36.
The recovery above the 50 EMA at $2,319.51, 100 EMA at $2,188.20, and 200 EMA at $2,221.92 keeps the broader recovery structure constructive.
The 20 EMA is now acting as an important dynamic reference. A sustained hold above this level would keep the short-term structure supported.
📐 Fibonacci Levels
Key Fibonacci levels:
0.236: $2,315.21
0.382: $2,784.60
0.5: $3,163.97
0.618: $3,543.34
0.786: $4,083.46
1.0: $4,771.47
ETH has moved significantly above the 0.236 Fibonacci level at $2,315.21.
The next major Fibonacci resistance is $2,784.60 — 0.382 Fib.
A sustained move through the $2,627–$2,785 resistance structure would bring the higher Fibonacci levels into focus.
🟢 Upside Scenario
ETH is consolidating near $2,577 after the recent recovery and is now approaching the upper resistance structure.
Immediate resistance:
$2,577.77
$2,627.42
$2,784.60 — 0.382 Fibonacci
$3,163.97 — 0.5 Fibonacci
$3,543.34 — 0.618 Fibonacci
A clean breakout and sustained close above the $2,627–$2,785 zone would provide stronger confirmation of continued recovery.
🎯 Target 1: $2,627.42
🎯 Target 2: $2,784.60 — 0.382 Fibonacci
🎯 Target 3: $3,163.97 — 0.5 Fibonacci
🎯 Target 4: $3,543.34 — 0.618 Fibonacci
🎯 Target 5: $4,083.46 — 0.786 Fibonacci
🎯 Target 6: $4,771.47 — 1.0 Fibonacci
A sustained move above $2,784.60 could strengthen the medium-term recovery structure and bring the $3,164–$3,543 region into focus.
🔴 Pullback Scenario
After the recent expansion, a retest of the breakout area would be normal.
Key supports:
$2,538.00
$2,529.05
$2,503.11
$2,479.36 — 20 EMA
$2,479.06
$2,475.84
$2,454.11
$2,405.75
$2,319.51 — 50 EMA
The $2,475–$2,540 zone is particularly important.
If ETH continues to hold this area during a pullback, the current recovery structure remains active.
A sustained loss of the $2,475–$2,454 area would weaken the short-term structure and could expose the lower $2,405–$2,320 region.
🧠 Market Structure & Liquidity
ETH has formed a clear recovery structure after sweeping liquidity around the $2,280–$2,360 region.
The recent move produced a strong breakout from the previous consolidation and pushed price toward the $2,600 area.
ETH is now moving through an important:
Recovery → Breakout → Consolidation → Continuation
structure.
The major upside liquidity is concentrated around $2,627–$2,785. A decisive move through this zone would place $3,163.97 as the next major Fibonacci reference.
📊 RSI Momentum
RSI (14): 60.38
RSI remains above the neutral 50 level and is currently around 60, showing positive momentum.
The RSI signal line is around 59.90, keeping momentum relatively balanced near the 60 area.
A sustained RSI above 60 would support continued momentum, while a move back below 50 would indicate increasing short-term weakness.
🎯 Key Levels
🔴 Major Resistance: $2,627.42 → $2,784.60 → $3,163.97 → $3,543.34
🟢 Major Support: $2,538.00 → $2,529.05 → $2,503.11 → $2,479.36 → $2,454.11
📉 Dynamic EMA Support: $2,479.36 — 20 EMA | $2,319.51 — 50 EMA | $2,221.92 — 200 EMA | $2,188.20 — 100 EMA
🚀 Upside References: $2,784.60 → $3,163.97 → $3,543.34 → $4,083.46
📌 Final Outlook
ETH's broader structure remains constructive after the recent recovery, with price now holding around $2,577 and above the major $2,475–$2,540 support structure.
The $2,475–$2,540 area is now an important short-term support region, while $2,627–$2,785 remains the immediate major resistance zone.
A confirmed move above $2,784.60 could open the path toward $3,163.97, followed by $3,543.34 and potentially $4,083.46.
However, rejection from the upper resistance area followed by a sustained loss of $2,454.11 would weaken the current structure and bring the lower support zones back into focus.
Bias: 🟢 Recovery structure intact above $2,454.11. A sustained move above $2,784.60 could open the path toward $3,163.97, with $3,543.34 as the next major Fibonacci reference.
$ETH
65
·
--
Article
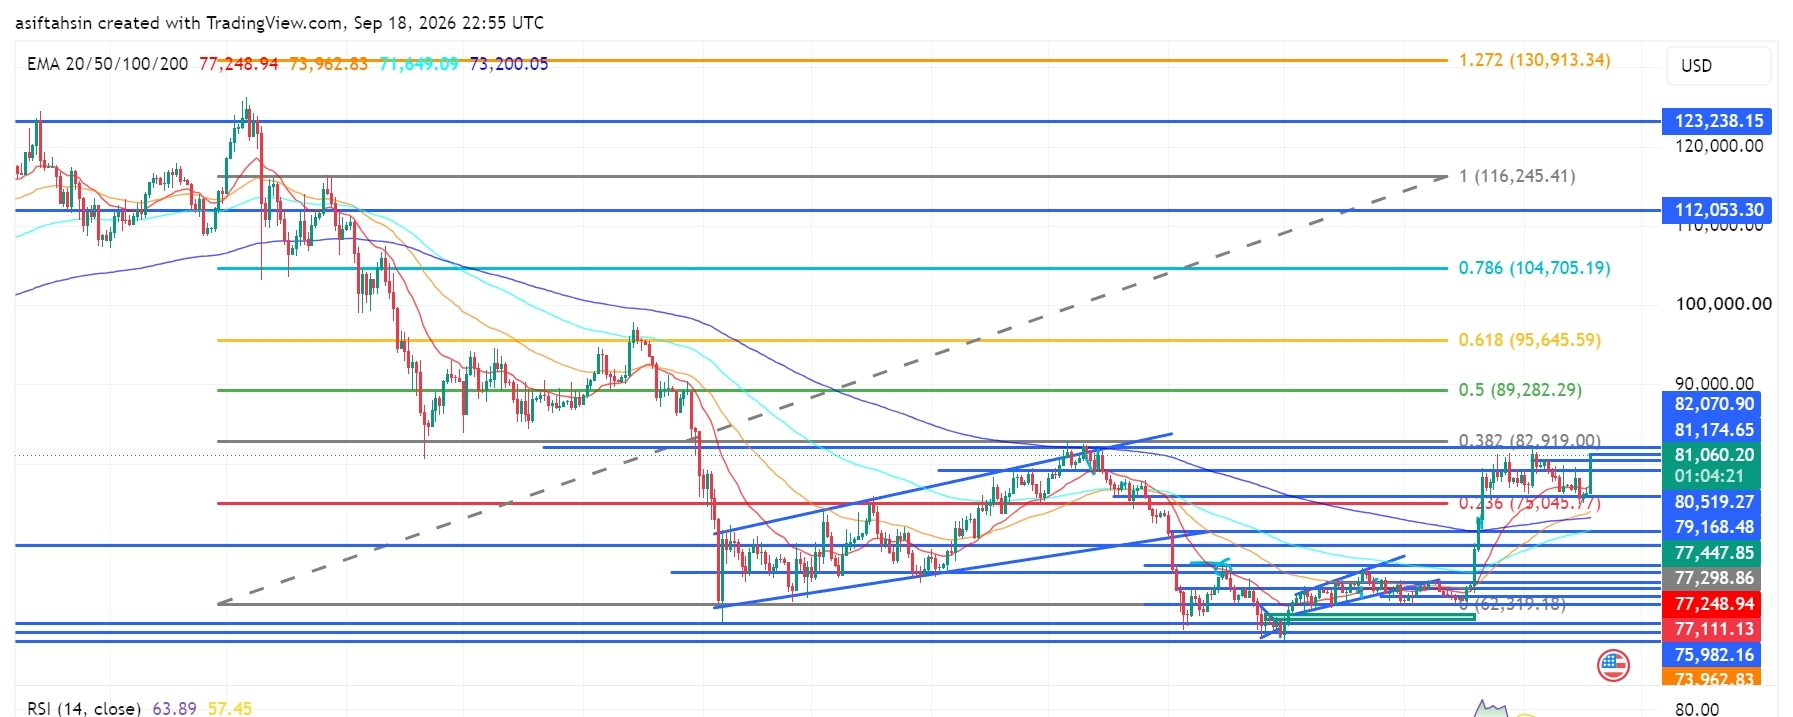
Perspectives techniques BTC : le Bitcoin reconquiert 81 K$ tandis que la structure de reprise se renforceLe BTC se négocie actuellement autour de 81 060 $, en restant au-dessus de la zone des 79 000–80 000 $ après le récent rebond depuis la zone de demande des 73 000–76 000 $.
La structure globale s'est améliorée : le prix a repris la zone des 80 K$ et revient vers la zone de résistance majeure des 82 070–82 919 $. Une cassure durable au-dessus de cette zone remettrait les niveaux de Fibonacci supérieurs à l'ordre du jour.
📈 Structure EMA
20 EMA : 77 248,95 $
50 EMA : 73 962,83 $
100 EMA : 71 649,09 $
200 EMA : 73 200,05 $
Le BTC se négocie actuellement nettement au-dessus de la 20 EMA à 77 248,95 $.
Perspectives techniques BTC : le Bitcoin reconquiert 81 K$ tandis que la structure de reprise se renforce
Le BTC se négocie actuellement autour de 81 060 $, en restant au-dessus de la zone des 79 000–80 000 $ après le récent rebond depuis la zone de demande des 73 000–76 000 $.
La structure globale s'est améliorée : le prix a repris la zone des 80 K$ et revient vers la zone de résistance majeure des 82 070–82 919 $. Une cassure durable au-dessus de cette zone remettrait les niveaux de Fibonacci supérieurs à l'ordre du jour.
📈 Structure EMA
20 EMA : 77 248,95 $
50 EMA : 73 962,83 $
100 EMA : 71 649,09 $
200 EMA : 73 200,05 $
Le BTC se négocie actuellement nettement au-dessus de la 20 EMA à 77 248,95 $.
La structure globale s'est améliorée : le prix a repris la zone des 80 K$ et revient vers la zone de résistance majeure des 82 070–82 919 $. Une cassure durable au-dessus de cette zone remettrait les niveaux de Fibonacci supérieurs à l'ordre du jour.
📈 Structure EMA
20 EMA : 77 248,95 $
50 EMA : 73 962,83 $
100 EMA : 71 649,09 $
200 EMA : 73 200,05 $
Le BTC se négocie actuellement nettement au-dessus de la 20 EMA à 77 248,95 $.
12
·
--
Article
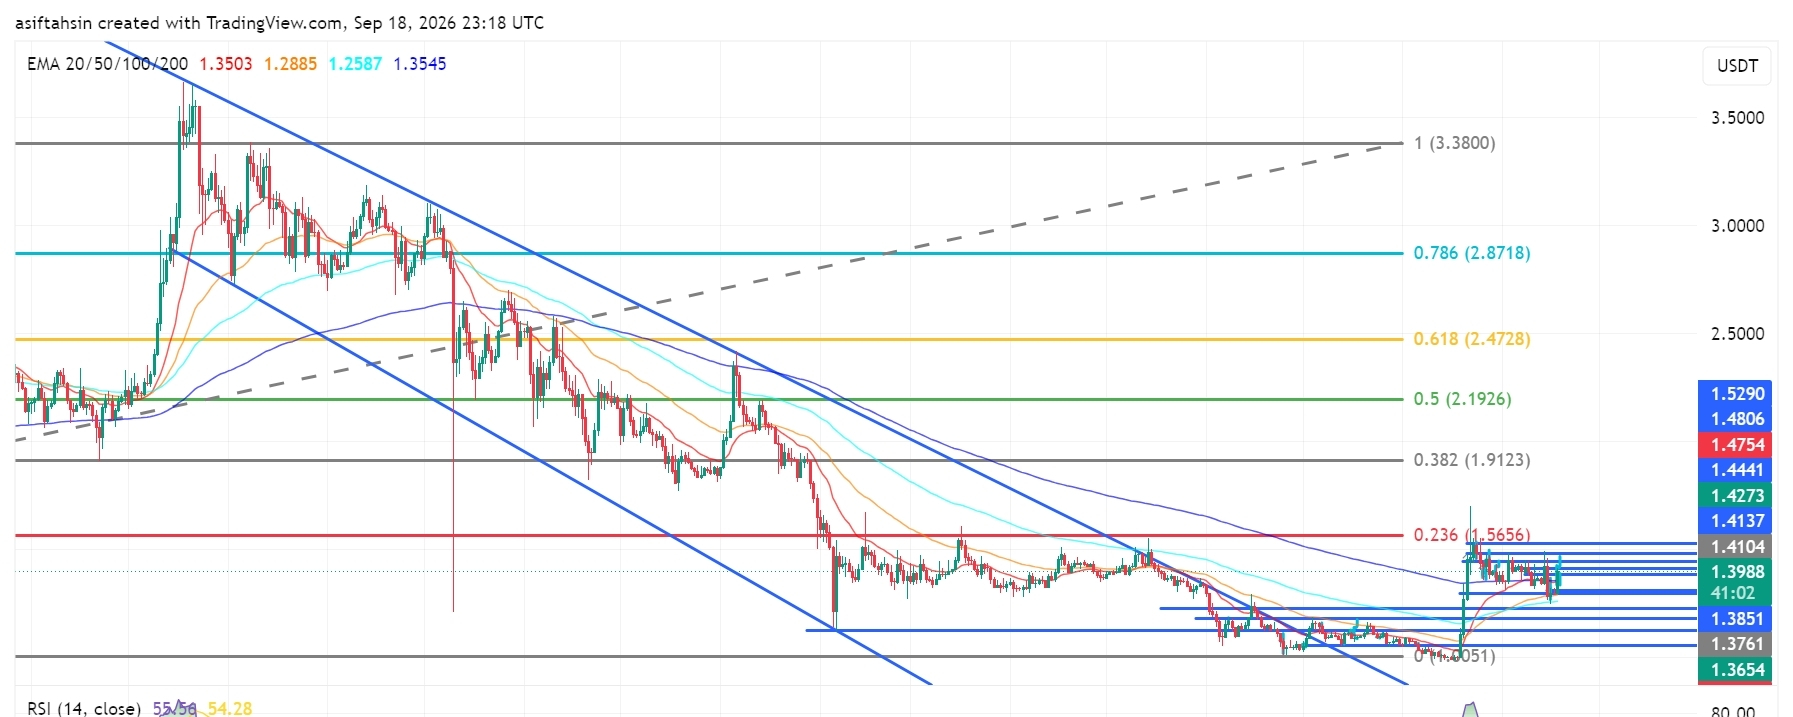
Point technique XRP : le XRP reste proche de 1,40 $ alors que les haussiers défendent la cassureLe XRP évolue actuellement autour de 1,40 $, consolidant après une forte reprise depuis les plus bas d'août et une cassure marquée par rapport à la structure descendante précédente.
La structure globale s'est nettement améliorée : le XRP évolue au-dessus des MM 20, 50 et 100. Cependant, le prix fait maintenant face à un important groupe de résistance autour de 1,41 à 1,43 $. Les haussiers ont besoin d'une cassure nette au-dessus de cette zone pour confirmer une nouvelle expansion à la hausse.
📈 Structure des MM
20 EMA : $1.3503
50 EMA : $1.2885
100 EMA : $1.2586
200 EMA : $1.3545
Le XRP évolue actuellement au-dessus des quatre principales MM, ce qui maintient une structure de reprise constructive.
Point technique XRP : le XRP reste proche de 1,40 $ alors que les haussiers défendent la cassure
Le XRP évolue actuellement autour de 1,40 $, consolidant après une forte reprise depuis les plus bas d'août et une cassure marquée par rapport à la structure descendante précédente.
La structure globale s'est nettement améliorée : le XRP évolue au-dessus des MM 20, 50 et 100. Cependant, le prix fait maintenant face à un important groupe de résistance autour de 1,41 à 1,43 $. Les haussiers ont besoin d'une cassure nette au-dessus de cette zone pour confirmer une nouvelle expansion à la hausse.
📈 Structure des MM
20 EMA : $1.3503
50 EMA : $1.2885
100 EMA : $1.2586
200 EMA : $1.3545
Le XRP évolue actuellement au-dessus des quatre principales MM, ce qui maintient une structure de reprise constructive.
La structure globale s'est nettement améliorée : le XRP évolue au-dessus des MM 20, 50 et 100. Cependant, le prix fait maintenant face à un important groupe de résistance autour de 1,41 à 1,43 $. Les haussiers ont besoin d'une cassure nette au-dessus de cette zone pour confirmer une nouvelle expansion à la hausse.
📈 Structure des MM
20 EMA : $1.3503
50 EMA : $1.2885
100 EMA : $1.2586
200 EMA : $1.3545
Le XRP évolue actuellement au-dessus des quatre principales MM, ce qui maintient une structure de reprise constructive.
276
·
--
Article
Voir la traduction
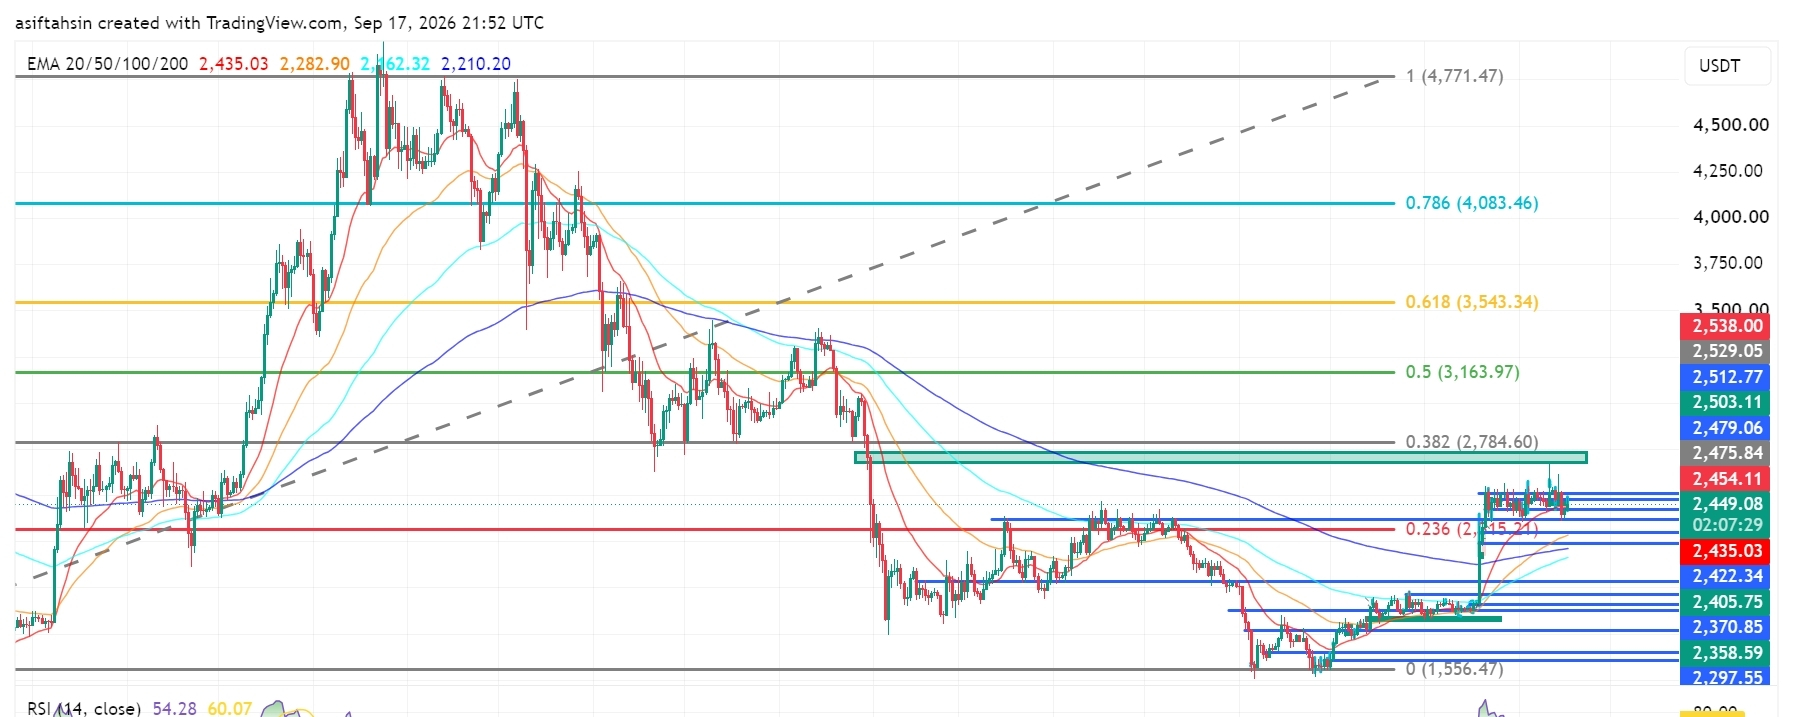
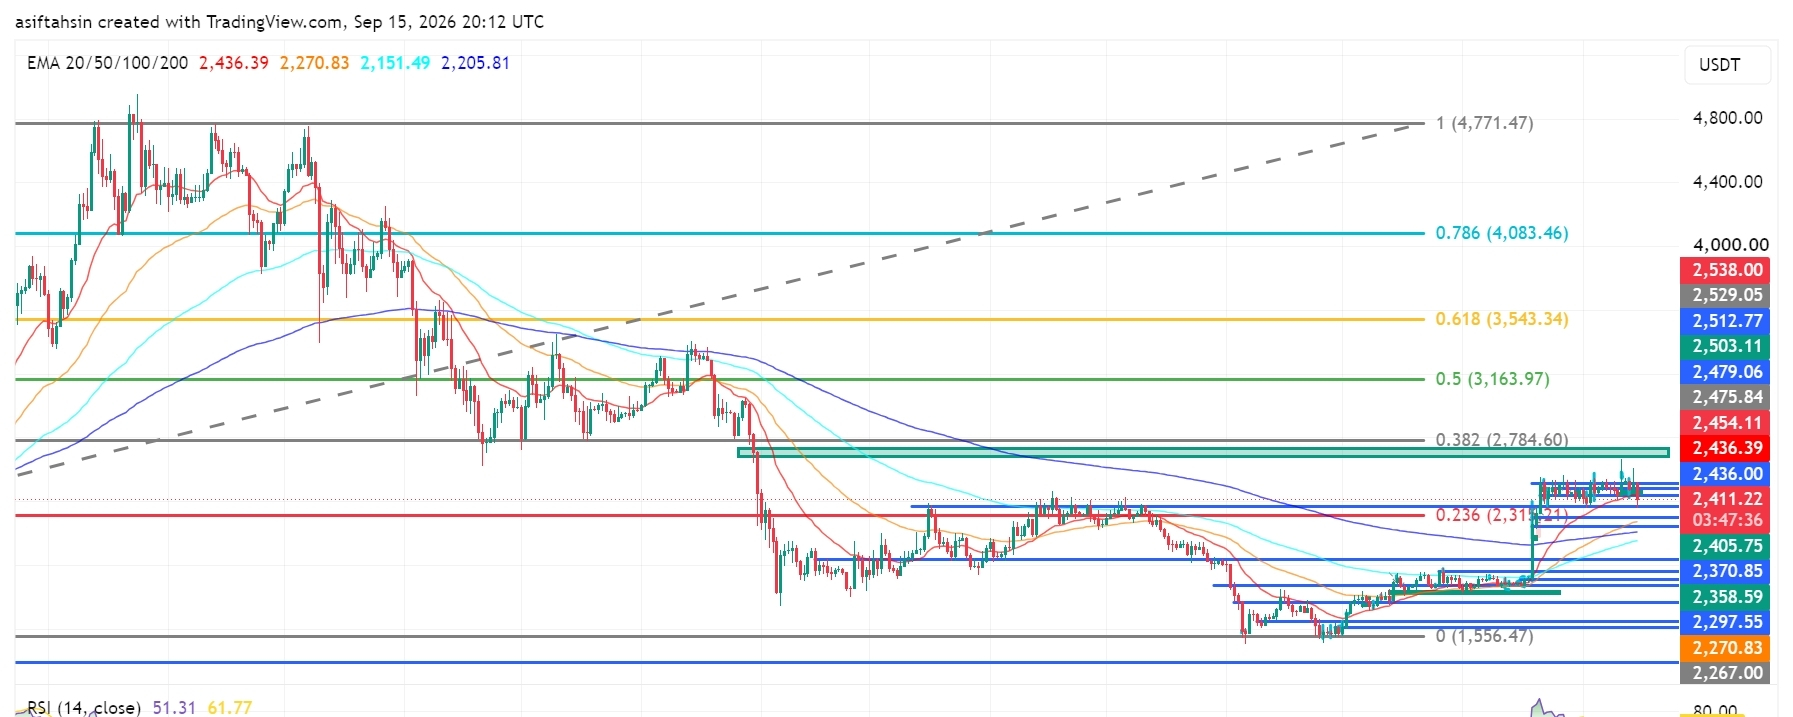
ETH Technical Outlook: Ethereum Holds Above $2.4K as Recovery Structure BuildsETH is currently trading around $2,450, holding above the $2,405–$2,435 support area after the recent recovery from the $2,300–$2,360 demand zone.
The broader structure is improving, but ETH is now consolidating below the $2,475–$2,538 resistance cluster. The next major chart area is around $2,784.60, which aligns with the 0.382 Fibonacci level.
📈 EMA Structure
20 EMA: $2,435.06
50 EMA: $2,282.92
100 EMA: $2,162.32
200 EMA: $2,210.20
ETH is currently trading above the 20 EMA at $2,435.06.
The recovery above the 50 EMA at $2,282.92, 100 EMA at $2,162.32, and 200 EMA at $2,210.20 keeps the broader recovery structure constructive.
A sustained hold above the 20 EMA would support short-term momentum, while losing the $2,210–$2,283 area would weaken the current structure.
📐 Fibonacci Levels
Key Fibonacci levels:
0.236: $2,315.21
0.382: $2,784.60
0.5: $3,163.97
0.618: $3,543.34
0.786: $4,083.46
1.0: $4,771.47
ETH is currently holding well above the 0.236 Fibonacci level at $2,315.21.
The next major Fibonacci resistance is $2,784.60 — 0.382 Fib.
A sustained move through the $2,475–$2,538 resistance structure could place the $2,784.60 region into focus.
🟢 Bullish Scenario
ETH is consolidating after the recent recovery and is currently holding above the $2,435 area.
Immediate resistance:
$2,454.11
$2,475.84
$2,479.06
$2,503.11
$2,512.77
$2,529.05
$2,538.00
$2,784.60 — 0.382 Fibonacci
A clean breakout and sustained close above the $2,529–$2,538 zone would provide stronger confirmation of continued recovery.
🎯 Target 1: $2,475.84
🎯 Target 2: $2,503.11
🎯 Target 3: $2,529.05
🎯 Target 4: $2,538.00
🎯 Target 5: $2,784.60 — 0.382 Fibonacci
🎯 Target 6: $3,163.97 — 0.5 Fibonacci
A confirmed move above $2,538 could strengthen the medium-term recovery structure and bring the $2,784–$3,164 region into focus.
🔴 Pullback Scenario
After the recent recovery, a retest of the breakout area would be normal.
Key supports:
$2,449.37
$2,435.06 — 20 EMA
$2,422.34
$2,405.75
$2,370.85
$2,358.59
$2,297.55
$2,282.92 — 50 EMA
$2,210.20 — 200 EMA
The $2,405–$2,435 zone is particularly important.
If ETH continues to hold this area during a pullback, the current recovery structure remains active.
A sustained loss of $2,282.92 would weaken the broader structure and could expose the $2,210–$2,162 area.
🧠 Market Structure & Liquidity
ETH has formed a clear recovery structure after sweeping liquidity around the $2,280–$2,360 region.
The recent move produced a strong recovery followed by a breakout above the previous consolidation area.
ETH is now moving through an important:
Recovery → Breakout → Retest → Consolidation
structure.
The major upside liquidity is concentrated around $2,475–$2,538. A decisive move through this zone would place $2,784.60 as the next major Fibonacci reference.
📊 RSI Momentum
RSI (14): 54.28
RSI remains above the neutral 50 level after the recent recovery.
The current reading shows moderately positive momentum, while the RSI signal line is around 60.07.
A sustained RSI move above 55–60 would indicate improving momentum toward the upper resistance area.
A move back below 50 would indicate increasing short-term momentum weakness.
🎯 Key Levels
🔴 Major Resistance: $2,454.11 → $2,475.84 → $2,503.11 → $2,529.05 → $2,538.00
🟢 Major Support: $2,435.06 → $2,422.34 → $2,405.75 → $2,370.85 → $2,358.59
📉 Dynamic EMA Support: $2,435.06 — 20 EMA | $2,282.92 — 50 EMA | $2,210.20 — 200 EMA | $2,162.32 — 100 EMA
🚀 Upside References: $2,538 → $2,784.60 → $3,163.97 → $3,543.34
📌 Final Outlook
ETH's broader structure remains constructive after the recent recovery, with price holding above the $2,405–$2,435 area.
The $2,405–$2,435 zone is now an important short-term support region. As long as ETH maintains this area, the current recovery structure remains active.
The immediate battle is around $2,475–$2,538. A confirmed move above $2,538 could open the path toward $2,784.60, followed by $3,163.97.
However, rejection from resistance followed by a sustained loss of $2,282.92 would weaken the broader structure and increase the possibility of a deeper retracement toward the $2,210–$2,162 area.
Bias: 🟢 Recovery structure intact above $2,282.92. A breakout above $2,538 could open the path toward $2,784.60, with $3,163.97 as the next major Fibonacci reference.
$ETH
{future}(ETHUSDT)
ETH Technical Outlook: Ethereum Holds Above $2.4K as Recovery Structure Builds
ETH is currently trading around $2,450, holding above the $2,405–$2,435 support area after the recent recovery from the $2,300–$2,360 demand zone.
The broader structure is improving, but ETH is now consolidating below the $2,475–$2,538 resistance cluster. The next major chart area is around $2,784.60, which aligns with the 0.382 Fibonacci level.
📈 EMA Structure
20 EMA: $2,435.06
50 EMA: $2,282.92
100 EMA: $2,162.32
200 EMA: $2,210.20
ETH is currently trading above the 20 EMA at $2,435.06.
The recovery above the 50 EMA at $2,282.92, 100 EMA at $2,162.32, and 200 EMA at $2,210.20 keeps the broader recovery structure constructive.
A sustained hold above the 20 EMA would support short-term momentum, while losing the $2,210–$2,283 area would weaken the current structure.
📐 Fibonacci Levels
Key Fibonacci levels:
0.236: $2,315.21
0.382: $2,784.60
0.5: $3,163.97
0.618: $3,543.34
0.786: $4,083.46
1.0: $4,771.47
ETH is currently holding well above the 0.236 Fibonacci level at $2,315.21.
The next major Fibonacci resistance is $2,784.60 — 0.382 Fib.
A sustained move through the $2,475–$2,538 resistance structure could place the $2,784.60 region into focus.
🟢 Bullish Scenario
ETH is consolidating after the recent recovery and is currently holding above the $2,435 area.
Immediate resistance:
$2,454.11
$2,475.84
$2,479.06
$2,503.11
$2,512.77
$2,529.05
$2,538.00
$2,784.60 — 0.382 Fibonacci
A clean breakout and sustained close above the $2,529–$2,538 zone would provide stronger confirmation of continued recovery.
🎯 Target 1: $2,475.84
🎯 Target 2: $2,503.11
🎯 Target 3: $2,529.05
🎯 Target 4: $2,538.00
🎯 Target 5: $2,784.60 — 0.382 Fibonacci
🎯 Target 6: $3,163.97 — 0.5 Fibonacci
A confirmed move above $2,538 could strengthen the medium-term recovery structure and bring the $2,784–$3,164 region into focus.
🔴 Pullback Scenario
After the recent recovery, a retest of the breakout area would be normal.
Key supports:
$2,449.37
$2,435.06 — 20 EMA
$2,422.34
$2,405.75
$2,370.85
$2,358.59
$2,297.55
$2,282.92 — 50 EMA
$2,210.20 — 200 EMA
The $2,405–$2,435 zone is particularly important.
If ETH continues to hold this area during a pullback, the current recovery structure remains active.
A sustained loss of $2,282.92 would weaken the broader structure and could expose the $2,210–$2,162 area.
🧠 Market Structure & Liquidity
ETH has formed a clear recovery structure after sweeping liquidity around the $2,280–$2,360 region.
The recent move produced a strong recovery followed by a breakout above the previous consolidation area.
ETH is now moving through an important:
Recovery → Breakout → Retest → Consolidation
structure.
The major upside liquidity is concentrated around $2,475–$2,538. A decisive move through this zone would place $2,784.60 as the next major Fibonacci reference.
📊 RSI Momentum
RSI (14): 54.28
RSI remains above the neutral 50 level after the recent recovery.
The current reading shows moderately positive momentum, while the RSI signal line is around 60.07.
A sustained RSI move above 55–60 would indicate improving momentum toward the upper resistance area.
A move back below 50 would indicate increasing short-term momentum weakness.
🎯 Key Levels
🔴 Major Resistance: $2,454.11 → $2,475.84 → $2,503.11 → $2,529.05 → $2,538.00
🟢 Major Support: $2,435.06 → $2,422.34 → $2,405.75 → $2,370.85 → $2,358.59
📉 Dynamic EMA Support: $2,435.06 — 20 EMA | $2,282.92 — 50 EMA | $2,210.20 — 200 EMA | $2,162.32 — 100 EMA
🚀 Upside References: $2,538 → $2,784.60 → $3,163.97 → $3,543.34
📌 Final Outlook
ETH's broader structure remains constructive after the recent recovery, with price holding above the $2,405–$2,435 area.
The $2,405–$2,435 zone is now an important short-term support region. As long as ETH maintains this area, the current recovery structure remains active.
The immediate battle is around $2,475–$2,538. A confirmed move above $2,538 could open the path toward $2,784.60, followed by $3,163.97.
However, rejection from resistance followed by a sustained loss of $2,282.92 would weaken the broader structure and increase the possibility of a deeper retracement toward the $2,210–$2,162 area.
Bias: 🟢 Recovery structure intact above $2,282.92. A breakout above $2,538 could open the path toward $2,784.60, with $3,163.97 as the next major Fibonacci reference.
$ETH
The broader structure is improving, but ETH is now consolidating below the $2,475–$2,538 resistance cluster. The next major chart area is around $2,784.60, which aligns with the 0.382 Fibonacci level.
📈 EMA Structure
20 EMA: $2,435.06
50 EMA: $2,282.92
100 EMA: $2,162.32
200 EMA: $2,210.20
ETH is currently trading above the 20 EMA at $2,435.06.
The recovery above the 50 EMA at $2,282.92, 100 EMA at $2,162.32, and 200 EMA at $2,210.20 keeps the broader recovery structure constructive.
A sustained hold above the 20 EMA would support short-term momentum, while losing the $2,210–$2,283 area would weaken the current structure.
📐 Fibonacci Levels
Key Fibonacci levels:
0.236: $2,315.21
0.382: $2,784.60
0.5: $3,163.97
0.618: $3,543.34
0.786: $4,083.46
1.0: $4,771.47
ETH is currently holding well above the 0.236 Fibonacci level at $2,315.21.
The next major Fibonacci resistance is $2,784.60 — 0.382 Fib.
A sustained move through the $2,475–$2,538 resistance structure could place the $2,784.60 region into focus.
🟢 Bullish Scenario
ETH is consolidating after the recent recovery and is currently holding above the $2,435 area.
Immediate resistance:
$2,454.11
$2,475.84
$2,479.06
$2,503.11
$2,512.77
$2,529.05
$2,538.00
$2,784.60 — 0.382 Fibonacci
A clean breakout and sustained close above the $2,529–$2,538 zone would provide stronger confirmation of continued recovery.
🎯 Target 1: $2,475.84
🎯 Target 2: $2,503.11
🎯 Target 3: $2,529.05
🎯 Target 4: $2,538.00
🎯 Target 5: $2,784.60 — 0.382 Fibonacci
🎯 Target 6: $3,163.97 — 0.5 Fibonacci
A confirmed move above $2,538 could strengthen the medium-term recovery structure and bring the $2,784–$3,164 region into focus.
🔴 Pullback Scenario
After the recent recovery, a retest of the breakout area would be normal.
Key supports:
$2,449.37
$2,435.06 — 20 EMA
$2,422.34
$2,405.75
$2,370.85
$2,358.59
$2,297.55
$2,282.92 — 50 EMA
$2,210.20 — 200 EMA
The $2,405–$2,435 zone is particularly important.
If ETH continues to hold this area during a pullback, the current recovery structure remains active.
A sustained loss of $2,282.92 would weaken the broader structure and could expose the $2,210–$2,162 area.
🧠 Market Structure & Liquidity
ETH has formed a clear recovery structure after sweeping liquidity around the $2,280–$2,360 region.
The recent move produced a strong recovery followed by a breakout above the previous consolidation area.
ETH is now moving through an important:
Recovery → Breakout → Retest → Consolidation
structure.
The major upside liquidity is concentrated around $2,475–$2,538. A decisive move through this zone would place $2,784.60 as the next major Fibonacci reference.
📊 RSI Momentum
RSI (14): 54.28
RSI remains above the neutral 50 level after the recent recovery.
The current reading shows moderately positive momentum, while the RSI signal line is around 60.07.
A sustained RSI move above 55–60 would indicate improving momentum toward the upper resistance area.
A move back below 50 would indicate increasing short-term momentum weakness.
🎯 Key Levels
🔴 Major Resistance: $2,454.11 → $2,475.84 → $2,503.11 → $2,529.05 → $2,538.00
🟢 Major Support: $2,435.06 → $2,422.34 → $2,405.75 → $2,370.85 → $2,358.59
📉 Dynamic EMA Support: $2,435.06 — 20 EMA | $2,282.92 — 50 EMA | $2,210.20 — 200 EMA | $2,162.32 — 100 EMA
🚀 Upside References: $2,538 → $2,784.60 → $3,163.97 → $3,543.34
📌 Final Outlook
ETH's broader structure remains constructive after the recent recovery, with price holding above the $2,405–$2,435 area.
The $2,405–$2,435 zone is now an important short-term support region. As long as ETH maintains this area, the current recovery structure remains active.
The immediate battle is around $2,475–$2,538. A confirmed move above $2,538 could open the path toward $2,784.60, followed by $3,163.97.
However, rejection from resistance followed by a sustained loss of $2,282.92 would weaken the broader structure and increase the possibility of a deeper retracement toward the $2,210–$2,162 area.
Bias: 🟢 Recovery structure intact above $2,282.92. A breakout above $2,538 could open the path toward $2,784.60, with $3,163.97 as the next major Fibonacci reference.
$ETH
75
·
--
Article
Voir la traduction
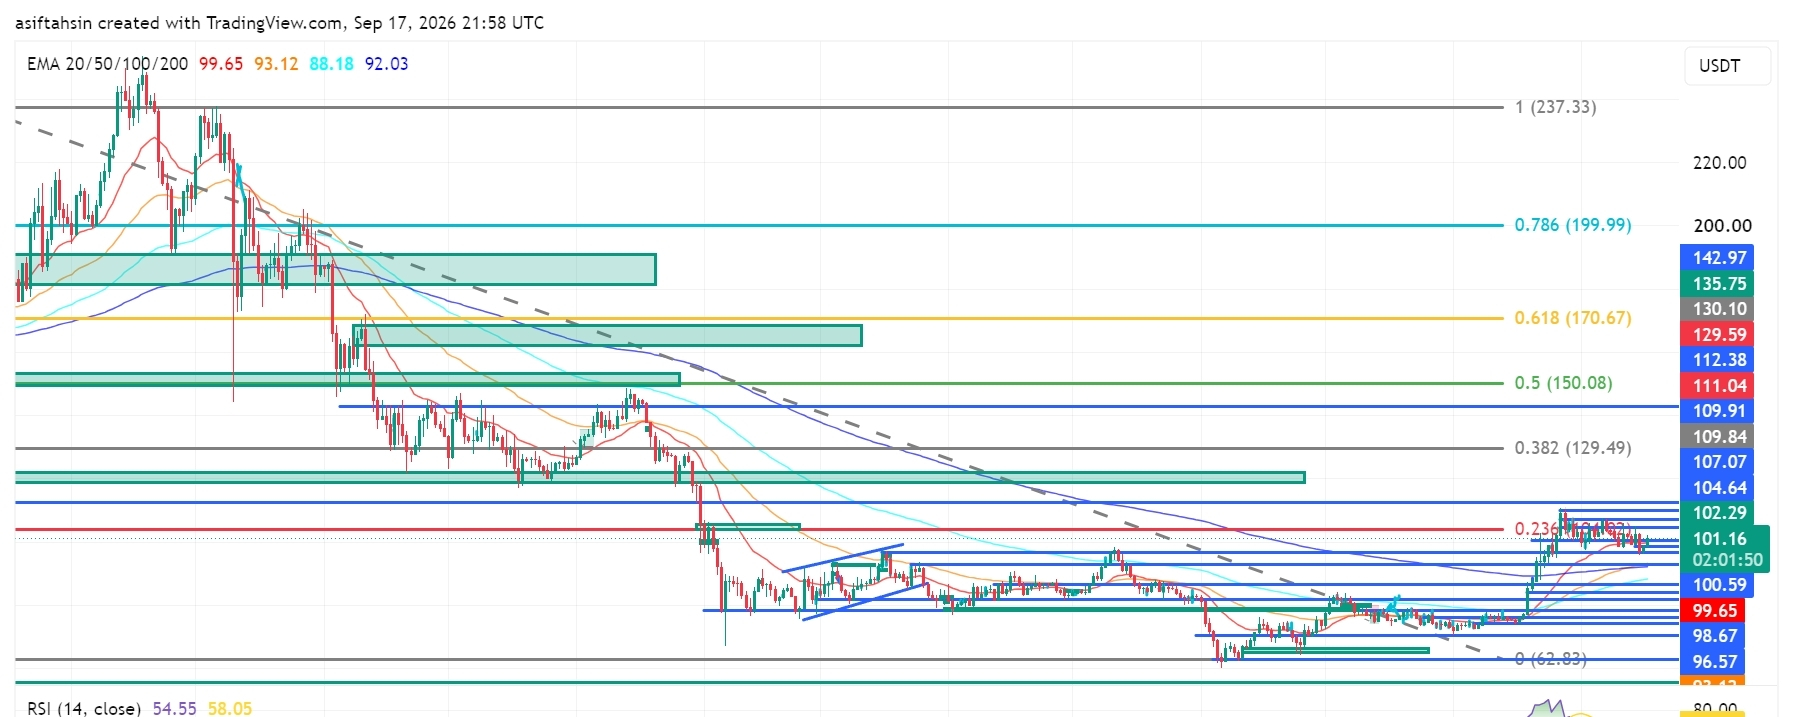
SOL Technical Outlook: Solana Holds Above $100 as Bulls Defend the RecoverySOL is currently trading around $101.16, holding above the $99–$100 breakout zone after the recent bullish expansion from the $92–$94 demand area.
The broader recovery structure remains constructive, but SOL is now consolidating below the $102.29–$107.07 resistance cluster. Bulls need to reclaim this area and break the $109.91–$112.38 zone for the next major upside expansion.
📈 EMA Structure
- 20 EMA: $99.65
- 50 EMA: $93.12
- 100 EMA: $88.18
- 200 EMA: $92.03
SOL is currently trading above the 20 EMA at $99.65.
The recovery above the 50 EMA at $93.12 and 200 EMA at $92.03 keeps the broader recovery structure intact.
A sustained hold above the 20 EMA would support short-term momentum, while losing the $93.12–$92.03 area would weaken the current structure.
📐 Fibonacci Levels
Key Fibonacci levels:
- 0.236: $104.64
- 0.382: $129.49
- 0.5: $150.08
- 0.618: $170.67
- 0.786: $199.99
- 1.0: $237.33
SOL is currently trading below the 0.236 Fibonacci level at $104.64.
The next major Fibonacci resistance is $129.49 — 0.382 Fib.
A sustained breakout through the $104–$112 resistance structure could open the path toward the $129.49 region.
🟢 Bullish Scenario
SOL is consolidating after the recent recovery and is currently maintaining acceptance above the $100 area.
Immediate resistance:
- $102.29
- $104.64 — 0.236 Fibonacci
- $107.07
- $109.84
- $109.91
- $111.04
- $112.38
A clean breakout and sustained close above $111.04–$112.38 would provide stronger confirmation of bullish continuation.
🎯 Target 1: $104.64
🎯 Target 2: $107.07
🎯 Target 3: $109.91
🎯 Target 4: $112.38
🎯 Target 5: $129.49 — 0.382 Fibonacci
🎯 Target 6: $150.08 — 0.5 Fibonacci
A confirmed breakout above the $111–$112 zone could strengthen the medium-term recovery structure and potentially accelerate SOL toward the $129–$150 region.
🔴 Pullback Scenario
After the recent bullish expansion, a retest of the breakout area would be normal.
Key supports:
- $100.59
- $99.65 — 20 EMA
- $98.67
- $96.57
- $93.12 — 50 EMA
- $92.94
- $92.03 — 200 EMA
- $88.18 — 100 EMA
The $96–$100 zone is particularly important.
If SOL continues to hold this area during a pullback, the current recovery structure remains active.
A sustained loss of $92.03 would weaken the current structure and could expose the $88.18 support zone.
🧠 Market Structure & Liquidity
SOL has formed a clear recovery structure after sweeping liquidity around the $92–$94 demand region.
The recent move produced a market-structure shift followed by a breakout and higher-low formation.
SOL is now moving through an important:
Breakout → Retest → Consolidation → Continuation
structure.
The major upside liquidity is concentrated around $102–$112. A decisive breakout above this zone would place $129.49 as the next major Fibonacci reference.
📊 RSI Momentum
RSI (14): 54.55
RSI remains above the neutral 50 level after cooling from the recent bullish expansion.
The current reading shows moderately positive momentum without reaching an extreme zone.
A sustained RSI move above 55–60 would indicate improving momentum toward the upper resistance area.
A move back below 50 would indicate increasing short-term momentum weakness.
🎯 Key Levels
🔴 Major Resistance: $102.29 → $104.64 → $107.07 → $109.91 → $111.04 → $112.38
🟢 Major Support: $100.59 → $99.65 → $98.67 → $96.57 → $93.12 → $92.03
📉 Dynamic EMA Support: $99.65 — 20 EMA | $93.12 — 50 EMA | $92.03 — 200 EMA | $88.18 — 100 EMA
🚀 Upside Targets: $112.38 → $129.49 → $150.08 → $170.67
📌 Final Outlook
SOL's broader structure remains constructive after the recent breakout, with price holding above the $99–$100 region.
The $96–$100 area is now an important short-term support region. As long as SOL maintains this area, the current recovery structure remains active.
The immediate battle is around $102–$112. A confirmed breakout above $112.38 could open the path toward $129.49, followed by $150.08 and potentially $170.67.
However, rejection from resistance followed by a sustained loss of $92.03 would weaken the current structure and increase the possibility of a deeper retracement toward the $88.18 area.
Bias: 🟢 Recovery structure intact above $92.03. A breakout above $112.38 could open the path toward $129.49, with $150.08 as the next major Fibonacci target.
$SOL
{future}(SOLUSDT)
SOL Technical Outlook: Solana Holds Above $100 as Bulls Defend the Recovery
SOL is currently trading around $101.16, holding above the $99–$100 breakout zone after the recent bullish expansion from the $92–$94 demand area.
The broader recovery structure remains constructive, but SOL is now consolidating below the $102.29–$107.07 resistance cluster. Bulls need to reclaim this area and break the $109.91–$112.38 zone for the next major upside expansion.
📈 EMA Structure
- 20 EMA: $99.65
- 50 EMA: $93.12
- 100 EMA: $88.18
- 200 EMA: $92.03
SOL is currently trading above the 20 EMA at $99.65.
The recovery above the 50 EMA at $93.12 and 200 EMA at $92.03 keeps the broader recovery structure intact.
A sustained hold above the 20 EMA would support short-term momentum, while losing the $93.12–$92.03 area would weaken the current structure.
📐 Fibonacci Levels
Key Fibonacci levels:
- 0.236: $104.64
- 0.382: $129.49
- 0.5: $150.08
- 0.618: $170.67
- 0.786: $199.99
- 1.0: $237.33
SOL is currently trading below the 0.236 Fibonacci level at $104.64.
The next major Fibonacci resistance is $129.49 — 0.382 Fib.
A sustained breakout through the $104–$112 resistance structure could open the path toward the $129.49 region.
🟢 Bullish Scenario
SOL is consolidating after the recent recovery and is currently maintaining acceptance above the $100 area.
Immediate resistance:
- $102.29
- $104.64 — 0.236 Fibonacci
- $107.07
- $109.84
- $109.91
- $111.04
- $112.38
A clean breakout and sustained close above $111.04–$112.38 would provide stronger confirmation of bullish continuation.
🎯 Target 1: $104.64
🎯 Target 2: $107.07
🎯 Target 3: $109.91
🎯 Target 4: $112.38
🎯 Target 5: $129.49 — 0.382 Fibonacci
🎯 Target 6: $150.08 — 0.5 Fibonacci
A confirmed breakout above the $111–$112 zone could strengthen the medium-term recovery structure and potentially accelerate SOL toward the $129–$150 region.
🔴 Pullback Scenario
After the recent bullish expansion, a retest of the breakout area would be normal.
Key supports:
- $100.59
- $99.65 — 20 EMA
- $98.67
- $96.57
- $93.12 — 50 EMA
- $92.94
- $92.03 — 200 EMA
- $88.18 — 100 EMA
The $96–$100 zone is particularly important.
If SOL continues to hold this area during a pullback, the current recovery structure remains active.
A sustained loss of $92.03 would weaken the current structure and could expose the $88.18 support zone.
🧠 Market Structure & Liquidity
SOL has formed a clear recovery structure after sweeping liquidity around the $92–$94 demand region.
The recent move produced a market-structure shift followed by a breakout and higher-low formation.
SOL is now moving through an important:
Breakout → Retest → Consolidation → Continuation
structure.
The major upside liquidity is concentrated around $102–$112. A decisive breakout above this zone would place $129.49 as the next major Fibonacci reference.
📊 RSI Momentum
RSI (14): 54.55
RSI remains above the neutral 50 level after cooling from the recent bullish expansion.
The current reading shows moderately positive momentum without reaching an extreme zone.
A sustained RSI move above 55–60 would indicate improving momentum toward the upper resistance area.
A move back below 50 would indicate increasing short-term momentum weakness.
🎯 Key Levels
🔴 Major Resistance: $102.29 → $104.64 → $107.07 → $109.91 → $111.04 → $112.38
🟢 Major Support: $100.59 → $99.65 → $98.67 → $96.57 → $93.12 → $92.03
📉 Dynamic EMA Support: $99.65 — 20 EMA | $93.12 — 50 EMA | $92.03 — 200 EMA | $88.18 — 100 EMA
🚀 Upside Targets: $112.38 → $129.49 → $150.08 → $170.67
📌 Final Outlook
SOL's broader structure remains constructive after the recent breakout, with price holding above the $99–$100 region.
The $96–$100 area is now an important short-term support region. As long as SOL maintains this area, the current recovery structure remains active.
The immediate battle is around $102–$112. A confirmed breakout above $112.38 could open the path toward $129.49, followed by $150.08 and potentially $170.67.
However, rejection from resistance followed by a sustained loss of $92.03 would weaken the current structure and increase the possibility of a deeper retracement toward the $88.18 area.
Bias: 🟢 Recovery structure intact above $92.03. A breakout above $112.38 could open the path toward $129.49, with $150.08 as the next major Fibonacci target.
$SOL
The broader recovery structure remains constructive, but SOL is now consolidating below the $102.29–$107.07 resistance cluster. Bulls need to reclaim this area and break the $109.91–$112.38 zone for the next major upside expansion.
📈 EMA Structure
- 20 EMA: $99.65
- 50 EMA: $93.12
- 100 EMA: $88.18
- 200 EMA: $92.03
SOL is currently trading above the 20 EMA at $99.65.
The recovery above the 50 EMA at $93.12 and 200 EMA at $92.03 keeps the broader recovery structure intact.
A sustained hold above the 20 EMA would support short-term momentum, while losing the $93.12–$92.03 area would weaken the current structure.
📐 Fibonacci Levels
Key Fibonacci levels:
- 0.236: $104.64
- 0.382: $129.49
- 0.5: $150.08
- 0.618: $170.67
- 0.786: $199.99
- 1.0: $237.33
SOL is currently trading below the 0.236 Fibonacci level at $104.64.
The next major Fibonacci resistance is $129.49 — 0.382 Fib.
A sustained breakout through the $104–$112 resistance structure could open the path toward the $129.49 region.
🟢 Bullish Scenario
SOL is consolidating after the recent recovery and is currently maintaining acceptance above the $100 area.
Immediate resistance:
- $102.29
- $104.64 — 0.236 Fibonacci
- $107.07
- $109.84
- $109.91
- $111.04
- $112.38
A clean breakout and sustained close above $111.04–$112.38 would provide stronger confirmation of bullish continuation.
🎯 Target 1: $104.64
🎯 Target 2: $107.07
🎯 Target 3: $109.91
🎯 Target 4: $112.38
🎯 Target 5: $129.49 — 0.382 Fibonacci
🎯 Target 6: $150.08 — 0.5 Fibonacci
A confirmed breakout above the $111–$112 zone could strengthen the medium-term recovery structure and potentially accelerate SOL toward the $129–$150 region.
🔴 Pullback Scenario
After the recent bullish expansion, a retest of the breakout area would be normal.
Key supports:
- $100.59
- $99.65 — 20 EMA
- $98.67
- $96.57
- $93.12 — 50 EMA
- $92.94
- $92.03 — 200 EMA
- $88.18 — 100 EMA
The $96–$100 zone is particularly important.
If SOL continues to hold this area during a pullback, the current recovery structure remains active.
A sustained loss of $92.03 would weaken the current structure and could expose the $88.18 support zone.
🧠 Market Structure & Liquidity
SOL has formed a clear recovery structure after sweeping liquidity around the $92–$94 demand region.
The recent move produced a market-structure shift followed by a breakout and higher-low formation.
SOL is now moving through an important:
Breakout → Retest → Consolidation → Continuation
structure.
The major upside liquidity is concentrated around $102–$112. A decisive breakout above this zone would place $129.49 as the next major Fibonacci reference.
📊 RSI Momentum
RSI (14): 54.55
RSI remains above the neutral 50 level after cooling from the recent bullish expansion.
The current reading shows moderately positive momentum without reaching an extreme zone.
A sustained RSI move above 55–60 would indicate improving momentum toward the upper resistance area.
A move back below 50 would indicate increasing short-term momentum weakness.
🎯 Key Levels
🔴 Major Resistance: $102.29 → $104.64 → $107.07 → $109.91 → $111.04 → $112.38
🟢 Major Support: $100.59 → $99.65 → $98.67 → $96.57 → $93.12 → $92.03
📉 Dynamic EMA Support: $99.65 — 20 EMA | $93.12 — 50 EMA | $92.03 — 200 EMA | $88.18 — 100 EMA
🚀 Upside Targets: $112.38 → $129.49 → $150.08 → $170.67
📌 Final Outlook
SOL's broader structure remains constructive after the recent breakout, with price holding above the $99–$100 region.
The $96–$100 area is now an important short-term support region. As long as SOL maintains this area, the current recovery structure remains active.
The immediate battle is around $102–$112. A confirmed breakout above $112.38 could open the path toward $129.49, followed by $150.08 and potentially $170.67.
However, rejection from resistance followed by a sustained loss of $92.03 would weaken the current structure and increase the possibility of a deeper retracement toward the $88.18 area.
Bias: 🟢 Recovery structure intact above $92.03. A breakout above $112.38 could open the path toward $129.49, with $150.08 as the next major Fibonacci target.
$SOL
73
·
--
Article
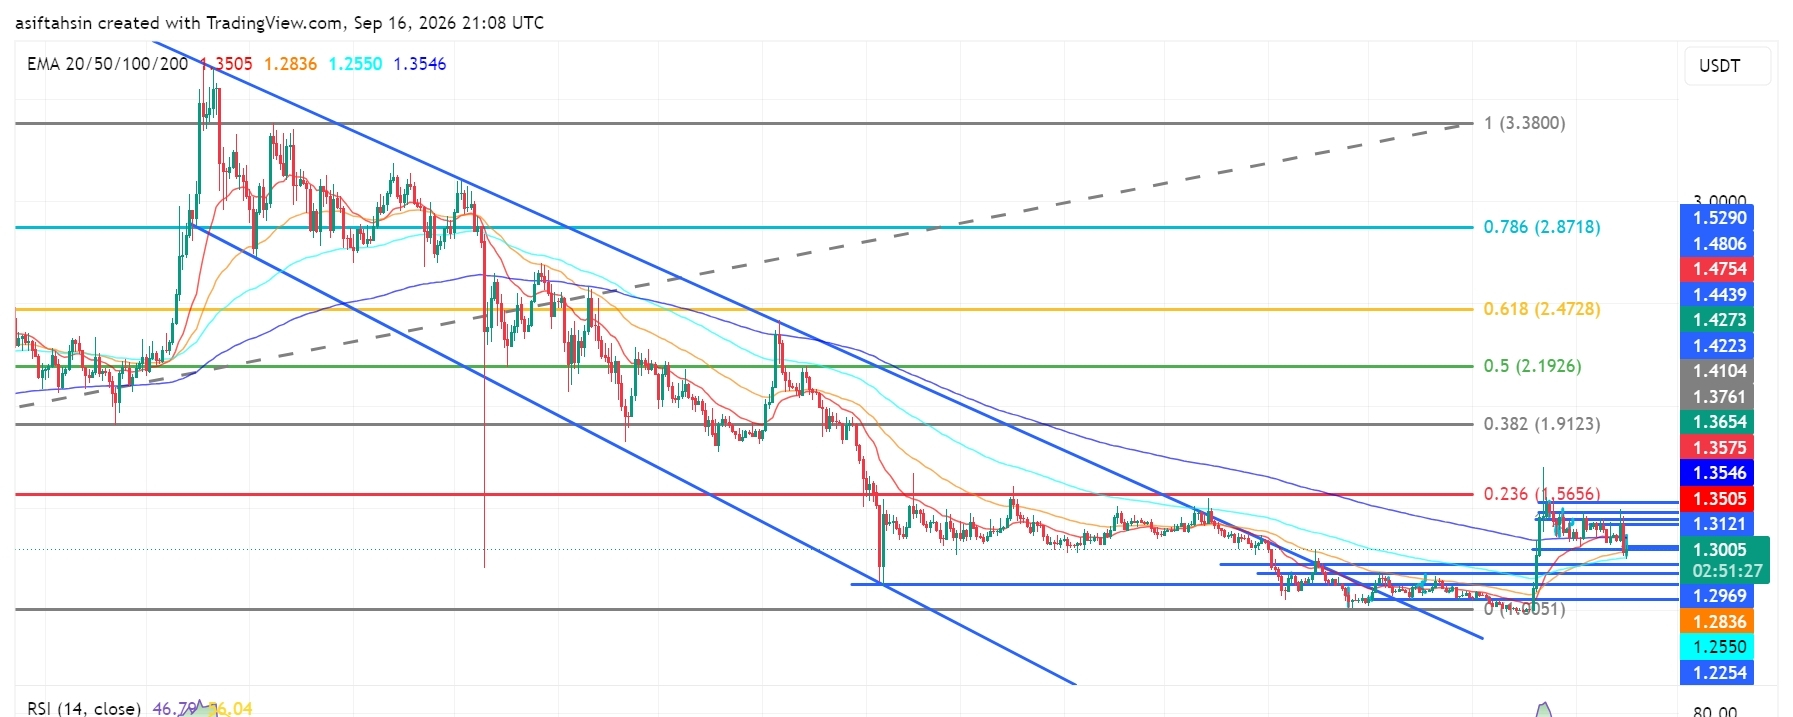
Point de vue technique sur XRP : XRP consolide près de 1,30 $ après un repli brutalXRP évolue autour de 1,30 $ sur le graphique après un rejet net de la zone 1,35–1,43 $. Le prix est revenu vers la zone de cassure, tandis que le graphique global reste en phase de reprise depuis la zone 1,20–1,25 $. L’élan actuel est neutre, avec un RSI inférieur à 50.
📈 Structure des EMA
20 EMA : 1,3505 $
50 EMA : 1,2836 $
100 EMA : 1,2550 $
200 EMA : 1,3546 $
XRP se situe actuellement sous la moyenne mobile (20 EMA) et la moyenne mobile (200 EMA), tandis que les moyennes mobiles (50 et 100 EMA) restent sous le prix. Reprendre la zone des 1,35 $ améliorerait la structure à court terme.
Point de vue technique sur XRP : XRP consolide près de 1,30 $ après un repli brutal
XRP évolue autour de 1,30 $ sur le graphique après un rejet net de la zone 1,35–1,43 $. Le prix est revenu vers la zone de cassure, tandis que le graphique global reste en phase de reprise depuis la zone 1,20–1,25 $. L’élan actuel est neutre, avec un RSI inférieur à 50.
📈 Structure des EMA
20 EMA : 1,3505 $
50 EMA : 1,2836 $
100 EMA : 1,2550 $
200 EMA : 1,3546 $
XRP se situe actuellement sous la moyenne mobile (20 EMA) et la moyenne mobile (200 EMA), tandis que les moyennes mobiles (50 et 100 EMA) restent sous le prix. Reprendre la zone des 1,35 $ améliorerait la structure à court terme.
📈 Structure des EMA
20 EMA : 1,3505 $
50 EMA : 1,2836 $
100 EMA : 1,2550 $
200 EMA : 1,3546 $
XRP se situe actuellement sous la moyenne mobile (20 EMA) et la moyenne mobile (200 EMA), tandis que les moyennes mobiles (50 et 100 EMA) restent sous le prix. Reprendre la zone des 1,35 $ améliorerait la structure à court terme.
1
3
787
·
--
Article
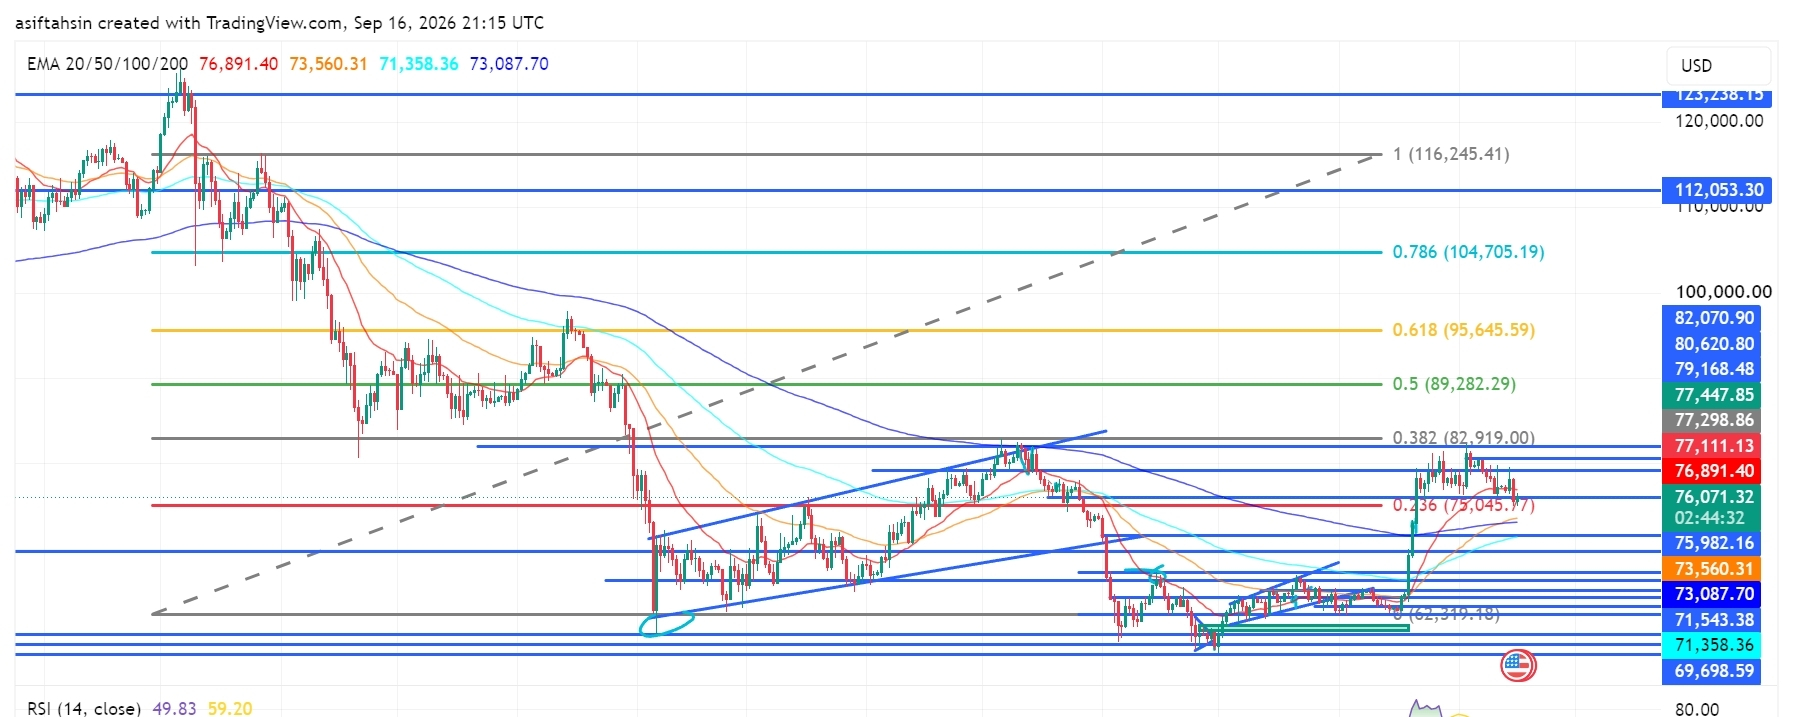
Perspectives techniques du BTC : Bitcoin consolide sous 77 K tandis que les haussiers défendent le redressementBitcoin évolue autour de 76,9 K $, consolidant après le récent rebond depuis la zone de demande des 69 K–71 K. Le prix reste au-dessus de la principale zone de support des 75 K, mais l’élan s’est refroidi alors que le BTC peine à rester sous la zone de résistance des 77,1 K–82,9 K. Le prochain cassage à la hausse ou la prochaine cassure à la baisse devraient déterminer la direction à court terme.
📈 Structure de l’EMA
20 EMA : 76,891 $
50 EMA : 73,560 $
100 EMA : 71,358 $
200 EMA : 73,088 $
Le BTC se situe actuellement autour de la 20 EMA, tandis que les EMA 50/100/200 restent sous le prix. Se maintenir au-dessus de 75 K permet de préserver la structure plus large du redressement, mais perdre la 20 EMA pourrait entraîner un retest plus profond.
Perspectives techniques du BTC : Bitcoin consolide sous 77 K tandis que les haussiers défendent le redressement
Bitcoin évolue autour de 76,9 K $, consolidant après le récent rebond depuis la zone de demande des 69 K–71 K. Le prix reste au-dessus de la principale zone de support des 75 K, mais l’élan s’est refroidi alors que le BTC peine à rester sous la zone de résistance des 77,1 K–82,9 K. Le prochain cassage à la hausse ou la prochaine cassure à la baisse devraient déterminer la direction à court terme.
📈 Structure de l’EMA
20 EMA : 76,891 $
50 EMA : 73,560 $
100 EMA : 71,358 $
200 EMA : 73,088 $
Le BTC se situe actuellement autour de la 20 EMA, tandis que les EMA 50/100/200 restent sous le prix. Se maintenir au-dessus de 75 K permet de préserver la structure plus large du redressement, mais perdre la 20 EMA pourrait entraîner un retest plus profond.
📈 Structure de l’EMA
20 EMA : 76,891 $
50 EMA : 73,560 $
100 EMA : 71,358 $
200 EMA : 73,088 $
Le BTC se situe actuellement autour de la 20 EMA, tandis que les EMA 50/100/200 restent sous le prix. Se maintenir au-dessus de 75 K permet de préserver la structure plus large du redressement, mais perdre la 20 EMA pourrait entraîner un retest plus profond.
61
·
--
Article
Voir la traduction
SOL Technical Outlook: Solana Holds Near $100 as Bulls Defend the BreakoutSOL is currently trading around $99.6, holding near the $99–$100 breakout zone after the recent bullish expansion from the $92–$94 demand area.
The broader recovery structure remains constructive, but SOL is now consolidating below the $100.59–$104.64 resistance cluster. Bulls need to reclaim this area and break the $107.07–$109.91 zone for the next major upside expansion.
📈 EMA Structure
20 EMA: $99.62
50 EMA: $92.58
100 EMA: $87.71
200 EMA: $91.88
SOL is currently testing the 20 EMA at $99.62.
The recovery above the 50 EMA at $92.58 and 200 EMA at $91.88 keeps the broader recovery structure intact.
A sustained hold above the 20 EMA would strengthen short-term momentum, while losing the $92.58–$91.88 area would weaken the current structure.
📐 Fibonacci Levels
Key Fibonacci levels:
0.236: $100.02
0.382: $129.49
0.5: $150.08
0.618: $170.67
0.786: $199.99
1.0: $237.33
SOL is currently testing the 0.236 Fibonacci region around $100.02.
The next major Fibonacci resistance is $129.49 — 0.382 Fib.
A sustained breakout above the $100–$107 resistance structure could open the path toward the $129.49 region.
🟢 Bullish Scenario
SOL is consolidating after the recent recovery and is currently building acceptance around the $99–$100 area.
Immediate resistance:
$100.02 — 0.236 Fibonacci
$100.59
$102.00
$102.29
$104.64
$107.07
$109.91
$111.04
A clean breakout and sustained close above $109.91–$111.04 would provide stronger confirmation of bullish continuation.
🎯 Target 1: $100.59
🎯 Target 2: $104.64
🎯 Target 3: $107.07
🎯 Target 4: $111.04
🎯 Target 5: $129.49 — 0.382 Fibonacci
🎯 Target 6: $150.08 — 0.5 Fibonacci
A confirmed breakout above the $109.91–$111.04 zone could strengthen the medium-term recovery structure and potentially accelerate SOL toward the $129–$150 region.
🔴 Pullback Scenario
After the recent bullish expansion, a retest of the breakout area would be normal.
Key supports:
$97.42
$96.33
$92.94
$92.58 — 50 EMA
$91.88 — 200 EMA
$87.71 — 100 EMA
The $92–$97 zone is particularly important.
If SOL continues to hold this area during a pullback, the current recovery structure remains valid.
A sustained loss of $91.88 would weaken the bullish setup and could expose the $87.71 support zone.
🧠 Market Structure & Liquidity
SOL has formed a clear recovery structure after sweeping liquidity around the $92–$94 demand region.
The recent move produced a market-structure shift followed by a breakout and higher-low formation.
SOL is now moving through an important:
Breakout → Retest → Consolidation → Continuation
structure.
The major upside liquidity is concentrated around $100–$111. A decisive breakout above this zone would place $129.49 as the next major Fibonacci target.
📊 RSI Momentum
RSI (14): 49.30
RSI has cooled back toward the neutral 50 level after the recent bullish expansion.
The current reading shows that short-term momentum is balanced rather than strongly overbought.
A sustained RSI move back above 50–55 would favor another bullish attempt toward the resistance zone.
A breakdown below 50 would indicate increasing short-term momentum weakness.
🎯 Key Levels
🔴 Major Resistance: $100.02 → $100.59 → $104.64 → $107.07 → $109.91 → $111.04
🟢 Major Support: $97.42 → $96.33 → $92.94 → $92.58 → $91.88
📉 Dynamic EMA Support: $92.58 — 50 EMA | $91.88 — 200 EMA | $87.71 — 100 EMA
🚀 Upside Targets: $111.04 → $129.49 → $150.08 → $170.67
📌 Final Outlook
SOL's broader structure remains constructive after the recent breakout, but price is currently consolidating around the $100 area and below the $100.59–$111 resistance zone.
The $92–$97 area is now the key short-term support region. As long as SOL holds above this zone, the current recovery structure remains active.
The immediate battle is around $100–$111. A confirmed breakout above $111.04 could open the path toward $129.49, followed by $150.08 and potentially $170.67.
However, rejection from resistance followed by a sustained loss of $91.88 would weaken the bullish structure and increase the risk of a deeper retracement toward the $87.71 area.
Bias: 🟢 Recovery structure intact above $91.88. A breakout above $111.04 could open the path toward $129.49, with $150.08 as the next major Fibonacci target.
$SOL
{future}(SOLUSDT)
SOL Technical Outlook: Solana Holds Near $100 as Bulls Defend the Breakout
SOL is currently trading around $99.6, holding near the $99–$100 breakout zone after the recent bullish expansion from the $92–$94 demand area.
The broader recovery structure remains constructive, but SOL is now consolidating below the $100.59–$104.64 resistance cluster. Bulls need to reclaim this area and break the $107.07–$109.91 zone for the next major upside expansion.
📈 EMA Structure
20 EMA: $99.62
50 EMA: $92.58
100 EMA: $87.71
200 EMA: $91.88
SOL is currently testing the 20 EMA at $99.62.
The recovery above the 50 EMA at $92.58 and 200 EMA at $91.88 keeps the broader recovery structure intact.
A sustained hold above the 20 EMA would strengthen short-term momentum, while losing the $92.58–$91.88 area would weaken the current structure.
📐 Fibonacci Levels
Key Fibonacci levels:
0.236: $100.02
0.382: $129.49
0.5: $150.08
0.618: $170.67
0.786: $199.99
1.0: $237.33
SOL is currently testing the 0.236 Fibonacci region around $100.02.
The next major Fibonacci resistance is $129.49 — 0.382 Fib.
A sustained breakout above the $100–$107 resistance structure could open the path toward the $129.49 region.
🟢 Bullish Scenario
SOL is consolidating after the recent recovery and is currently building acceptance around the $99–$100 area.
Immediate resistance:
$100.02 — 0.236 Fibonacci
$100.59
$102.00
$102.29
$104.64
$107.07
$109.91
$111.04
A clean breakout and sustained close above $109.91–$111.04 would provide stronger confirmation of bullish continuation.
🎯 Target 1: $100.59
🎯 Target 2: $104.64
🎯 Target 3: $107.07
🎯 Target 4: $111.04
🎯 Target 5: $129.49 — 0.382 Fibonacci
🎯 Target 6: $150.08 — 0.5 Fibonacci
A confirmed breakout above the $109.91–$111.04 zone could strengthen the medium-term recovery structure and potentially accelerate SOL toward the $129–$150 region.
🔴 Pullback Scenario
After the recent bullish expansion, a retest of the breakout area would be normal.
Key supports:
$97.42
$96.33
$92.94
$92.58 — 50 EMA
$91.88 — 200 EMA
$87.71 — 100 EMA
The $92–$97 zone is particularly important.
If SOL continues to hold this area during a pullback, the current recovery structure remains valid.
A sustained loss of $91.88 would weaken the bullish setup and could expose the $87.71 support zone.
🧠 Market Structure & Liquidity
SOL has formed a clear recovery structure after sweeping liquidity around the $92–$94 demand region.
The recent move produced a market-structure shift followed by a breakout and higher-low formation.
SOL is now moving through an important:
Breakout → Retest → Consolidation → Continuation
structure.
The major upside liquidity is concentrated around $100–$111. A decisive breakout above this zone would place $129.49 as the next major Fibonacci target.
📊 RSI Momentum
RSI (14): 49.30
RSI has cooled back toward the neutral 50 level after the recent bullish expansion.
The current reading shows that short-term momentum is balanced rather than strongly overbought.
A sustained RSI move back above 50–55 would favor another bullish attempt toward the resistance zone.
A breakdown below 50 would indicate increasing short-term momentum weakness.
🎯 Key Levels
🔴 Major Resistance: $100.02 → $100.59 → $104.64 → $107.07 → $109.91 → $111.04
🟢 Major Support: $97.42 → $96.33 → $92.94 → $92.58 → $91.88
📉 Dynamic EMA Support: $92.58 — 50 EMA | $91.88 — 200 EMA | $87.71 — 100 EMA
🚀 Upside Targets: $111.04 → $129.49 → $150.08 → $170.67
📌 Final Outlook
SOL's broader structure remains constructive after the recent breakout, but price is currently consolidating around the $100 area and below the $100.59–$111 resistance zone.
The $92–$97 area is now the key short-term support region. As long as SOL holds above this zone, the current recovery structure remains active.
The immediate battle is around $100–$111. A confirmed breakout above $111.04 could open the path toward $129.49, followed by $150.08 and potentially $170.67.
However, rejection from resistance followed by a sustained loss of $91.88 would weaken the bullish structure and increase the risk of a deeper retracement toward the $87.71 area.
Bias: 🟢 Recovery structure intact above $91.88. A breakout above $111.04 could open the path toward $129.49, with $150.08 as the next major Fibonacci target.
$SOL
The broader recovery structure remains constructive, but SOL is now consolidating below the $100.59–$104.64 resistance cluster. Bulls need to reclaim this area and break the $107.07–$109.91 zone for the next major upside expansion.
📈 EMA Structure
20 EMA: $99.62
50 EMA: $92.58
100 EMA: $87.71
200 EMA: $91.88
SOL is currently testing the 20 EMA at $99.62.
The recovery above the 50 EMA at $92.58 and 200 EMA at $91.88 keeps the broader recovery structure intact.
A sustained hold above the 20 EMA would strengthen short-term momentum, while losing the $92.58–$91.88 area would weaken the current structure.
📐 Fibonacci Levels
Key Fibonacci levels:
0.236: $100.02
0.382: $129.49
0.5: $150.08
0.618: $170.67
0.786: $199.99
1.0: $237.33
SOL is currently testing the 0.236 Fibonacci region around $100.02.
The next major Fibonacci resistance is $129.49 — 0.382 Fib.
A sustained breakout above the $100–$107 resistance structure could open the path toward the $129.49 region.
🟢 Bullish Scenario
SOL is consolidating after the recent recovery and is currently building acceptance around the $99–$100 area.
Immediate resistance:
$100.02 — 0.236 Fibonacci
$100.59
$102.00
$102.29
$104.64
$107.07
$109.91
$111.04
A clean breakout and sustained close above $109.91–$111.04 would provide stronger confirmation of bullish continuation.
🎯 Target 1: $100.59
🎯 Target 2: $104.64
🎯 Target 3: $107.07
🎯 Target 4: $111.04
🎯 Target 5: $129.49 — 0.382 Fibonacci
🎯 Target 6: $150.08 — 0.5 Fibonacci
A confirmed breakout above the $109.91–$111.04 zone could strengthen the medium-term recovery structure and potentially accelerate SOL toward the $129–$150 region.
🔴 Pullback Scenario
After the recent bullish expansion, a retest of the breakout area would be normal.
Key supports:
$97.42
$96.33
$92.94
$92.58 — 50 EMA
$91.88 — 200 EMA
$87.71 — 100 EMA
The $92–$97 zone is particularly important.
If SOL continues to hold this area during a pullback, the current recovery structure remains valid.
A sustained loss of $91.88 would weaken the bullish setup and could expose the $87.71 support zone.
🧠 Market Structure & Liquidity
SOL has formed a clear recovery structure after sweeping liquidity around the $92–$94 demand region.
The recent move produced a market-structure shift followed by a breakout and higher-low formation.
SOL is now moving through an important:
Breakout → Retest → Consolidation → Continuation
structure.
The major upside liquidity is concentrated around $100–$111. A decisive breakout above this zone would place $129.49 as the next major Fibonacci target.
📊 RSI Momentum
RSI (14): 49.30
RSI has cooled back toward the neutral 50 level after the recent bullish expansion.
The current reading shows that short-term momentum is balanced rather than strongly overbought.
A sustained RSI move back above 50–55 would favor another bullish attempt toward the resistance zone.
A breakdown below 50 would indicate increasing short-term momentum weakness.
🎯 Key Levels
🔴 Major Resistance: $100.02 → $100.59 → $104.64 → $107.07 → $109.91 → $111.04
🟢 Major Support: $97.42 → $96.33 → $92.94 → $92.58 → $91.88
📉 Dynamic EMA Support: $92.58 — 50 EMA | $91.88 — 200 EMA | $87.71 — 100 EMA
🚀 Upside Targets: $111.04 → $129.49 → $150.08 → $170.67
📌 Final Outlook
SOL's broader structure remains constructive after the recent breakout, but price is currently consolidating around the $100 area and below the $100.59–$111 resistance zone.
The $92–$97 area is now the key short-term support region. As long as SOL holds above this zone, the current recovery structure remains active.
The immediate battle is around $100–$111. A confirmed breakout above $111.04 could open the path toward $129.49, followed by $150.08 and potentially $170.67.
However, rejection from resistance followed by a sustained loss of $91.88 would weaken the bullish structure and increase the risk of a deeper retracement toward the $87.71 area.
Bias: 🟢 Recovery structure intact above $91.88. A breakout above $111.04 could open the path toward $129.49, with $150.08 as the next major Fibonacci target.
$SOL
62
·
--
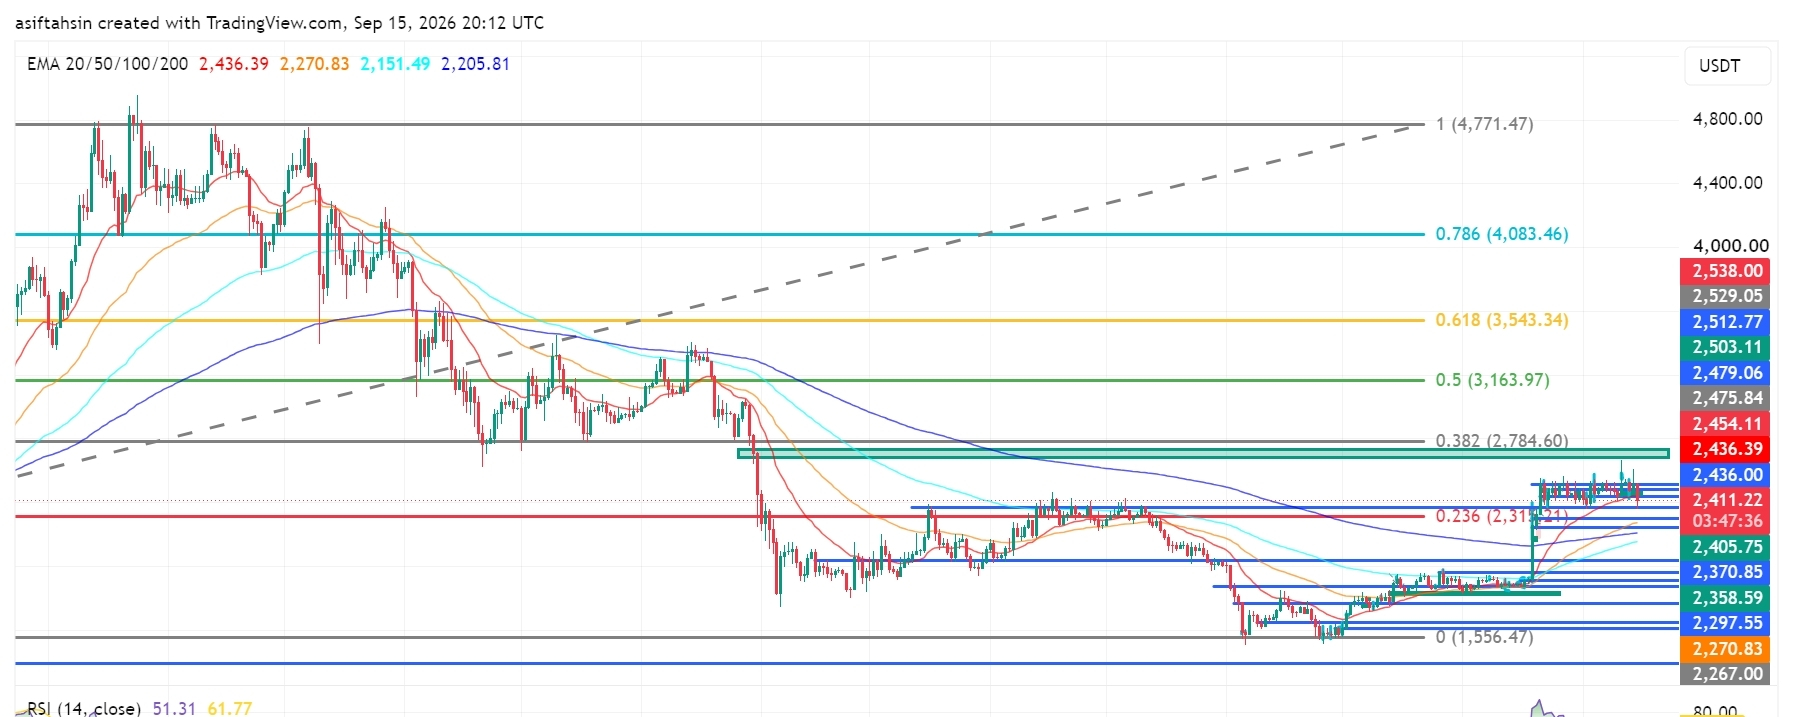
Article
Voir la traduction
ETH Technical Outlook: Ethereum Holds Above $2.4K as Bulls Defend the RecoveryETH is currently trading around $2.41K, holding above the $2.40K–$2.41K support area after the recent recovery from the $2.27K–$2.30K demand zone.
The broader recovery structure remains constructive, but ETH is now consolidating below the $2.436K–$2.454K resistance cluster. Bulls need to reclaim this area and break $2,538 for the next major upside expansion.
📈 EMA Structure
20 EMA: $2,436.39
50 EMA: $2,270.83
100 EMA: $2,151.49
200 EMA: $2,205.81
ETH remains above the 50, 100 and 200 EMAs.
The 20 EMA at $2,436.39 is currently the key short-term resistance. A sustained reclaim above this level would strengthen the bullish recovery structure.
The 200 EMA at $2,205.81 remains an important dynamic support.
📐 Fibonacci Levels
Key Fibonacci levels:
0.236: $2,315.21
0.382: $2,784.60
0.5: $3,163.97
0.618: $3,543.34
0.786: $4,083.46
1.0: $4,771.47
ETH has reclaimed the 0.236 Fibonacci region at $2,315.21, while the next major Fibonacci resistance is $2,784.60 — 0.382 Fib.
A sustained breakout above the current resistance structure could open the path toward the $2.78K region.
🟢 Bullish Scenario
ETH is consolidating after the recent recovery and is currently building acceptance around the $2.4K area.
Immediate resistance:
$2,436.39 — 20 EMA
$2,454.11
$2,475.84
$2,503.11
$2,512.77
$2,529.05
$2,538.00
A clean breakout and sustained close above $2,538 would provide stronger confirmation of bullish continuation.
🎯 Target 1: $2,475.84
🎯 Target 2: $2,503.11
🎯 Target 3: $2,538
🎯 Target 4: $2,784.60 — 0.382 Fibonacci
🎯 Target 5: $3,163.97 — 0.5 Fibonacci
A confirmed breakout above $2,538 could strengthen the medium-term structure and potentially accelerate ETH toward the $2.78K–$3.16K region.
🔴 Pullback Scenario
After the recent recovery, consolidation or a retest of the breakout area would be normal.
Key supports:
$2,405.75
$2,370.85
$2,358.59
$2,297.55
$2,270.83 — 50 EMA
$2,205.81 — 200 EMA
$2,151.49 — 100 EMA
The $2,358–$2,405 zone is particularly important.
If ETH continues to hold this area during a pullback, the current recovery structure remains valid.
A sustained loss of $2,315.21 would weaken the bullish setup and could expose the $2,270–$2,205 support zone.
🧠 Market Structure & Liquidity
ETH has formed a clear recovery structure after sweeping liquidity around the $2.27K–$2.30K demand region.
The recent move produced a market-structure shift followed by a breakout and higher-low formation.
ETH is now moving through an important:
Breakout → Retest → Consolidation → Continuation
structure.
The major upside liquidity remains around $2,436–$2,538. A decisive breakout above this zone would place $2,784.60 as the next major Fibonacci target.
📊 RSI Momentum
RSI (14): 51.31
RSI has cooled toward the neutral 50 level, showing that short-term momentum has weakened after the previous recovery.
A sustained RSI hold above 50–55 would favor another bullish attempt toward the resistance zone.
A breakdown below 50 would indicate increasing short-term momentum weakness.
🎯 Key Levels
🔴 Major Resistance: $2,436.39 → $2,454.11 → $2,475.84 → $2,503.11 → $2,538
🟢 Major Support: $2,405.75 → $2,370.85 → $2,358.59 → $2,297.55
📉 Dynamic EMA Support: $2,270.83 — 50 EMA | $2,205.81 — 200 EMA
🚀 Upside Targets: $2,538 → $2,784.60 → $3,163.97 → $3,543.34
📌 Final Outlook
ETH's broader structure remains constructive after the recent recovery, but price is currently consolidating below the $2.436K–$2.538K resistance zone.
The $2.358K–$2.405K area is now the key short-term support region. As long as ETH holds above this zone, the current recovery structure remains active.
The immediate battle is around $2,436–$2,538. A confirmed breakout above $2,538 could open the path toward $2,784.60, followed by $3,163.97 and potentially $3,543.34.
However, rejection from resistance followed by a sustained loss of $2,315.21 would weaken the bullish structure and increase the risk of a deeper retracement toward the $2,270–$2,205 area.
Bias: 🟢 Bullish above $2,315.21. A breakout above $2,538 could open the path toward $2,784.60, with $3,163.97 as the next major Fibonacci target.
$ETH
{future}(ETHUSDT)
ETH Technical Outlook: Ethereum Holds Above $2.4K as Bulls Defend the Recovery
ETH is currently trading around $2.41K, holding above the $2.40K–$2.41K support area after the recent recovery from the $2.27K–$2.30K demand zone.
The broader recovery structure remains constructive, but ETH is now consolidating below the $2.436K–$2.454K resistance cluster. Bulls need to reclaim this area and break $2,538 for the next major upside expansion.
📈 EMA Structure
20 EMA: $2,436.39
50 EMA: $2,270.83
100 EMA: $2,151.49
200 EMA: $2,205.81
ETH remains above the 50, 100 and 200 EMAs.
The 20 EMA at $2,436.39 is currently the key short-term resistance. A sustained reclaim above this level would strengthen the bullish recovery structure.
The 200 EMA at $2,205.81 remains an important dynamic support.
📐 Fibonacci Levels
Key Fibonacci levels:
0.236: $2,315.21
0.382: $2,784.60
0.5: $3,163.97
0.618: $3,543.34
0.786: $4,083.46
1.0: $4,771.47
ETH has reclaimed the 0.236 Fibonacci region at $2,315.21, while the next major Fibonacci resistance is $2,784.60 — 0.382 Fib.
A sustained breakout above the current resistance structure could open the path toward the $2.78K region.
🟢 Bullish Scenario
ETH is consolidating after the recent recovery and is currently building acceptance around the $2.4K area.
Immediate resistance:
$2,436.39 — 20 EMA
$2,454.11
$2,475.84
$2,503.11
$2,512.77
$2,529.05
$2,538.00
A clean breakout and sustained close above $2,538 would provide stronger confirmation of bullish continuation.
🎯 Target 1: $2,475.84
🎯 Target 2: $2,503.11
🎯 Target 3: $2,538
🎯 Target 4: $2,784.60 — 0.382 Fibonacci
🎯 Target 5: $3,163.97 — 0.5 Fibonacci
A confirmed breakout above $2,538 could strengthen the medium-term structure and potentially accelerate ETH toward the $2.78K–$3.16K region.
🔴 Pullback Scenario
After the recent recovery, consolidation or a retest of the breakout area would be normal.
Key supports:
$2,405.75
$2,370.85
$2,358.59
$2,297.55
$2,270.83 — 50 EMA
$2,205.81 — 200 EMA
$2,151.49 — 100 EMA
The $2,358–$2,405 zone is particularly important.
If ETH continues to hold this area during a pullback, the current recovery structure remains valid.
A sustained loss of $2,315.21 would weaken the bullish setup and could expose the $2,270–$2,205 support zone.
🧠 Market Structure & Liquidity
ETH has formed a clear recovery structure after sweeping liquidity around the $2.27K–$2.30K demand region.
The recent move produced a market-structure shift followed by a breakout and higher-low formation.
ETH is now moving through an important:
Breakout → Retest → Consolidation → Continuation
structure.
The major upside liquidity remains around $2,436–$2,538. A decisive breakout above this zone would place $2,784.60 as the next major Fibonacci target.
📊 RSI Momentum
RSI (14): 51.31
RSI has cooled toward the neutral 50 level, showing that short-term momentum has weakened after the previous recovery.
A sustained RSI hold above 50–55 would favor another bullish attempt toward the resistance zone.
A breakdown below 50 would indicate increasing short-term momentum weakness.
🎯 Key Levels
🔴 Major Resistance: $2,436.39 → $2,454.11 → $2,475.84 → $2,503.11 → $2,538
🟢 Major Support: $2,405.75 → $2,370.85 → $2,358.59 → $2,297.55
📉 Dynamic EMA Support: $2,270.83 — 50 EMA | $2,205.81 — 200 EMA
🚀 Upside Targets: $2,538 → $2,784.60 → $3,163.97 → $3,543.34
📌 Final Outlook
ETH's broader structure remains constructive after the recent recovery, but price is currently consolidating below the $2.436K–$2.538K resistance zone.
The $2.358K–$2.405K area is now the key short-term support region. As long as ETH holds above this zone, the current recovery structure remains active.
The immediate battle is around $2,436–$2,538. A confirmed breakout above $2,538 could open the path toward $2,784.60, followed by $3,163.97 and potentially $3,543.34.
However, rejection from resistance followed by a sustained loss of $2,315.21 would weaken the bullish structure and increase the risk of a deeper retracement toward the $2,270–$2,205 area.
Bias: 🟢 Bullish above $2,315.21. A breakout above $2,538 could open the path toward $2,784.60, with $3,163.97 as the next major Fibonacci target.
$ETH
The broader recovery structure remains constructive, but ETH is now consolidating below the $2.436K–$2.454K resistance cluster. Bulls need to reclaim this area and break $2,538 for the next major upside expansion.
📈 EMA Structure
20 EMA: $2,436.39
50 EMA: $2,270.83
100 EMA: $2,151.49
200 EMA: $2,205.81
ETH remains above the 50, 100 and 200 EMAs.
The 20 EMA at $2,436.39 is currently the key short-term resistance. A sustained reclaim above this level would strengthen the bullish recovery structure.
The 200 EMA at $2,205.81 remains an important dynamic support.
📐 Fibonacci Levels
Key Fibonacci levels:
0.236: $2,315.21
0.382: $2,784.60
0.5: $3,163.97
0.618: $3,543.34
0.786: $4,083.46
1.0: $4,771.47
ETH has reclaimed the 0.236 Fibonacci region at $2,315.21, while the next major Fibonacci resistance is $2,784.60 — 0.382 Fib.
A sustained breakout above the current resistance structure could open the path toward the $2.78K region.
🟢 Bullish Scenario
ETH is consolidating after the recent recovery and is currently building acceptance around the $2.4K area.
Immediate resistance:
$2,436.39 — 20 EMA
$2,454.11
$2,475.84
$2,503.11
$2,512.77
$2,529.05
$2,538.00
A clean breakout and sustained close above $2,538 would provide stronger confirmation of bullish continuation.
🎯 Target 1: $2,475.84
🎯 Target 2: $2,503.11
🎯 Target 3: $2,538
🎯 Target 4: $2,784.60 — 0.382 Fibonacci
🎯 Target 5: $3,163.97 — 0.5 Fibonacci
A confirmed breakout above $2,538 could strengthen the medium-term structure and potentially accelerate ETH toward the $2.78K–$3.16K region.
🔴 Pullback Scenario
After the recent recovery, consolidation or a retest of the breakout area would be normal.
Key supports:
$2,405.75
$2,370.85
$2,358.59
$2,297.55
$2,270.83 — 50 EMA
$2,205.81 — 200 EMA
$2,151.49 — 100 EMA
The $2,358–$2,405 zone is particularly important.
If ETH continues to hold this area during a pullback, the current recovery structure remains valid.
A sustained loss of $2,315.21 would weaken the bullish setup and could expose the $2,270–$2,205 support zone.
🧠 Market Structure & Liquidity
ETH has formed a clear recovery structure after sweeping liquidity around the $2.27K–$2.30K demand region.
The recent move produced a market-structure shift followed by a breakout and higher-low formation.
ETH is now moving through an important:
Breakout → Retest → Consolidation → Continuation
structure.
The major upside liquidity remains around $2,436–$2,538. A decisive breakout above this zone would place $2,784.60 as the next major Fibonacci target.
📊 RSI Momentum
RSI (14): 51.31
RSI has cooled toward the neutral 50 level, showing that short-term momentum has weakened after the previous recovery.
A sustained RSI hold above 50–55 would favor another bullish attempt toward the resistance zone.
A breakdown below 50 would indicate increasing short-term momentum weakness.
🎯 Key Levels
🔴 Major Resistance: $2,436.39 → $2,454.11 → $2,475.84 → $2,503.11 → $2,538
🟢 Major Support: $2,405.75 → $2,370.85 → $2,358.59 → $2,297.55
📉 Dynamic EMA Support: $2,270.83 — 50 EMA | $2,205.81 — 200 EMA
🚀 Upside Targets: $2,538 → $2,784.60 → $3,163.97 → $3,543.34
📌 Final Outlook
ETH's broader structure remains constructive after the recent recovery, but price is currently consolidating below the $2.436K–$2.538K resistance zone.
The $2.358K–$2.405K area is now the key short-term support region. As long as ETH holds above this zone, the current recovery structure remains active.
The immediate battle is around $2,436–$2,538. A confirmed breakout above $2,538 could open the path toward $2,784.60, followed by $3,163.97 and potentially $3,543.34.
However, rejection from resistance followed by a sustained loss of $2,315.21 would weaken the bullish structure and increase the risk of a deeper retracement toward the $2,270–$2,205 area.
Bias: 🟢 Bullish above $2,315.21. A breakout above $2,538 could open the path toward $2,784.60, with $3,163.97 as the next major Fibonacci target.
$ETH
63
·
--
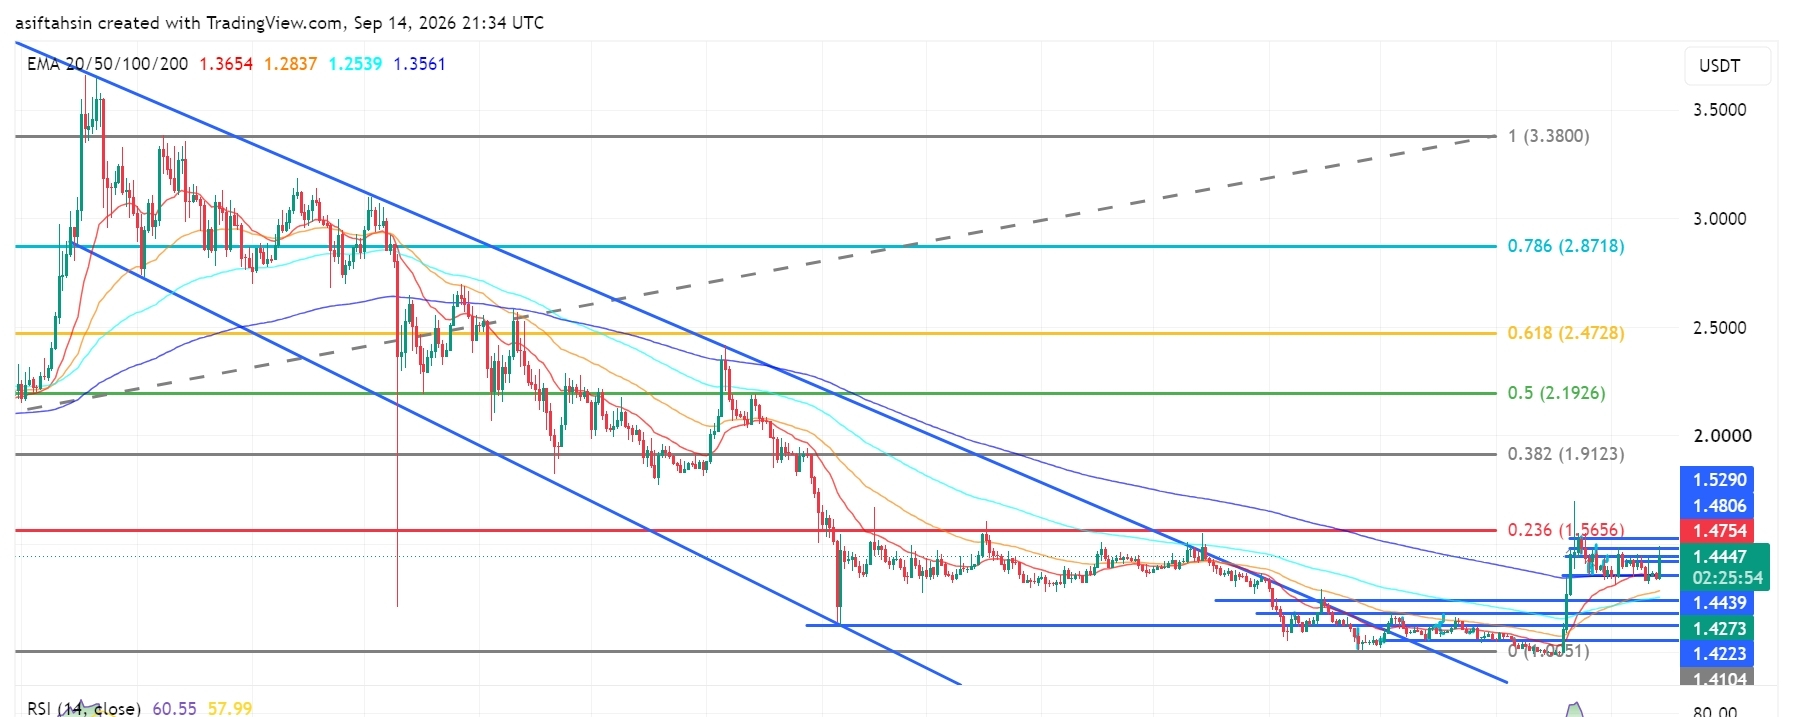
Article
Perspectives techniques de XRP : XRP reste au-dessus de 1,40 $ alors que les haussiers visent 1,56 $XRP se négocie actuellement autour de 1,44 $, consolidant au-dessus du niveau psychologique important des 1,40 $ après un fort rebond depuis les plus bas de juin–juillet.
La structure globale s’est nettement améliorée, avec XRP désormais en hausse au-dessus des quatre principales EMA. Cependant, le prix s’approche d’un important groupe de résistance autour de 1,475–1,53 $. Les haussiers doivent réaliser une cassure nette au-dessus de cette zone pour ouvrir la voie vers la résistance Fibonacci à 1,5656.
📈 Structure des EMA
EMA 20 : 1,3653 $
EMA 50 : 1,2837 $
EMA 100 : 1,2539 $
EMA 200 : 1,3561 $
Perspectives techniques de XRP : XRP reste au-dessus de 1,40 $ alors que les haussiers visent 1,56 $
XRP se négocie actuellement autour de 1,44 $, consolidant au-dessus du niveau psychologique important des 1,40 $ après un fort rebond depuis les plus bas de juin–juillet.
La structure globale s’est nettement améliorée, avec XRP désormais en hausse au-dessus des quatre principales EMA. Cependant, le prix s’approche d’un important groupe de résistance autour de 1,475–1,53 $. Les haussiers doivent réaliser une cassure nette au-dessus de cette zone pour ouvrir la voie vers la résistance Fibonacci à 1,5656.
📈 Structure des EMA
EMA 20 : 1,3653 $
EMA 50 : 1,2837 $
EMA 100 : 1,2539 $
EMA 200 : 1,3561 $
La structure globale s’est nettement améliorée, avec XRP désormais en hausse au-dessus des quatre principales EMA. Cependant, le prix s’approche d’un important groupe de résistance autour de 1,475–1,53 $. Les haussiers doivent réaliser une cassure nette au-dessus de cette zone pour ouvrir la voie vers la résistance Fibonacci à 1,5656.
📈 Structure des EMA
EMA 20 : 1,3653 $
EMA 50 : 1,2837 $
EMA 100 : 1,2539 $
EMA 200 : 1,3561 $
2
1
1.2k
·
--
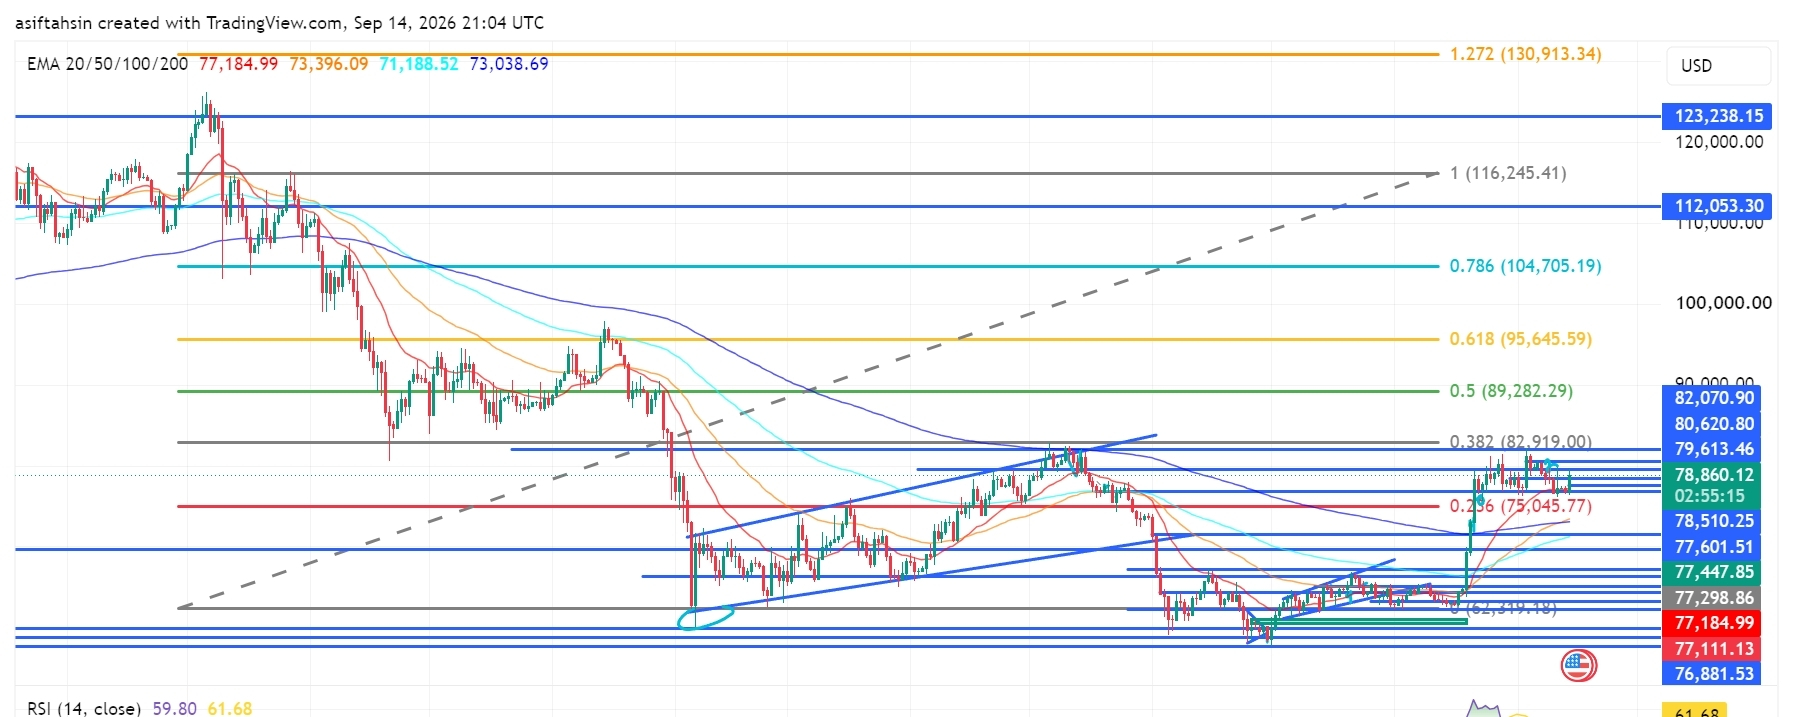
Article
Voir la traduction
Bitcoin (BTC) Technical Outlook: BTC Holds Above $78K as Bulls Target $80K–$83K ResistanceBTC is currently trading around $78,860, consolidating above the $78K level after a strong recovery from the June lows.
The broader structure remains constructive, with BTC trading above all four major EMAs. However, price is now approaching a significant resistance cluster around $79,613–$82,070. Bulls need a clean breakout above this zone to open the path toward the $82,919 Fibonacci resistance and potentially higher levels.
📈 EMA Structure
20 EMA: $77,182.98
50 EMA: $73,395.26
100 EMA: $71,188.10
200 EMA: $73,038.48
BTC remains above all four major EMAs, keeping the medium-term recovery structure bullish.
The $77,182.98 20 EMA is now the key dynamic support. As long as BTC remains above this level, buyers maintain control of the current recovery.
📐 Fibonacci Levels
0.236: $75,045.77
0.382: $82,919.00
0.5: $89,282.29
0.618: $95,645.59
0.786: $104,705.19
1.0: $116,245.41
1.272: $130,913.34
The $82,919 0.382 Fibonacci level is the next major upside objective after the current resistance cluster.
🟢 Bullish Scenario
BTC is consolidating just below the $79,613–$82,070 resistance area.
A clean breakout and sustained close above $82,070 could trigger another bullish expansion.
🎯 Target 1: $82,070
🎯 Target 2: $82,919
🎯 Target 3: $89,282
🎯 Target 4: $95,645
🎯 Target 5: $104,705
🎯 Target 6: $116,245
A decisive reclaim of $82,919 would be an important confirmation that BTC is transitioning into a stronger medium-term recovery phase.
🔴 Pullback Scenario
If BTC fails to break the $79,613–$82,070 resistance cluster, a short-term pullback could develop.
Key supports:
$78,510.25
$77,601.51
$77,447.85
$77,298.86
$77,182.98 — 20 EMA
$77,111.13
$76,881.53
$75,045.77 — 0.236 Fib
The $77,600–$77,180 region is particularly important. A successful retest here could provide a base for another attempt at the $80K+ resistance zone.
A sustained break below the 20 EMA at $77,182.98 would weaken the short-term bullish structure.
🧠 Market Structure & Liquidity
BTC's recent structure can be viewed as:
Liquidity Sweep → Accumulation → Higher Lows → Breakout → Reclaim → Consolidation → Potential Continuation
The June low created a major liquidity event, followed by accumulation and a gradual recovery.
BTC subsequently broke higher from the July–August consolidation structure and reclaimed the $75K area. Price is now consolidating near $79K, with the next major structural test sitting between $79,613 and $82,070.
A breakout above this region would put the $82,919 Fibonacci level into focus.
📊 RSI Momentum
RSI: 59.80
RSI MA: 61.68
RSI remains above 50, confirming that bullish momentum is still present.
However, RSI is currently slightly below its moving average, suggesting that momentum has cooled from the recent upside move. A renewed move above 62–65 would strengthen the continuation setup.
🎯 Key Levels
Resistance:
$79,613.46 → $80,620.80 → $82,070.90 → $82,919 → $89,282.29 → $95,645.59
Support:
$78,510.25 → $77,601.51 → $77,447.85 → $77,298.86 → $77,182.98 → $77,111.13 → $76,881.53 → $75,045.77
📌 Final Outlook
BTC remains in a constructive recovery structure while holding above the $77K area and all four major EMAs.
The immediate battle is $79,613–$82,070. A decisive breakout above this zone could push BTC toward $82,919 → $89,282 → $95,645, while a sustained reclaim of $82,919 could open the path toward the higher Fibonacci levels.
On the downside, $77,182.98 is the key dynamic support. As long as BTC holds above this level, the broader bullish recovery remains intact.
Bias: 🟢 Bullish above $77,183 | Stronger above $82,070
$BTC
{future}(BTCUSDT)
Bitcoin (BTC) Technical Outlook: BTC Holds Above $78K as Bulls Target $80K–$83K Resistance
BTC is currently trading around $78,860, consolidating above the $78K level after a strong recovery from the June lows.
The broader structure remains constructive, with BTC trading above all four major EMAs. However, price is now approaching a significant resistance cluster around $79,613–$82,070. Bulls need a clean breakout above this zone to open the path toward the $82,919 Fibonacci resistance and potentially higher levels.
📈 EMA Structure
20 EMA: $77,182.98
50 EMA: $73,395.26
100 EMA: $71,188.10
200 EMA: $73,038.48
BTC remains above all four major EMAs, keeping the medium-term recovery structure bullish.
The $77,182.98 20 EMA is now the key dynamic support. As long as BTC remains above this level, buyers maintain control of the current recovery.
📐 Fibonacci Levels
0.236: $75,045.77
0.382: $82,919.00
0.5: $89,282.29
0.618: $95,645.59
0.786: $104,705.19
1.0: $116,245.41
1.272: $130,913.34
The $82,919 0.382 Fibonacci level is the next major upside objective after the current resistance cluster.
🟢 Bullish Scenario
BTC is consolidating just below the $79,613–$82,070 resistance area.
A clean breakout and sustained close above $82,070 could trigger another bullish expansion.
🎯 Target 1: $82,070
🎯 Target 2: $82,919
🎯 Target 3: $89,282
🎯 Target 4: $95,645
🎯 Target 5: $104,705
🎯 Target 6: $116,245
A decisive reclaim of $82,919 would be an important confirmation that BTC is transitioning into a stronger medium-term recovery phase.
🔴 Pullback Scenario
If BTC fails to break the $79,613–$82,070 resistance cluster, a short-term pullback could develop.
Key supports:
$78,510.25
$77,601.51
$77,447.85
$77,298.86
$77,182.98 — 20 EMA
$77,111.13
$76,881.53
$75,045.77 — 0.236 Fib
The $77,600–$77,180 region is particularly important. A successful retest here could provide a base for another attempt at the $80K+ resistance zone.
A sustained break below the 20 EMA at $77,182.98 would weaken the short-term bullish structure.
🧠 Market Structure & Liquidity
BTC's recent structure can be viewed as:
Liquidity Sweep → Accumulation → Higher Lows → Breakout → Reclaim → Consolidation → Potential Continuation
The June low created a major liquidity event, followed by accumulation and a gradual recovery.
BTC subsequently broke higher from the July–August consolidation structure and reclaimed the $75K area. Price is now consolidating near $79K, with the next major structural test sitting between $79,613 and $82,070.
A breakout above this region would put the $82,919 Fibonacci level into focus.
📊 RSI Momentum
RSI: 59.80
RSI MA: 61.68
RSI remains above 50, confirming that bullish momentum is still present.
However, RSI is currently slightly below its moving average, suggesting that momentum has cooled from the recent upside move. A renewed move above 62–65 would strengthen the continuation setup.
🎯 Key Levels
Resistance:
$79,613.46 → $80,620.80 → $82,070.90 → $82,919 → $89,282.29 → $95,645.59
Support:
$78,510.25 → $77,601.51 → $77,447.85 → $77,298.86 → $77,182.98 → $77,111.13 → $76,881.53 → $75,045.77
📌 Final Outlook
BTC remains in a constructive recovery structure while holding above the $77K area and all four major EMAs.
The immediate battle is $79,613–$82,070. A decisive breakout above this zone could push BTC toward $82,919 → $89,282 → $95,645, while a sustained reclaim of $82,919 could open the path toward the higher Fibonacci levels.
On the downside, $77,182.98 is the key dynamic support. As long as BTC holds above this level, the broader bullish recovery remains intact.
Bias: 🟢 Bullish above $77,183 | Stronger above $82,070
$BTC
The broader structure remains constructive, with BTC trading above all four major EMAs. However, price is now approaching a significant resistance cluster around $79,613–$82,070. Bulls need a clean breakout above this zone to open the path toward the $82,919 Fibonacci resistance and potentially higher levels.
📈 EMA Structure
20 EMA: $77,182.98
50 EMA: $73,395.26
100 EMA: $71,188.10
200 EMA: $73,038.48
BTC remains above all four major EMAs, keeping the medium-term recovery structure bullish.
The $77,182.98 20 EMA is now the key dynamic support. As long as BTC remains above this level, buyers maintain control of the current recovery.
📐 Fibonacci Levels
0.236: $75,045.77
0.382: $82,919.00
0.5: $89,282.29
0.618: $95,645.59
0.786: $104,705.19
1.0: $116,245.41
1.272: $130,913.34
The $82,919 0.382 Fibonacci level is the next major upside objective after the current resistance cluster.
🟢 Bullish Scenario
BTC is consolidating just below the $79,613–$82,070 resistance area.
A clean breakout and sustained close above $82,070 could trigger another bullish expansion.
🎯 Target 1: $82,070
🎯 Target 2: $82,919
🎯 Target 3: $89,282
🎯 Target 4: $95,645
🎯 Target 5: $104,705
🎯 Target 6: $116,245
A decisive reclaim of $82,919 would be an important confirmation that BTC is transitioning into a stronger medium-term recovery phase.
🔴 Pullback Scenario
If BTC fails to break the $79,613–$82,070 resistance cluster, a short-term pullback could develop.
Key supports:
$78,510.25
$77,601.51
$77,447.85
$77,298.86
$77,182.98 — 20 EMA
$77,111.13
$76,881.53
$75,045.77 — 0.236 Fib
The $77,600–$77,180 region is particularly important. A successful retest here could provide a base for another attempt at the $80K+ resistance zone.
A sustained break below the 20 EMA at $77,182.98 would weaken the short-term bullish structure.
🧠 Market Structure & Liquidity
BTC's recent structure can be viewed as:
Liquidity Sweep → Accumulation → Higher Lows → Breakout → Reclaim → Consolidation → Potential Continuation
The June low created a major liquidity event, followed by accumulation and a gradual recovery.
BTC subsequently broke higher from the July–August consolidation structure and reclaimed the $75K area. Price is now consolidating near $79K, with the next major structural test sitting between $79,613 and $82,070.
A breakout above this region would put the $82,919 Fibonacci level into focus.
📊 RSI Momentum
RSI: 59.80
RSI MA: 61.68
RSI remains above 50, confirming that bullish momentum is still present.
However, RSI is currently slightly below its moving average, suggesting that momentum has cooled from the recent upside move. A renewed move above 62–65 would strengthen the continuation setup.
🎯 Key Levels
Resistance:
$79,613.46 → $80,620.80 → $82,070.90 → $82,919 → $89,282.29 → $95,645.59
Support:
$78,510.25 → $77,601.51 → $77,447.85 → $77,298.86 → $77,182.98 → $77,111.13 → $76,881.53 → $75,045.77
📌 Final Outlook
BTC remains in a constructive recovery structure while holding above the $77K area and all four major EMAs.
The immediate battle is $79,613–$82,070. A decisive breakout above this zone could push BTC toward $82,919 → $89,282 → $95,645, while a sustained reclaim of $82,919 could open the path toward the higher Fibonacci levels.
On the downside, $77,182.98 is the key dynamic support. As long as BTC holds above this level, the broader bullish recovery remains intact.
Bias: 🟢 Bullish above $77,183 | Stronger above $82,070
$BTC
69
·
--
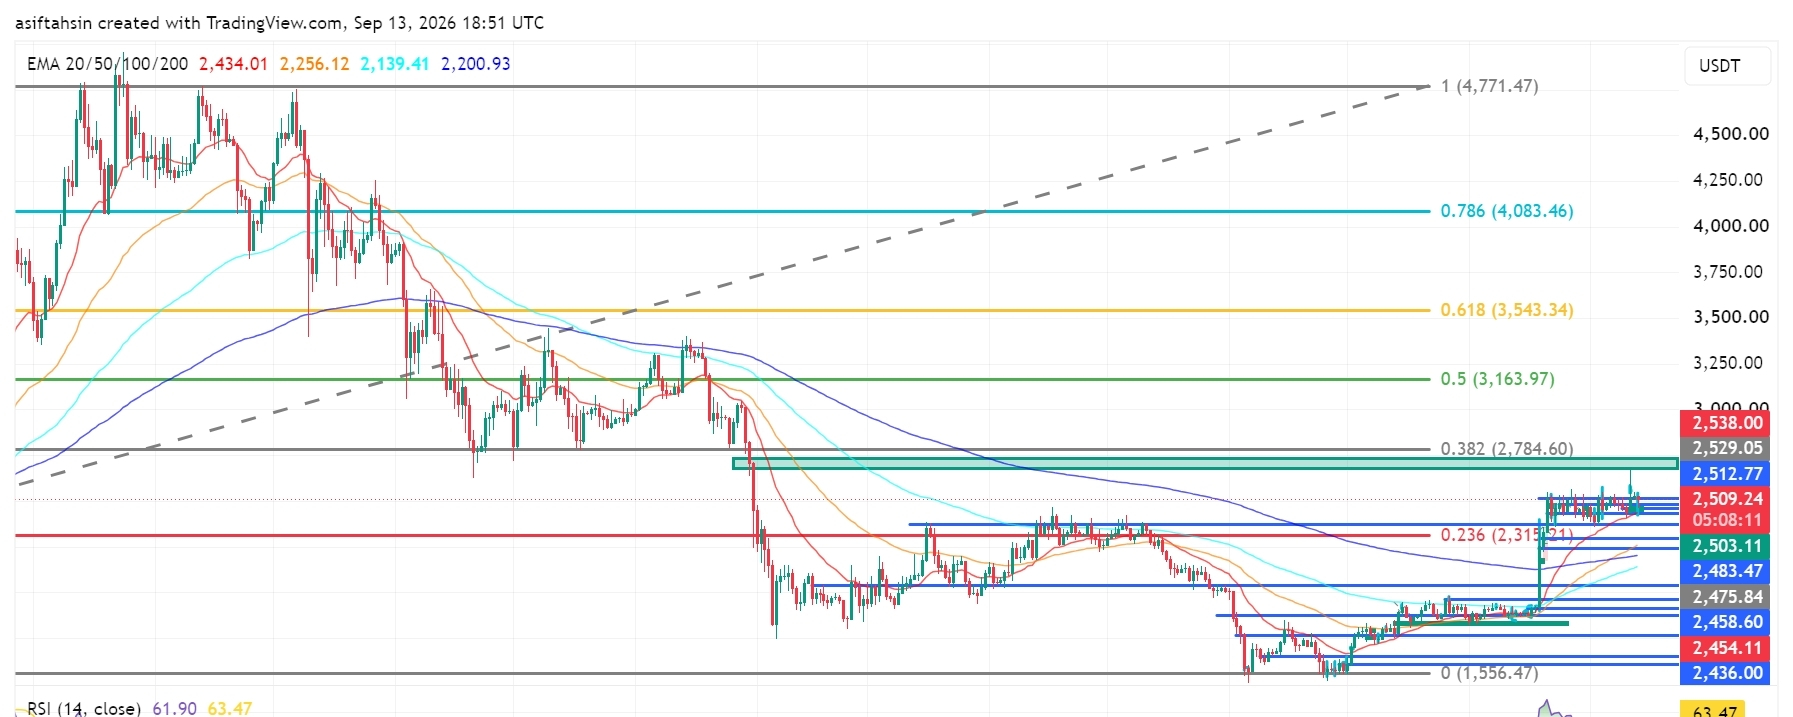
Article
Voir la traduction
Solana (SOL) Technical Outlook: SOL Holds Above $100 as Bulls Target Higher ResistanceSOL is currently trading around $101.25, consolidating above the psychological $100 level after a strong recovery from the June lows.
The broader structure is showing signs of improvement, with SOL now trading above all four major EMAs. However, price is facing a significant resistance cluster around $102.29–$104.64. Bulls need a clean breakout above this zone to open the path toward the $107–$109 area and the $129.49 Fibonacci resistance.
📈 EMA Structure
20 EMA: $99.76
50 EMA: $92.04
100 EMA: $87.25
200 EMA: $91.74
SOL is currently trading above all four major EMAs, supporting the ongoing recovery structure.
The $99.76 20 EMA is the key dynamic support. As long as SOL remains above this level, buyers maintain control of the current short-term structure.
📐 Fibonacci Levels
0.236: $104.00
0.382: $129.49
0.5: $150.08
0.618: $170.67
0.786: $199.99
1.0: $237.33
The $104.00 0.236 Fibonacci level is the immediate major resistance. A successful reclaim could strengthen the path toward $129.49.
🟢 Bullish Scenario
SOL is consolidating around the $100–$102 region after recovering from the recent lows.
A clean breakout and sustained close above $104.64 could trigger another bullish expansion.
🎯 Target 1: $107.07
🎯 Target 2: $109.84
🎯 Target 3: $112.00
🎯 Target 4: $129.49
🎯 Target 5: $150.08
🎯 Target 6: $170.67
A decisive reclaim of $129.49 would be an important confirmation that SOL is transitioning into a stronger medium-term recovery phase.
🔴 Pullback Scenario
If SOL fails to break the $102.29–$104.64 resistance cluster, a short-term pullback could develop.
Key supports:
$100.59
$99.76
$96.33
$92.94
$92.04
$91.74 — 200 EMA
$87.25 — 100 EMA
$86.69
The $100.59–$99.76 region is particularly important. A successful retest here could provide a base for another attempt at the $104 resistance.
A sustained break below the 20 EMA at $99.76 would weaken the short-term bullish structure.
🧠 Market Structure & Liquidity
SOL's recent structure can be viewed as:
Liquidity Sweep → Accumulation → Higher Lows → MSS/BOS → Breakout → Reclaim → Consolidation → Potential Continuation
The June low created a major liquidity event, followed by a prolonged accumulation phase and gradual recovery.
SOL has now reclaimed the $100 psychological level and is holding above the major EMA cluster.
The next major structural test is $102.29–$104.64, followed by the $107–$112 resistance area.
📊 RSI Momentum
RSI: 56.24
RSI MA: 61.94
RSI remains above 50, indicating that bullish momentum is still present.
However, RSI is currently below its moving average, suggesting that momentum has cooled from the recent upside move. A renewed push above 60–62 would strengthen the continuation setup.
🎯 Key Levels
Resistance:
$102.29 → $104.00 → $104.64 → $107.07 → $109.84 → $112.00 → $129.49
Support:
$100.59 → $99.76 → $96.33 → $92.94 → $92.04 → $91.74 → $87.25 → $86.69
📌 Final Outlook
SOL remains in a constructive recovery structure while holding above the $100 area and all major EMAs.
The immediate battle is $102.29–$104.64. A decisive breakout above this zone could push SOL toward $107 → $109.84 → $112, while a sustained move beyond these levels could open the path toward $129.49.
On the downside, $99.76 is the key dynamic support. As long as SOL holds above this level, the broader recovery structure remains intact.
Bias: 🟢 Bullish above $99.76 | Stronger above $104.64
$SOL
{future}(SOLUSDT)
Solana (SOL) Technical Outlook: SOL Holds Above $100 as Bulls Target Higher Resistance
SOL is currently trading around $101.25, consolidating above the psychological $100 level after a strong recovery from the June lows.
The broader structure is showing signs of improvement, with SOL now trading above all four major EMAs. However, price is facing a significant resistance cluster around $102.29–$104.64. Bulls need a clean breakout above this zone to open the path toward the $107–$109 area and the $129.49 Fibonacci resistance.
📈 EMA Structure
20 EMA: $99.76
50 EMA: $92.04
100 EMA: $87.25
200 EMA: $91.74
SOL is currently trading above all four major EMAs, supporting the ongoing recovery structure.
The $99.76 20 EMA is the key dynamic support. As long as SOL remains above this level, buyers maintain control of the current short-term structure.
📐 Fibonacci Levels
0.236: $104.00
0.382: $129.49
0.5: $150.08
0.618: $170.67
0.786: $199.99
1.0: $237.33
The $104.00 0.236 Fibonacci level is the immediate major resistance. A successful reclaim could strengthen the path toward $129.49.
🟢 Bullish Scenario
SOL is consolidating around the $100–$102 region after recovering from the recent lows.
A clean breakout and sustained close above $104.64 could trigger another bullish expansion.
🎯 Target 1: $107.07
🎯 Target 2: $109.84
🎯 Target 3: $112.00
🎯 Target 4: $129.49
🎯 Target 5: $150.08
🎯 Target 6: $170.67
A decisive reclaim of $129.49 would be an important confirmation that SOL is transitioning into a stronger medium-term recovery phase.
🔴 Pullback Scenario
If SOL fails to break the $102.29–$104.64 resistance cluster, a short-term pullback could develop.
Key supports:
$100.59
$99.76
$96.33
$92.94
$92.04
$91.74 — 200 EMA
$87.25 — 100 EMA
$86.69
The $100.59–$99.76 region is particularly important. A successful retest here could provide a base for another attempt at the $104 resistance.
A sustained break below the 20 EMA at $99.76 would weaken the short-term bullish structure.
🧠 Market Structure & Liquidity
SOL's recent structure can be viewed as:
Liquidity Sweep → Accumulation → Higher Lows → MSS/BOS → Breakout → Reclaim → Consolidation → Potential Continuation
The June low created a major liquidity event, followed by a prolonged accumulation phase and gradual recovery.
SOL has now reclaimed the $100 psychological level and is holding above the major EMA cluster.
The next major structural test is $102.29–$104.64, followed by the $107–$112 resistance area.
📊 RSI Momentum
RSI: 56.24
RSI MA: 61.94
RSI remains above 50, indicating that bullish momentum is still present.
However, RSI is currently below its moving average, suggesting that momentum has cooled from the recent upside move. A renewed push above 60–62 would strengthen the continuation setup.
🎯 Key Levels
Resistance:
$102.29 → $104.00 → $104.64 → $107.07 → $109.84 → $112.00 → $129.49
Support:
$100.59 → $99.76 → $96.33 → $92.94 → $92.04 → $91.74 → $87.25 → $86.69
📌 Final Outlook
SOL remains in a constructive recovery structure while holding above the $100 area and all major EMAs.
The immediate battle is $102.29–$104.64. A decisive breakout above this zone could push SOL toward $107 → $109.84 → $112, while a sustained move beyond these levels could open the path toward $129.49.
On the downside, $99.76 is the key dynamic support. As long as SOL holds above this level, the broader recovery structure remains intact.
Bias: 🟢 Bullish above $99.76 | Stronger above $104.64
$SOL
The broader structure is showing signs of improvement, with SOL now trading above all four major EMAs. However, price is facing a significant resistance cluster around $102.29–$104.64. Bulls need a clean breakout above this zone to open the path toward the $107–$109 area and the $129.49 Fibonacci resistance.
📈 EMA Structure
20 EMA: $99.76
50 EMA: $92.04
100 EMA: $87.25
200 EMA: $91.74
SOL is currently trading above all four major EMAs, supporting the ongoing recovery structure.
The $99.76 20 EMA is the key dynamic support. As long as SOL remains above this level, buyers maintain control of the current short-term structure.
📐 Fibonacci Levels
0.236: $104.00
0.382: $129.49
0.5: $150.08
0.618: $170.67
0.786: $199.99
1.0: $237.33
The $104.00 0.236 Fibonacci level is the immediate major resistance. A successful reclaim could strengthen the path toward $129.49.
🟢 Bullish Scenario
SOL is consolidating around the $100–$102 region after recovering from the recent lows.
A clean breakout and sustained close above $104.64 could trigger another bullish expansion.
🎯 Target 1: $107.07
🎯 Target 2: $109.84
🎯 Target 3: $112.00
🎯 Target 4: $129.49
🎯 Target 5: $150.08
🎯 Target 6: $170.67
A decisive reclaim of $129.49 would be an important confirmation that SOL is transitioning into a stronger medium-term recovery phase.
🔴 Pullback Scenario
If SOL fails to break the $102.29–$104.64 resistance cluster, a short-term pullback could develop.
Key supports:
$100.59
$99.76
$96.33
$92.94
$92.04
$91.74 — 200 EMA
$87.25 — 100 EMA
$86.69
The $100.59–$99.76 region is particularly important. A successful retest here could provide a base for another attempt at the $104 resistance.
A sustained break below the 20 EMA at $99.76 would weaken the short-term bullish structure.
🧠 Market Structure & Liquidity
SOL's recent structure can be viewed as:
Liquidity Sweep → Accumulation → Higher Lows → MSS/BOS → Breakout → Reclaim → Consolidation → Potential Continuation
The June low created a major liquidity event, followed by a prolonged accumulation phase and gradual recovery.
SOL has now reclaimed the $100 psychological level and is holding above the major EMA cluster.
The next major structural test is $102.29–$104.64, followed by the $107–$112 resistance area.
📊 RSI Momentum
RSI: 56.24
RSI MA: 61.94
RSI remains above 50, indicating that bullish momentum is still present.
However, RSI is currently below its moving average, suggesting that momentum has cooled from the recent upside move. A renewed push above 60–62 would strengthen the continuation setup.
🎯 Key Levels
Resistance:
$102.29 → $104.00 → $104.64 → $107.07 → $109.84 → $112.00 → $129.49
Support:
$100.59 → $99.76 → $96.33 → $92.94 → $92.04 → $91.74 → $87.25 → $86.69
📌 Final Outlook
SOL remains in a constructive recovery structure while holding above the $100 area and all major EMAs.
The immediate battle is $102.29–$104.64. A decisive breakout above this zone could push SOL toward $107 → $109.84 → $112, while a sustained move beyond these levels could open the path toward $129.49.
On the downside, $99.76 is the key dynamic support. As long as SOL holds above this level, the broader recovery structure remains intact.
Bias: 🟢 Bullish above $99.76 | Stronger above $104.64
$SOL
61
·
--
Article
Voir la traduction
ETH Technical Outlook: Ethereum Holds Above $2.5K as Bulls Target Higher ResistanceETH is currently trading around $2,509, consolidating above the psychological $2,500 level after a strong recovery from the June lows.
The broader structure remains constructive, with ETH trading well above all four major EMAs. However, price is now approaching a significant resistance cluster around $2,512–$2,538. Bulls need a clean breakout above this zone to open the path toward the $2,784 Fibonacci resistance.
📈 EMA Structure
20 EMA: $2,434.01
50 EMA: $2,256.12
100 EMA: $2,139.41
200 EMA: $2,200.93
ETH remains comfortably above all four major EMAs, keeping the medium-term recovery structure bullish.
The $2,434 20 EMA is now the key dynamic support. As long as ETH remains above this level, buyers maintain control of the current recovery.
📐 Fibonacci Levels
0.236: $2,315.21
0.382: $2,784.60
0.5: $3,163.97
0.618: $3,543.34
0.786: $4,083.46
1.0: $4,771.47
The $2,784.60 0.382 Fibonacci level is the next major upside objective after the current resistance cluster.
🟢 Bullish Scenario
ETH is consolidating just below the $2,512–$2,538 resistance zone.
A clean breakout and sustained close above $2,538 could trigger another bullish expansion.
🎯 Target 1: $2,550
🎯 Target 2: $2,600
🎯 Target 3: $2,700
🎯 Target 4: $2,784.60
🎯 Target 5: $3,163.97
🎯 Target 6: $3,543.34
A decisive reclaim of $2,784.60 would be an important confirmation that ETH is transitioning into a stronger medium-term recovery phase.
🔴 Pullback Scenario
If ETH fails to break the $2,512–$2,538 resistance cluster, a short-term pullback could develop.
Key supports:
$2,503.11
$2,483.47
$2,475.84
$2,458.60
$2,454.11
$2,434.01 — 20 EMA
$2,315.21 — 0.236 Fib
The $2,454–$2,434 region is particularly important. A successful retest here could provide a base for another attempt at the $2,538 resistance.
A sustained break below the 20 EMA would weaken the short-term bullish structure.
🧠 Market Structure & Liquidity
ETH's recent structure can be viewed as:
Liquidity Sweep → Accumulation → Higher Lows → Breakout → Reclaim → Consolidation → Potential Continuation
The June low around $1,556 created a major liquidity sweep, followed by a strong recovery and a series of higher lows.
ETH has now reclaimed the $2,500 psychological level and is consolidating near the recent highs.
The next major structural test is $2,538, followed by the $2,784.60 Fibonacci resistance.
📊 RSI Momentum
RSI: 61.90
RSI MA: 63.47
RSI remains above 60, confirming that bullish momentum is still present.
However, RSI is slightly below its moving average, suggesting momentum has cooled from the recent spike. A renewed move above 63–65 would strengthen the continuation setup.
🎯 Key Levels
Resistance:
$2,512.77 → $2,529.05 → $2,538 → $2,784.60 → $3,163.97 → $3,543.34
Support:
$2,503.11 → $2,483.47 → $2,475.84 → $2,458.60 → $2,454.11 → $2,434.01 → $2,315.21
📌 Final Outlook
ETH remains in a constructive recovery structure while holding above the $2,500 area and all major EMAs.
The immediate battle is $2,512–$2,538. A decisive breakout above this zone could push ETH toward $2,600 → $2,700 → $2,784.60, while a confirmed break above $2,784 could open the path toward $3,163.97.
On the downside, $2,434 is the key dynamic support. As long as ETH holds above this level, the broader bullish recovery remains intact.
Bias: 🟢 Bullish above $2,434 | Stronger above $2,538
$ETH
{future}(ETHUSDT)
ETH Technical Outlook: Ethereum Holds Above $2.5K as Bulls Target Higher Resistance
ETH is currently trading around $2,509, consolidating above the psychological $2,500 level after a strong recovery from the June lows.
The broader structure remains constructive, with ETH trading well above all four major EMAs. However, price is now approaching a significant resistance cluster around $2,512–$2,538. Bulls need a clean breakout above this zone to open the path toward the $2,784 Fibonacci resistance.
📈 EMA Structure
20 EMA: $2,434.01
50 EMA: $2,256.12
100 EMA: $2,139.41
200 EMA: $2,200.93
ETH remains comfortably above all four major EMAs, keeping the medium-term recovery structure bullish.
The $2,434 20 EMA is now the key dynamic support. As long as ETH remains above this level, buyers maintain control of the current recovery.
📐 Fibonacci Levels
0.236: $2,315.21
0.382: $2,784.60
0.5: $3,163.97
0.618: $3,543.34
0.786: $4,083.46
1.0: $4,771.47
The $2,784.60 0.382 Fibonacci level is the next major upside objective after the current resistance cluster.
🟢 Bullish Scenario
ETH is consolidating just below the $2,512–$2,538 resistance zone.
A clean breakout and sustained close above $2,538 could trigger another bullish expansion.
🎯 Target 1: $2,550
🎯 Target 2: $2,600
🎯 Target 3: $2,700
🎯 Target 4: $2,784.60
🎯 Target 5: $3,163.97
🎯 Target 6: $3,543.34
A decisive reclaim of $2,784.60 would be an important confirmation that ETH is transitioning into a stronger medium-term recovery phase.
🔴 Pullback Scenario
If ETH fails to break the $2,512–$2,538 resistance cluster, a short-term pullback could develop.
Key supports:
$2,503.11
$2,483.47
$2,475.84
$2,458.60
$2,454.11
$2,434.01 — 20 EMA
$2,315.21 — 0.236 Fib
The $2,454–$2,434 region is particularly important. A successful retest here could provide a base for another attempt at the $2,538 resistance.
A sustained break below the 20 EMA would weaken the short-term bullish structure.
🧠 Market Structure & Liquidity
ETH's recent structure can be viewed as:
Liquidity Sweep → Accumulation → Higher Lows → Breakout → Reclaim → Consolidation → Potential Continuation
The June low around $1,556 created a major liquidity sweep, followed by a strong recovery and a series of higher lows.
ETH has now reclaimed the $2,500 psychological level and is consolidating near the recent highs.
The next major structural test is $2,538, followed by the $2,784.60 Fibonacci resistance.
📊 RSI Momentum
RSI: 61.90
RSI MA: 63.47
RSI remains above 60, confirming that bullish momentum is still present.
However, RSI is slightly below its moving average, suggesting momentum has cooled from the recent spike. A renewed move above 63–65 would strengthen the continuation setup.
🎯 Key Levels
Resistance:
$2,512.77 → $2,529.05 → $2,538 → $2,784.60 → $3,163.97 → $3,543.34
Support:
$2,503.11 → $2,483.47 → $2,475.84 → $2,458.60 → $2,454.11 → $2,434.01 → $2,315.21
📌 Final Outlook
ETH remains in a constructive recovery structure while holding above the $2,500 area and all major EMAs.
The immediate battle is $2,512–$2,538. A decisive breakout above this zone could push ETH toward $2,600 → $2,700 → $2,784.60, while a confirmed break above $2,784 could open the path toward $3,163.97.
On the downside, $2,434 is the key dynamic support. As long as ETH holds above this level, the broader bullish recovery remains intact.
Bias: 🟢 Bullish above $2,434 | Stronger above $2,538
$ETH
The broader structure remains constructive, with ETH trading well above all four major EMAs. However, price is now approaching a significant resistance cluster around $2,512–$2,538. Bulls need a clean breakout above this zone to open the path toward the $2,784 Fibonacci resistance.
📈 EMA Structure
20 EMA: $2,434.01
50 EMA: $2,256.12
100 EMA: $2,139.41
200 EMA: $2,200.93
ETH remains comfortably above all four major EMAs, keeping the medium-term recovery structure bullish.
The $2,434 20 EMA is now the key dynamic support. As long as ETH remains above this level, buyers maintain control of the current recovery.
📐 Fibonacci Levels
0.236: $2,315.21
0.382: $2,784.60
0.5: $3,163.97
0.618: $3,543.34
0.786: $4,083.46
1.0: $4,771.47
The $2,784.60 0.382 Fibonacci level is the next major upside objective after the current resistance cluster.
🟢 Bullish Scenario
ETH is consolidating just below the $2,512–$2,538 resistance zone.
A clean breakout and sustained close above $2,538 could trigger another bullish expansion.
🎯 Target 1: $2,550
🎯 Target 2: $2,600
🎯 Target 3: $2,700
🎯 Target 4: $2,784.60
🎯 Target 5: $3,163.97
🎯 Target 6: $3,543.34
A decisive reclaim of $2,784.60 would be an important confirmation that ETH is transitioning into a stronger medium-term recovery phase.
🔴 Pullback Scenario
If ETH fails to break the $2,512–$2,538 resistance cluster, a short-term pullback could develop.
Key supports:
$2,503.11
$2,483.47
$2,475.84
$2,458.60
$2,454.11
$2,434.01 — 20 EMA
$2,315.21 — 0.236 Fib
The $2,454–$2,434 region is particularly important. A successful retest here could provide a base for another attempt at the $2,538 resistance.
A sustained break below the 20 EMA would weaken the short-term bullish structure.
🧠 Market Structure & Liquidity
ETH's recent structure can be viewed as:
Liquidity Sweep → Accumulation → Higher Lows → Breakout → Reclaim → Consolidation → Potential Continuation
The June low around $1,556 created a major liquidity sweep, followed by a strong recovery and a series of higher lows.
ETH has now reclaimed the $2,500 psychological level and is consolidating near the recent highs.
The next major structural test is $2,538, followed by the $2,784.60 Fibonacci resistance.
📊 RSI Momentum
RSI: 61.90
RSI MA: 63.47
RSI remains above 60, confirming that bullish momentum is still present.
However, RSI is slightly below its moving average, suggesting momentum has cooled from the recent spike. A renewed move above 63–65 would strengthen the continuation setup.
🎯 Key Levels
Resistance:
$2,512.77 → $2,529.05 → $2,538 → $2,784.60 → $3,163.97 → $3,543.34
Support:
$2,503.11 → $2,483.47 → $2,475.84 → $2,458.60 → $2,454.11 → $2,434.01 → $2,315.21
📌 Final Outlook
ETH remains in a constructive recovery structure while holding above the $2,500 area and all major EMAs.
The immediate battle is $2,512–$2,538. A decisive breakout above this zone could push ETH toward $2,600 → $2,700 → $2,784.60, while a confirmed break above $2,784 could open the path toward $3,163.97.
On the downside, $2,434 is the key dynamic support. As long as ETH holds above this level, the broader bullish recovery remains intact.
Bias: 🟢 Bullish above $2,434 | Stronger above $2,538
$ETH
83
·
--
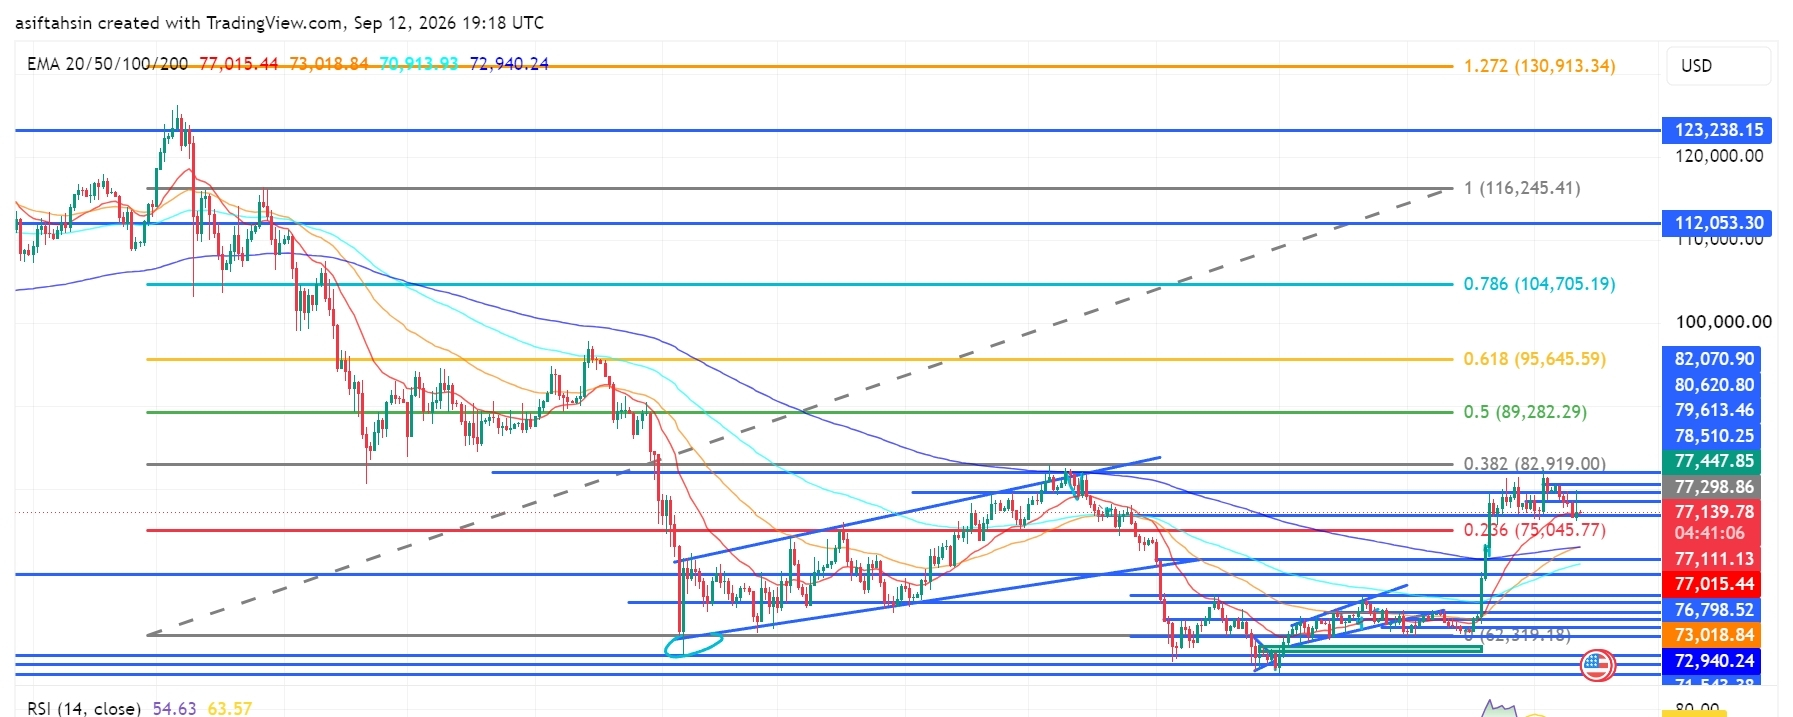
Article
Perspectives techniques du BTC : le Bitcoin reste au-dessus de $77K alors que les haussiers défendent la cassureLe BTC se négocie actuellement autour de $77,1K, consolidant au-dessus de la zone de cassure $75K–$77K après la récente reprise haussière.
La structure globale reste constructive, mais le BTC fait face à une forte résistance autour de $77,4K–$82,9K. Les haussiers doivent reprendre ce cluster de résistance et franchir le niveau de Fibonacci à $82,919 pour débloquer la prochaine expansion haussière majeure.
📈 Structure des EMA
20 EMA : $77,015.44
50 EMA : $73,018.84
100 EMA : $70,913.93
200 EMA : $72,940.24
Le BTC se maintient actuellement juste au-dessus de la 20 EMA, tout en restant au-dessus des 50, 100 et 200 EMA.
Perspectives techniques du BTC : le Bitcoin reste au-dessus de $77K alors que les haussiers défendent la cassure
Le BTC se négocie actuellement autour de $77,1K, consolidant au-dessus de la zone de cassure $75K–$77K après la récente reprise haussière.
La structure globale reste constructive, mais le BTC fait face à une forte résistance autour de $77,4K–$82,9K. Les haussiers doivent reprendre ce cluster de résistance et franchir le niveau de Fibonacci à $82,919 pour débloquer la prochaine expansion haussière majeure.
📈 Structure des EMA
20 EMA : $77,015.44
50 EMA : $73,018.84
100 EMA : $70,913.93
200 EMA : $72,940.24
Le BTC se maintient actuellement juste au-dessus de la 20 EMA, tout en restant au-dessus des 50, 100 et 200 EMA.
La structure globale reste constructive, mais le BTC fait face à une forte résistance autour de $77,4K–$82,9K. Les haussiers doivent reprendre ce cluster de résistance et franchir le niveau de Fibonacci à $82,919 pour débloquer la prochaine expansion haussière majeure.
📈 Structure des EMA
20 EMA : $77,015.44
50 EMA : $73,018.84
100 EMA : $70,913.93
200 EMA : $72,940.24
Le BTC se maintient actuellement juste au-dessus de la 20 EMA, tout en restant au-dessus des 50, 100 et 200 EMA.
37
Connectez-vous pour découvrir plus de contenu
Rejoignez la communauté mondiale des adeptes de cryptomonnaies sur Binance Square
⚡️ Suviez les dernières informations importantes sur les cryptomonnaies.
💬 Jugé digne de confiance par la plus grande plateforme d’échange de cryptomonnaies au monde.
👍 Découvrez les connaissances que partagent les créateurs vérifiés.
Adresse e-mail/Nº de téléphone
Sujets d’actualité
AIStocksWhatNext
83,605 vues
1,030 mentions
Partagez et gagnez une récompense de trafic dans notre campagne de hashtag tendance
✨Sujet : Quelles autres opportunités d’investissement restent-elles alors que les actions liées à l’IA continuent de grimper ?
👉Comment participer :
Publiez une courte publication ou un article avec le hashtag #AIStocksWhatNext
Partagez si vous êtes plutôt haussier ou baissier, et publiez vos avoirs en actions IA ou votre transaction — utiliser le widget de trading peut améliorer votre éligibilité.
Vous pouvez aussi renforcer votre publication en partageant des données ou des graphiques, et en évitant les images générées par l’IA.
✍️Créez du contenu à partir des angles ci-dessous :
- Nvidia affirme que les ventes de puces vont doubler l’an prochain, et que les principaux acteurs de l’IA continuent d’enregistrer des revenus records ; les dépenses en calcul qui soutiennent tout cela sont tout aussi impressionnantes. La demande en IA décolle-t-elle vraiment ? Et combien de temps cela peut-il durer ? Les actions IA montent partout. Est-ce une vraie cassure, ou juste un rebond à court terme ?
- Des leaders de l’industrie appellent à ralentir le développement de l’IA, tandis que Trump prévoit de construire une « Force IA », affirmant que l’IA pourrait représenter 25 % du PIB américain à l’avenir. De quel côté êtes-vous ? Le soutien au niveau des États sera-t-il un gain de long terme pour les actions IA ?
- Achetez-vous des actions liées à l’IA ? Partagez votre transaction/position liée à l’IA avec notre widget de partage de trading.
⏰Période de la campagne :
- 2026-09-22 7:00 - 2026-09-24 4:00 UTC
🎁Récompense :
- Les publications qualifiées qui respectent les consignes ci-dessus et contiennent plus de 100 mots seront examinées et pourront recevoir un boost aléatoire de trafic de 500 à 3 000 vues. Vous recevrez une notification de la part de votre secrétaire de flux si votre publication est sélectionnée.
- Ayez une chance de voir votre article mis en avant sur Binance Square Official
Vous cherchez des idées pour votre publication ? Visitez la page du sujet #AIStocksWhatNext ou la page Square Guide on How to Post for Better Reach.
Binance Square Official
·186 mentions J’aime
·274.8k vues
BitcoinBreaksAboveMayHighNears$86K
548 vues
15 mentions
DogecoinRises15%
1,864 vues
110 mentions