
Crypto Man Mab 1
256 Publications

Crypto Man Mab 1
Signaler
Bloquer l’utilisateur
Top Coin Market Cap KOL - Content Writer - Trader - Investors - DM for Collab tg : @MAB350
0 Suivis
2 Abonnés
2 J’aime
Publications
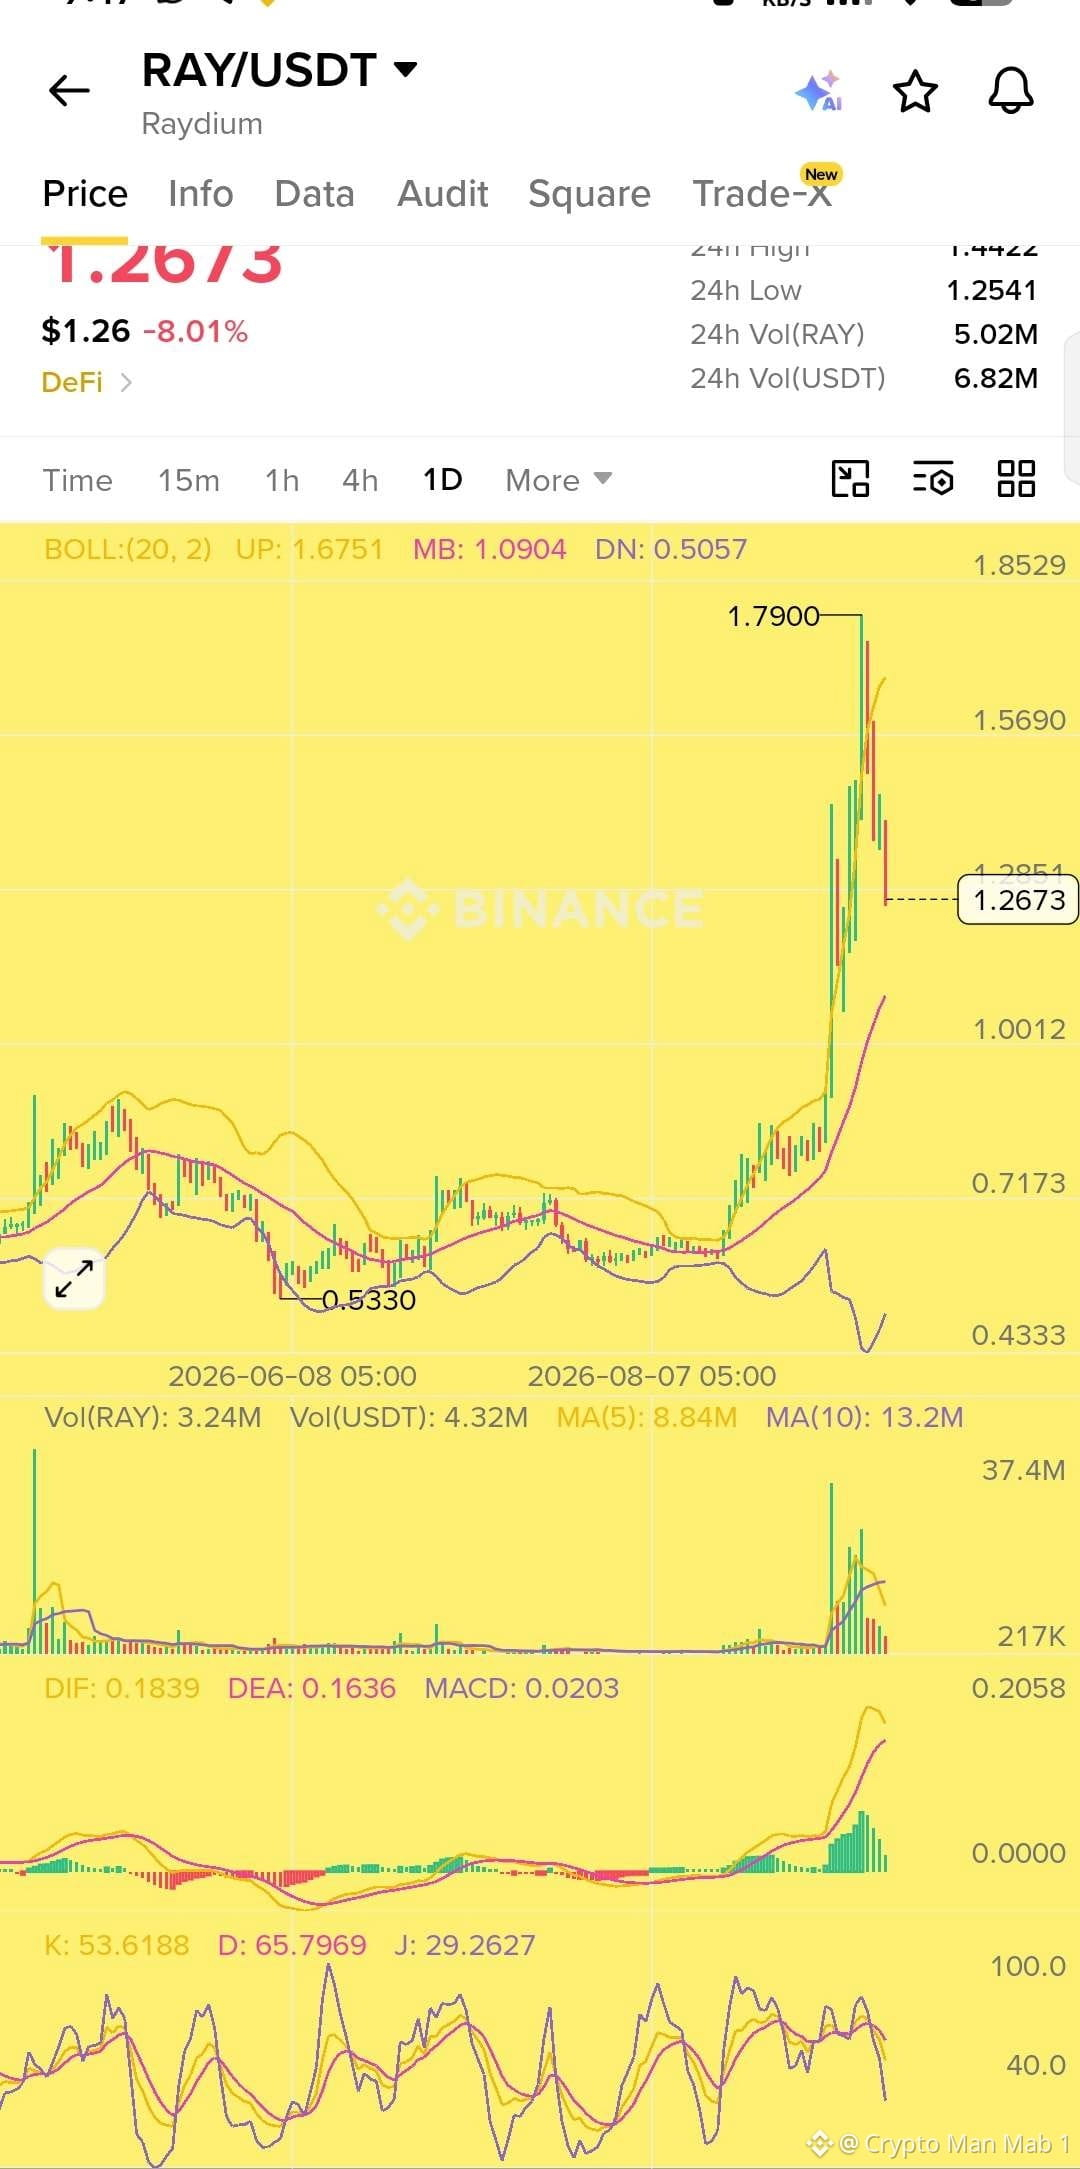
$RAY refroidit après une course effrénée. Le prix a triplé, passant de 0,53 $ à un plus haut de 1,79 $ en quelques semaines, puis se corrige fortement à 1,2673 $ : -8 % aujourd’hui après avoir été rejeté au sommet.
Chandelle « blow off top » classique juste après le pic. Les bandes de Bollinger montrent un repli du prix depuis la bande supérieure vers la bande médiane, proche de 1,09 $. L’élan du MACD faiblit et le KDJ a déjà basculé en mode baissier, donc la tendance à court terme s’est inversée à la baisse.
À plus grande échelle, c’est toujours haussier puisque le prix est bien au-dessus des moyennes mobiles, mais cela ressemble à une remise en ordre saine après un mouvement parabolique. Surveiller 1,09 $ comme prochain niveau de support.
Ce n’est pas un conseil financier, juste une lecture du graphique.
$RAY refroidit après une course effrénée. Le prix a triplé, passant de 0,53 $ à un plus haut de 1,79 $ en quelques semaines, puis se corrige fortement à 1,2673 $ : -8 % aujourd’hui après avoir été rejeté au sommet.
Chandelle « blow off top » classique juste après le pic. Les bandes de Bollinger montrent un repli du prix depuis la bande supérieure vers la bande médiane, proche de 1,09 $. L’élan du MACD faiblit et le KDJ a déjà basculé en mode baissier, donc la tendance à court terme s’est inversée à la baisse.
À plus grande échelle, c’est toujours haussier puisque le prix est bien au-dessus des moyennes mobiles, mais cela ressemble à une remise en ordre saine après un mouvement parabolique. Surveiller 1,09 $ comme prochain niveau de support.
Ce n’est pas un conseil financier, juste une lecture du graphique.
Chandelle « blow off top » classique juste après le pic. Les bandes de Bollinger montrent un repli du prix depuis la bande supérieure vers la bande médiane, proche de 1,09 $. L’élan du MACD faiblit et le KDJ a déjà basculé en mode baissier, donc la tendance à court terme s’est inversée à la baisse.
À plus grande échelle, c’est toujours haussier puisque le prix est bien au-dessus des moyennes mobiles, mais cela ressemble à une remise en ordre saine après un mouvement parabolique. Surveiller 1,09 $ comme prochain niveau de support.
Ce n’est pas un conseil financier, juste une lecture du graphique.
58
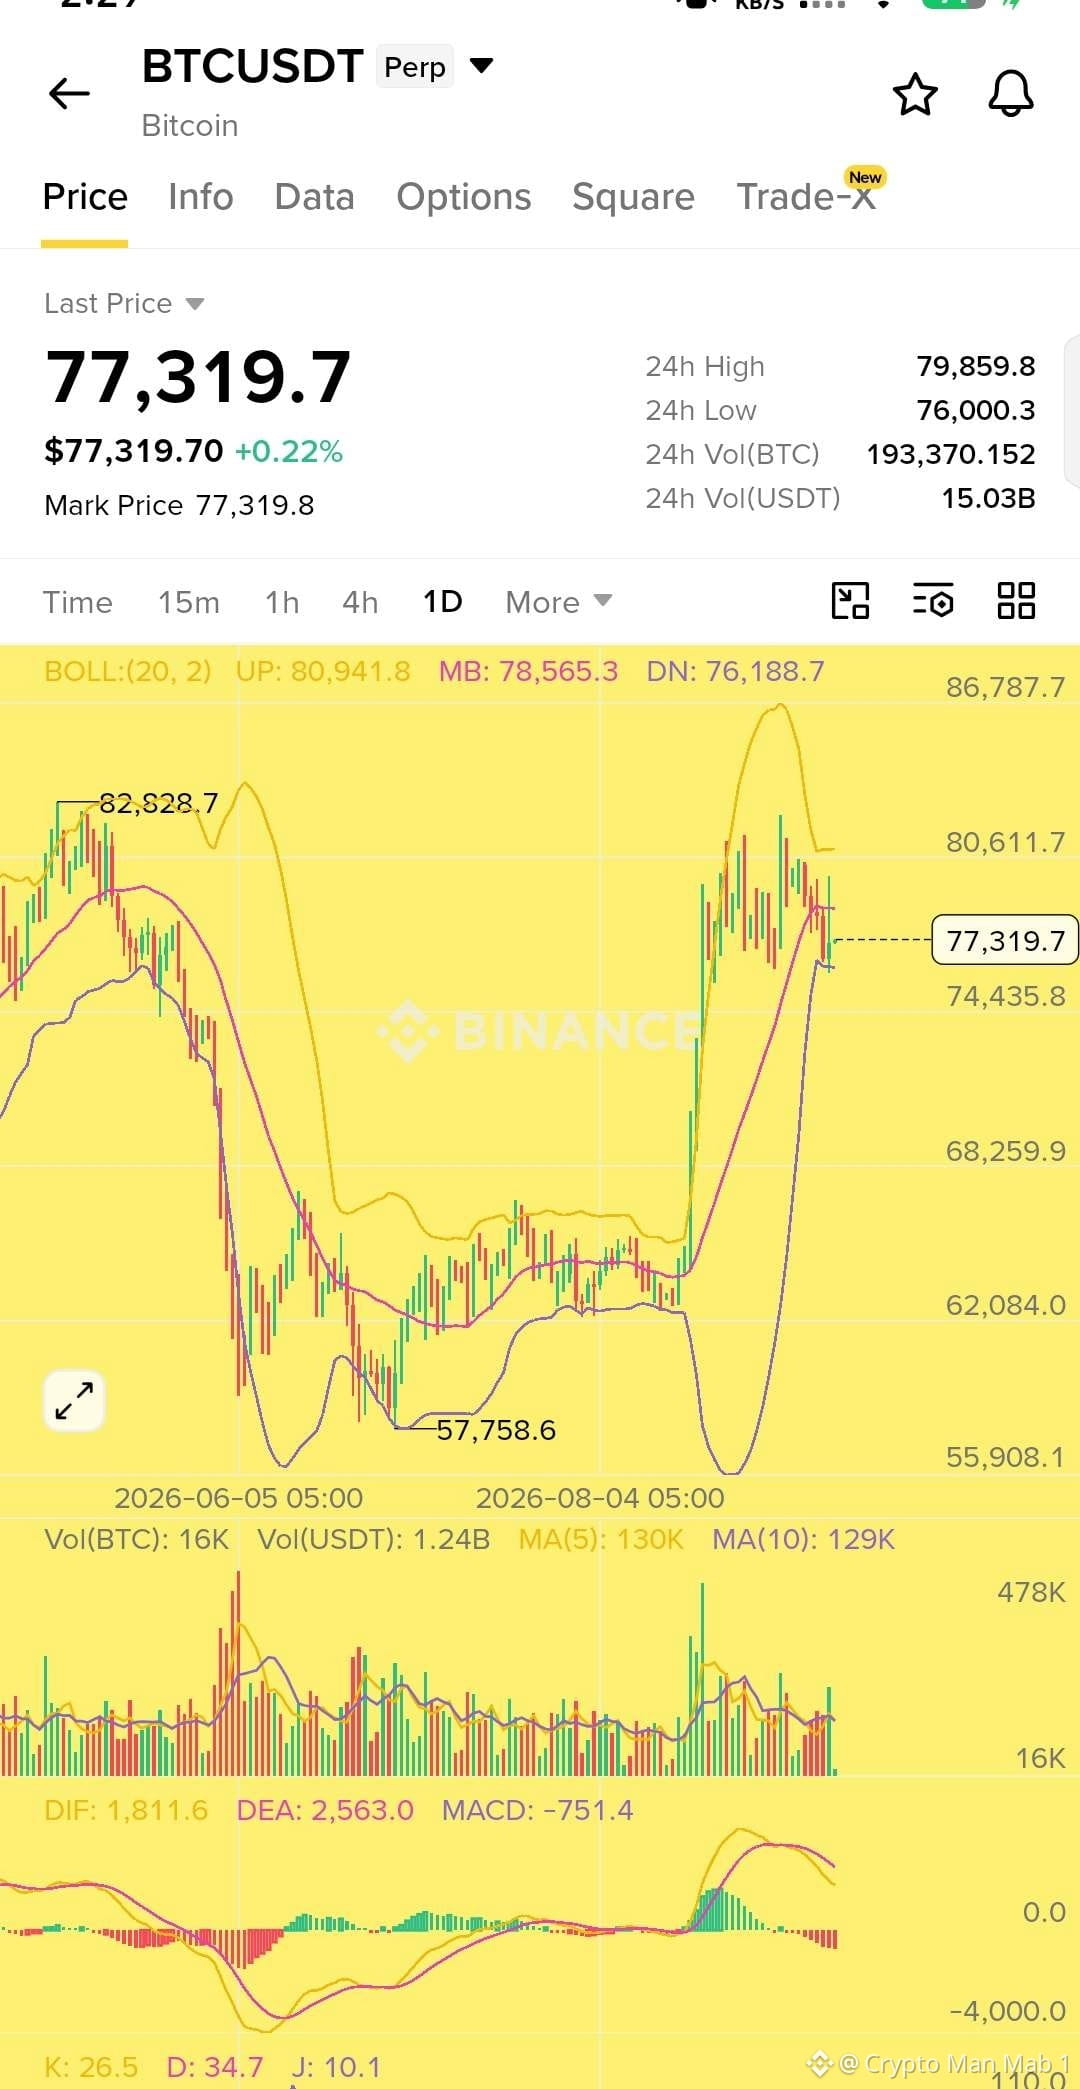
Le graphique quotidien du $BTC montre une structure baissière claire à court terme.
Le $BTC se négocie actuellement autour de 77,3 K$ et se situe sous la bande médiane de Bollinger à 78,56 K$. Le MACD est passé en mode baissier, avec l’histogramme sous zéro, tandis que le KDJ affiche également un élan faible.
Le niveau clé à surveiller est 78,5 K$. Si le $BTC n’arrive pas à reconquérir cette zone, un autre mouvement vers 76 K$ et potentiellement 74,4 K$ est possible.
Pour les haussiers, je voudrais voir une clôture quotidienne solide au-dessus de 78,5 K$. Cela pourrait ouvrir la voie vers 80,6 K$ et 81 K$.
#Analyse du prix du $BTC#
Mon avis pour le moment : prudent, baissier sous 78,5 K$.
Le graphique quotidien du $BTC montre une structure baissière claire à court terme.
Le $BTC se négocie actuellement autour de 77,3 K$ et se situe sous la bande médiane de Bollinger à 78,56 K$. Le MACD est passé en mode baissier, avec l’histogramme sous zéro, tandis que le KDJ affiche également un élan faible.
Le niveau clé à surveiller est 78,5 K$. Si le $BTC n’arrive pas à reconquérir cette zone, un autre mouvement vers 76 K$ et potentiellement 74,4 K$ est possible.
Pour les haussiers, je voudrais voir une clôture quotidienne solide au-dessus de 78,5 K$. Cela pourrait ouvrir la voie vers 80,6 K$ et 81 K$.
#Analyse du prix du $BTC#
Mon avis pour le moment : prudent, baissier sous 78,5 K$.
Le $BTC se négocie actuellement autour de 77,3 K$ et se situe sous la bande médiane de Bollinger à 78,56 K$. Le MACD est passé en mode baissier, avec l’histogramme sous zéro, tandis que le KDJ affiche également un élan faible.
Le niveau clé à surveiller est 78,5 K$. Si le $BTC n’arrive pas à reconquérir cette zone, un autre mouvement vers 76 K$ et potentiellement 74,4 K$ est possible.
Pour les haussiers, je voudrais voir une clôture quotidienne solide au-dessus de 78,5 K$. Cela pourrait ouvrir la voie vers 80,6 K$ et 81 K$.
#Analyse du prix du $BTC#
Mon avis pour le moment : prudent, baissier sous 78,5 K$.
63
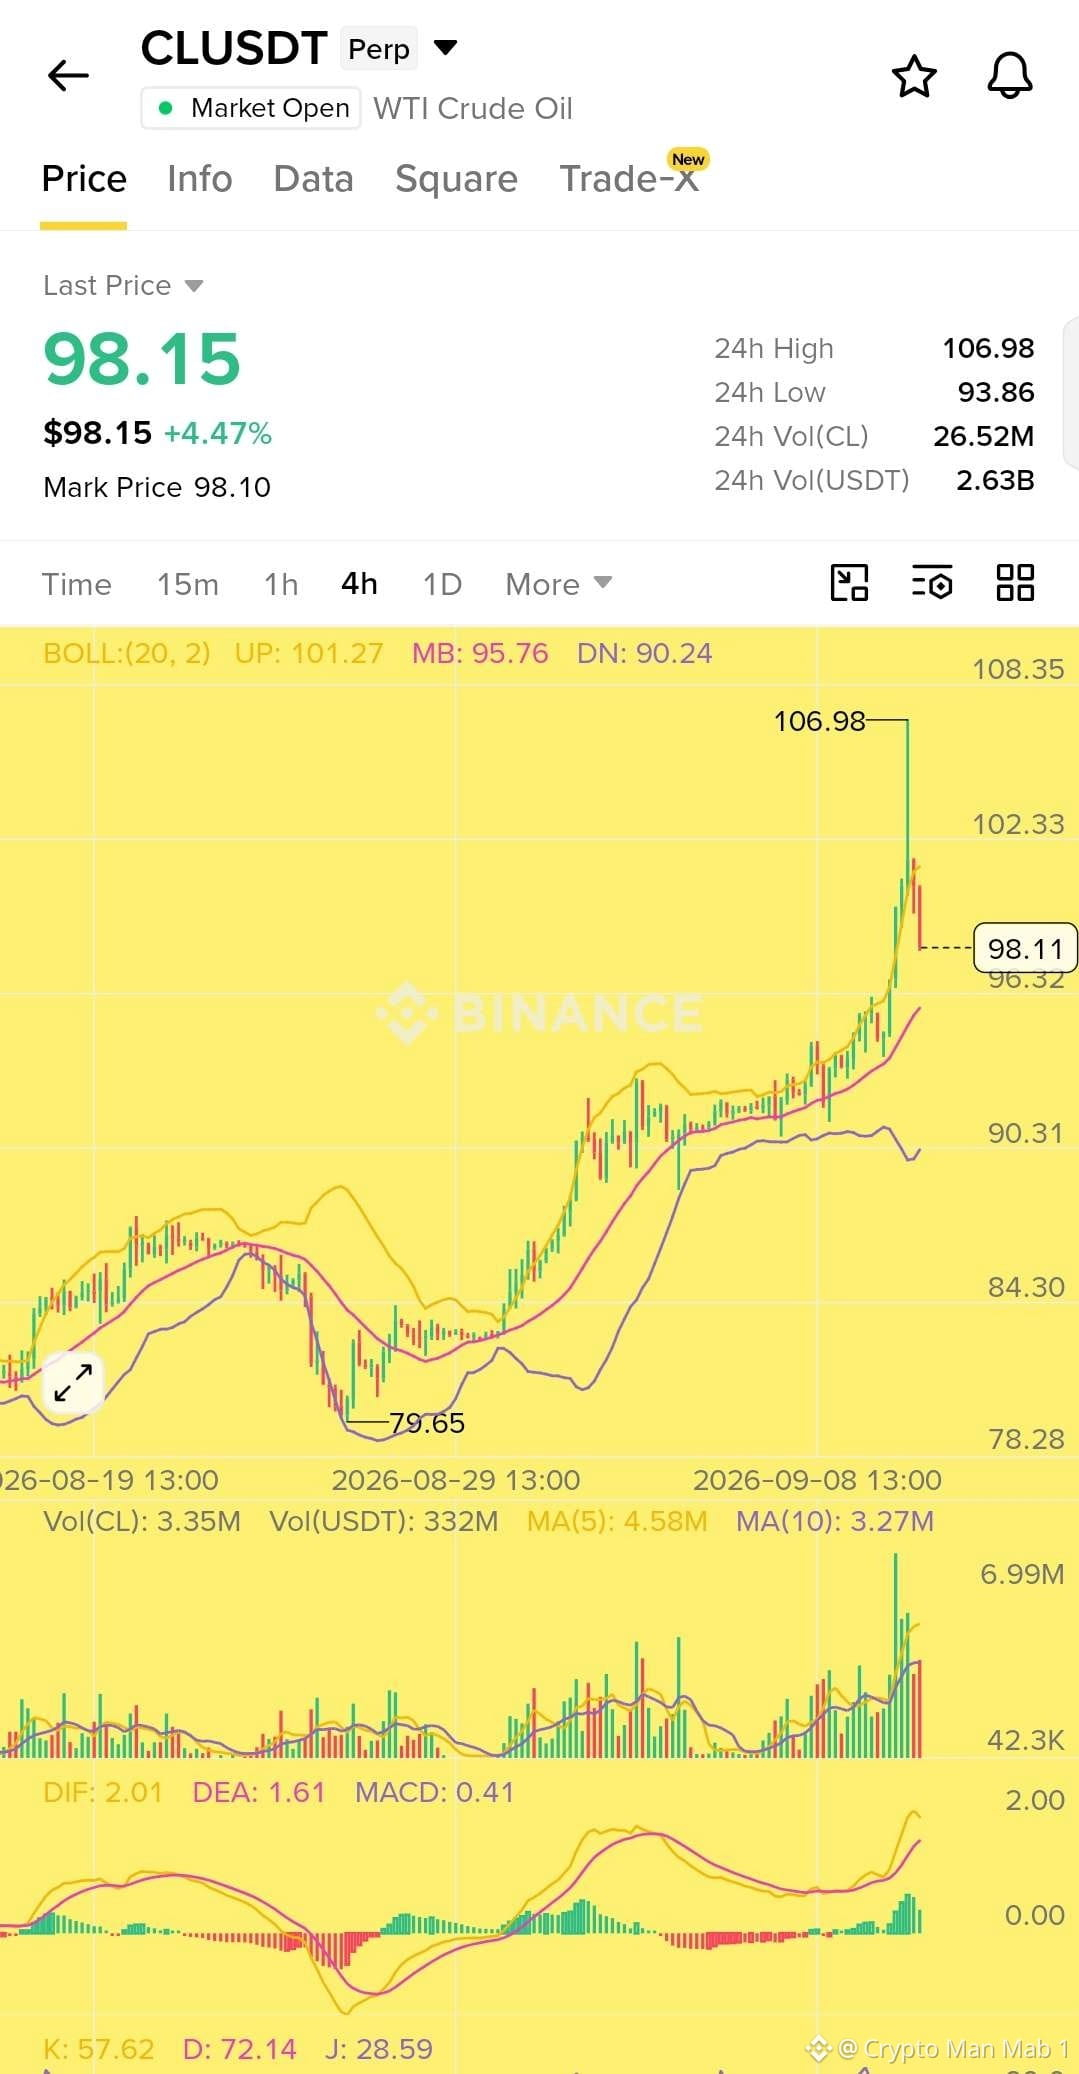
$CL montre des signes d’épuisement après le mouvement vif en direction du $106.98.
Le prix se replie désormais depuis la bande de Bollinger supérieure tandis que le graphique en 4H montre un mouvement étiré et un élan qui commence à se calmer. Je surveille de près la zone des $100. Si le prix n’arrive pas à reprendre et à maintenir au-dessus de $100, alors un repli plus profond vers $97 à $94 devient possible.
Pour un scalp, je pense que le côté short offre un meilleur ratio risque/rendement ici.
Scalp Short $CL
Entrée : $100 - $98
Objectif (TP) : $97 - $96 - $95 - $94
Stop (SL) : $102
Confirmation clé : rejet autour de $100 et faiblesse persistante en dessous de $98.
$CL montre des signes d’épuisement après le mouvement vif en direction du $106.98.
Le prix se replie désormais depuis la bande de Bollinger supérieure tandis que le graphique en 4H montre un mouvement étiré et un élan qui commence à se calmer. Je surveille de près la zone des $100. Si le prix n’arrive pas à reprendre et à maintenir au-dessus de $100, alors un repli plus profond vers $97 à $94 devient possible.
Pour un scalp, je pense que le côté short offre un meilleur ratio risque/rendement ici.
Scalp Short $CL
Entrée : $100 - $98
Objectif (TP) : $97 - $96 - $95 - $94
Stop (SL) : $102
Confirmation clé : rejet autour de $100 et faiblesse persistante en dessous de $98.
Le prix se replie désormais depuis la bande de Bollinger supérieure tandis que le graphique en 4H montre un mouvement étiré et un élan qui commence à se calmer. Je surveille de près la zone des $100. Si le prix n’arrive pas à reprendre et à maintenir au-dessus de $100, alors un repli plus profond vers $97 à $94 devient possible.
Pour un scalp, je pense que le côté short offre un meilleur ratio risque/rendement ici.
Scalp Short $CL
Entrée : $100 - $98
Objectif (TP) : $97 - $96 - $95 - $94
Stop (SL) : $102
Confirmation clé : rejet autour de $100 et faiblesse persistante en dessous de $98.
64
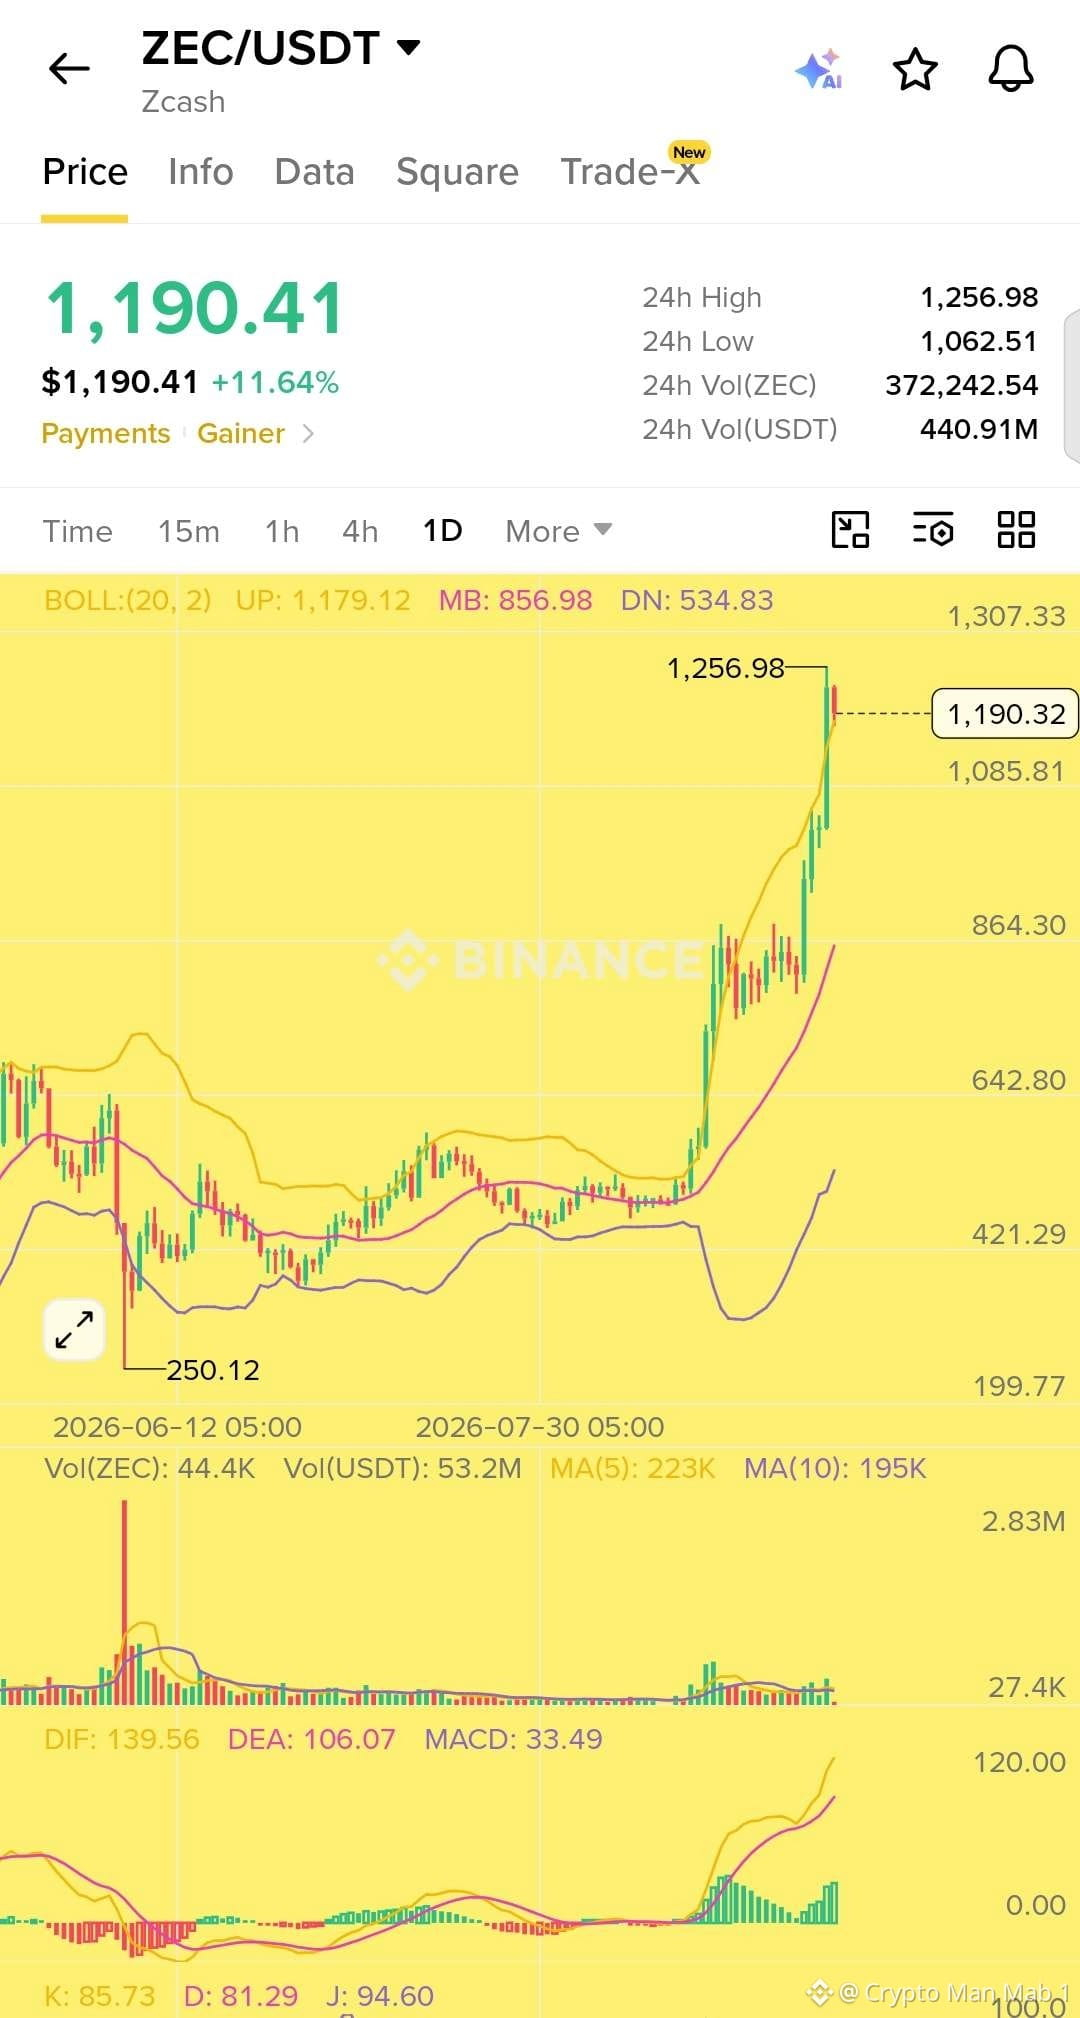
$ZEC vient juste de franchir la barre des 1 190 $ 🚨👀
Le Zcash s’échange désormais autour de 1 195 $, poussant sa capitalisation boursière au plus près de 19,5 Md $.
Le principal catalyseur ? Selon les informations, Grayscale aurait augmenté ses avoirs en ZEC de 10,5 %, marquant un fort revirement par rapport aux flux plats observés après son lancement en août.
Cet achat a contribué à provoquer une compression des positions short, déclenchant environ 34,5 M $ de liquidations et propulsant le ZEC dans le top 10.
Mais il y a aussi un autre côté à ce mouvement.
L’intérêt ouvert sur les contrats à terme a grimpé à environ 2,57 Md $, ce qui signifie qu’une grande quantité d’effet de levier est désormais placée derrière la reprise.
$ZEC vient juste de franchir la barre des 1 190 $ 🚨👀
Le Zcash s’échange désormais autour de 1 195 $, poussant sa capitalisation boursière au plus près de 19,5 Md $.
Le principal catalyseur ? Selon les informations, Grayscale aurait augmenté ses avoirs en ZEC de 10,5 %, marquant un fort revirement par rapport aux flux plats observés après son lancement en août.
Cet achat a contribué à provoquer une compression des positions short, déclenchant environ 34,5 M $ de liquidations et propulsant le ZEC dans le top 10.
Mais il y a aussi un autre côté à ce mouvement.
L’intérêt ouvert sur les contrats à terme a grimpé à environ 2,57 Md $, ce qui signifie qu’une grande quantité d’effet de levier est désormais placée derrière la reprise.
Le Zcash s’échange désormais autour de 1 195 $, poussant sa capitalisation boursière au plus près de 19,5 Md $.
Le principal catalyseur ? Selon les informations, Grayscale aurait augmenté ses avoirs en ZEC de 10,5 %, marquant un fort revirement par rapport aux flux plats observés après son lancement en août.
Cet achat a contribué à provoquer une compression des positions short, déclenchant environ 34,5 M $ de liquidations et propulsant le ZEC dans le top 10.
Mais il y a aussi un autre côté à ce mouvement.
L’intérêt ouvert sur les contrats à terme a grimpé à environ 2,57 Md $, ce qui signifie qu’une grande quantité d’effet de levier est désormais placée derrière la reprise.
71
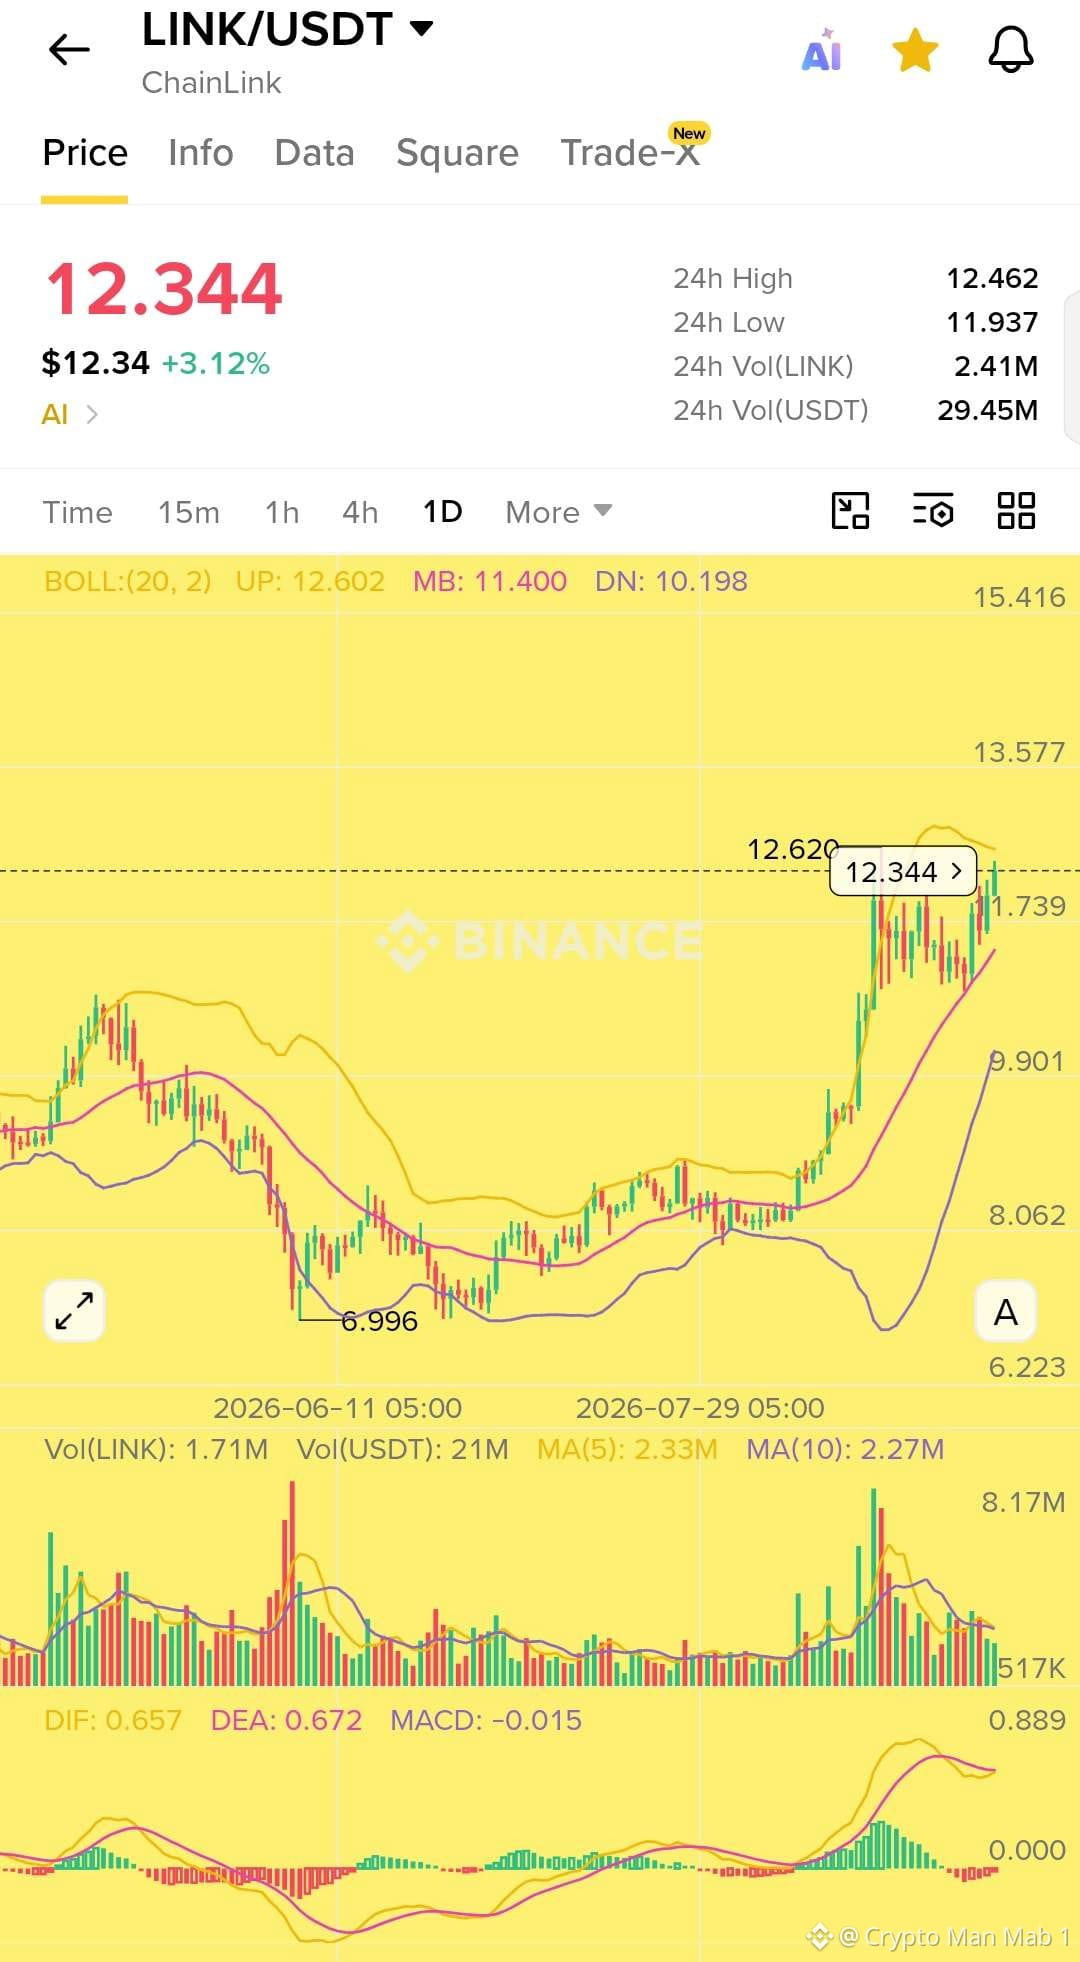
$LINK affiche une belle forme sur le graphique journalier 👀
Chainlink a réalisé une forte impulsion à la hausse et consolide désormais autour de 12,3 après être sorti de la fourchette basse.
Le prix reste toujours au-dessus de la moyenne de Bollinger vers 11,40, ce qui conserve une dynamique globale plutôt haussière. Le principal niveau à surveiller maintenant est 12,60. Une cassure nette au-dessus de cette zone, avec un volume solide, pourrait ouvrir la voie vers 13,50+.
En même temps, le momentum du MACD se calme légèrement, donc je vous conseille d’éviter de poursuivre et d’attendre une confirmation.
📌 Niveaux clés
Support : 11,40 → 10,20
Résistance : 12,60 → 13,57 → 15,40
Si LINK transforme 12,60 en support, la prochaine étape pourrait devenir intéressante.
#LINK #Chainlink #LINKUSDT #CryptoTrading #Altcoins
$LINK affiche une belle forme sur le graphique journalier 👀
Chainlink a réalisé une forte impulsion à la hausse et consolide désormais autour de 12,3 après être sorti de la fourchette basse.
Le prix reste toujours au-dessus de la moyenne de Bollinger vers 11,40, ce qui conserve une dynamique globale plutôt haussière. Le principal niveau à surveiller maintenant est 12,60. Une cassure nette au-dessus de cette zone, avec un volume solide, pourrait ouvrir la voie vers 13,50+.
En même temps, le momentum du MACD se calme légèrement, donc je vous conseille d’éviter de poursuivre et d’attendre une confirmation.
📌 Niveaux clés
Support : 11,40 → 10,20
Résistance : 12,60 → 13,57 → 15,40
Si LINK transforme 12,60 en support, la prochaine étape pourrait devenir intéressante.
#LINK #Chainlink #LINKUSDT #CryptoTrading #Altcoins
Chainlink a réalisé une forte impulsion à la hausse et consolide désormais autour de 12,3 après être sorti de la fourchette basse.
Le prix reste toujours au-dessus de la moyenne de Bollinger vers 11,40, ce qui conserve une dynamique globale plutôt haussière. Le principal niveau à surveiller maintenant est 12,60. Une cassure nette au-dessus de cette zone, avec un volume solide, pourrait ouvrir la voie vers 13,50+.
En même temps, le momentum du MACD se calme légèrement, donc je vous conseille d’éviter de poursuivre et d’attendre une confirmation.
📌 Niveaux clés
Support : 11,40 → 10,20
Résistance : 12,60 → 13,57 → 15,40
Si LINK transforme 12,60 en support, la prochaine étape pourrait devenir intéressante.
#LINK #Chainlink #LINKUSDT #CryptoTrading #Altcoins
66
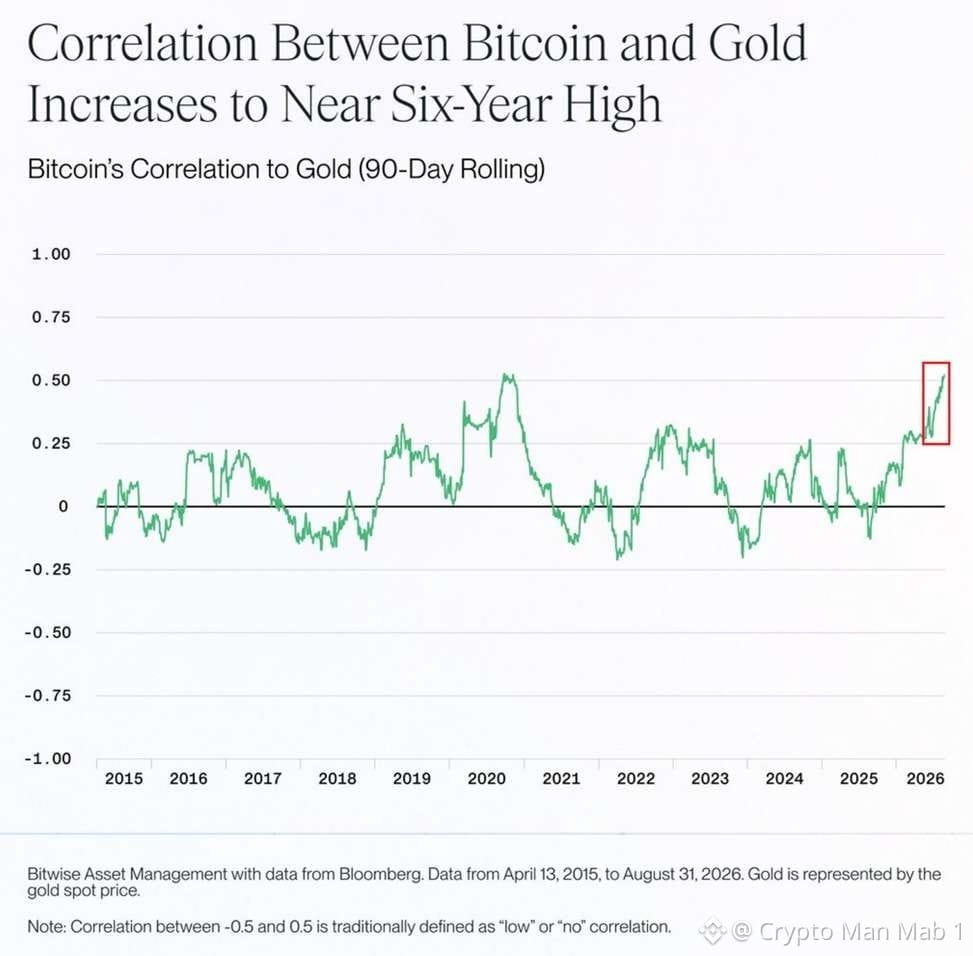
Bitcoin et l’or commencent à évoluer de plus en plus de la même façon.
La corrélation sur 90 jours entre le BTC et l’or est montée à environ +0,50, se rapprochant des niveaux records que nous avons observés pendant la pandémie de 2020.
Ce qui est encore plus intéressant, c’est que cette corrélation a plus que doublé depuis le début de l’année.
Pour comparaison, lors de la reprise après le marché baissier de 2022, la corrélation n’est montée qu’à environ +0,30.
Le mouvement le plus récent a été alimenté après que le Trésor américain a annoncé, le 19 août, qu’il doublerait au moins ses rachats de dettes publiques à long terme, en les augmentant de 2 milliards de dollars à 4 milliards de dollars par opération.
Dans le même temps, la corrélation de Bitcoin avec le Nasdaq 100 est tombée à environ 0,30, son plus bas niveau en un an.
#Analyse du prix du BTC#
$BTC
Bitcoin et l’or commencent à évoluer de plus en plus de la même façon.
La corrélation sur 90 jours entre le BTC et l’or est montée à environ +0,50, se rapprochant des niveaux records que nous avons observés pendant la pandémie de 2020.
Ce qui est encore plus intéressant, c’est que cette corrélation a plus que doublé depuis le début de l’année.
Pour comparaison, lors de la reprise après le marché baissier de 2022, la corrélation n’est montée qu’à environ +0,30.
Le mouvement le plus récent a été alimenté après que le Trésor américain a annoncé, le 19 août, qu’il doublerait au moins ses rachats de dettes publiques à long terme, en les augmentant de 2 milliards de dollars à 4 milliards de dollars par opération.
Dans le même temps, la corrélation de Bitcoin avec le Nasdaq 100 est tombée à environ 0,30, son plus bas niveau en un an.
#Analyse du prix du BTC#
$BTC
La corrélation sur 90 jours entre le BTC et l’or est montée à environ +0,50, se rapprochant des niveaux records que nous avons observés pendant la pandémie de 2020.
Ce qui est encore plus intéressant, c’est que cette corrélation a plus que doublé depuis le début de l’année.
Pour comparaison, lors de la reprise après le marché baissier de 2022, la corrélation n’est montée qu’à environ +0,30.
Le mouvement le plus récent a été alimenté après que le Trésor américain a annoncé, le 19 août, qu’il doublerait au moins ses rachats de dettes publiques à long terme, en les augmentant de 2 milliards de dollars à 4 milliards de dollars par opération.
Dans le même temps, la corrélation de Bitcoin avec le Nasdaq 100 est tombée à environ 0,30, son plus bas niveau en un an.
#Analyse du prix du BTC#
$BTC
66
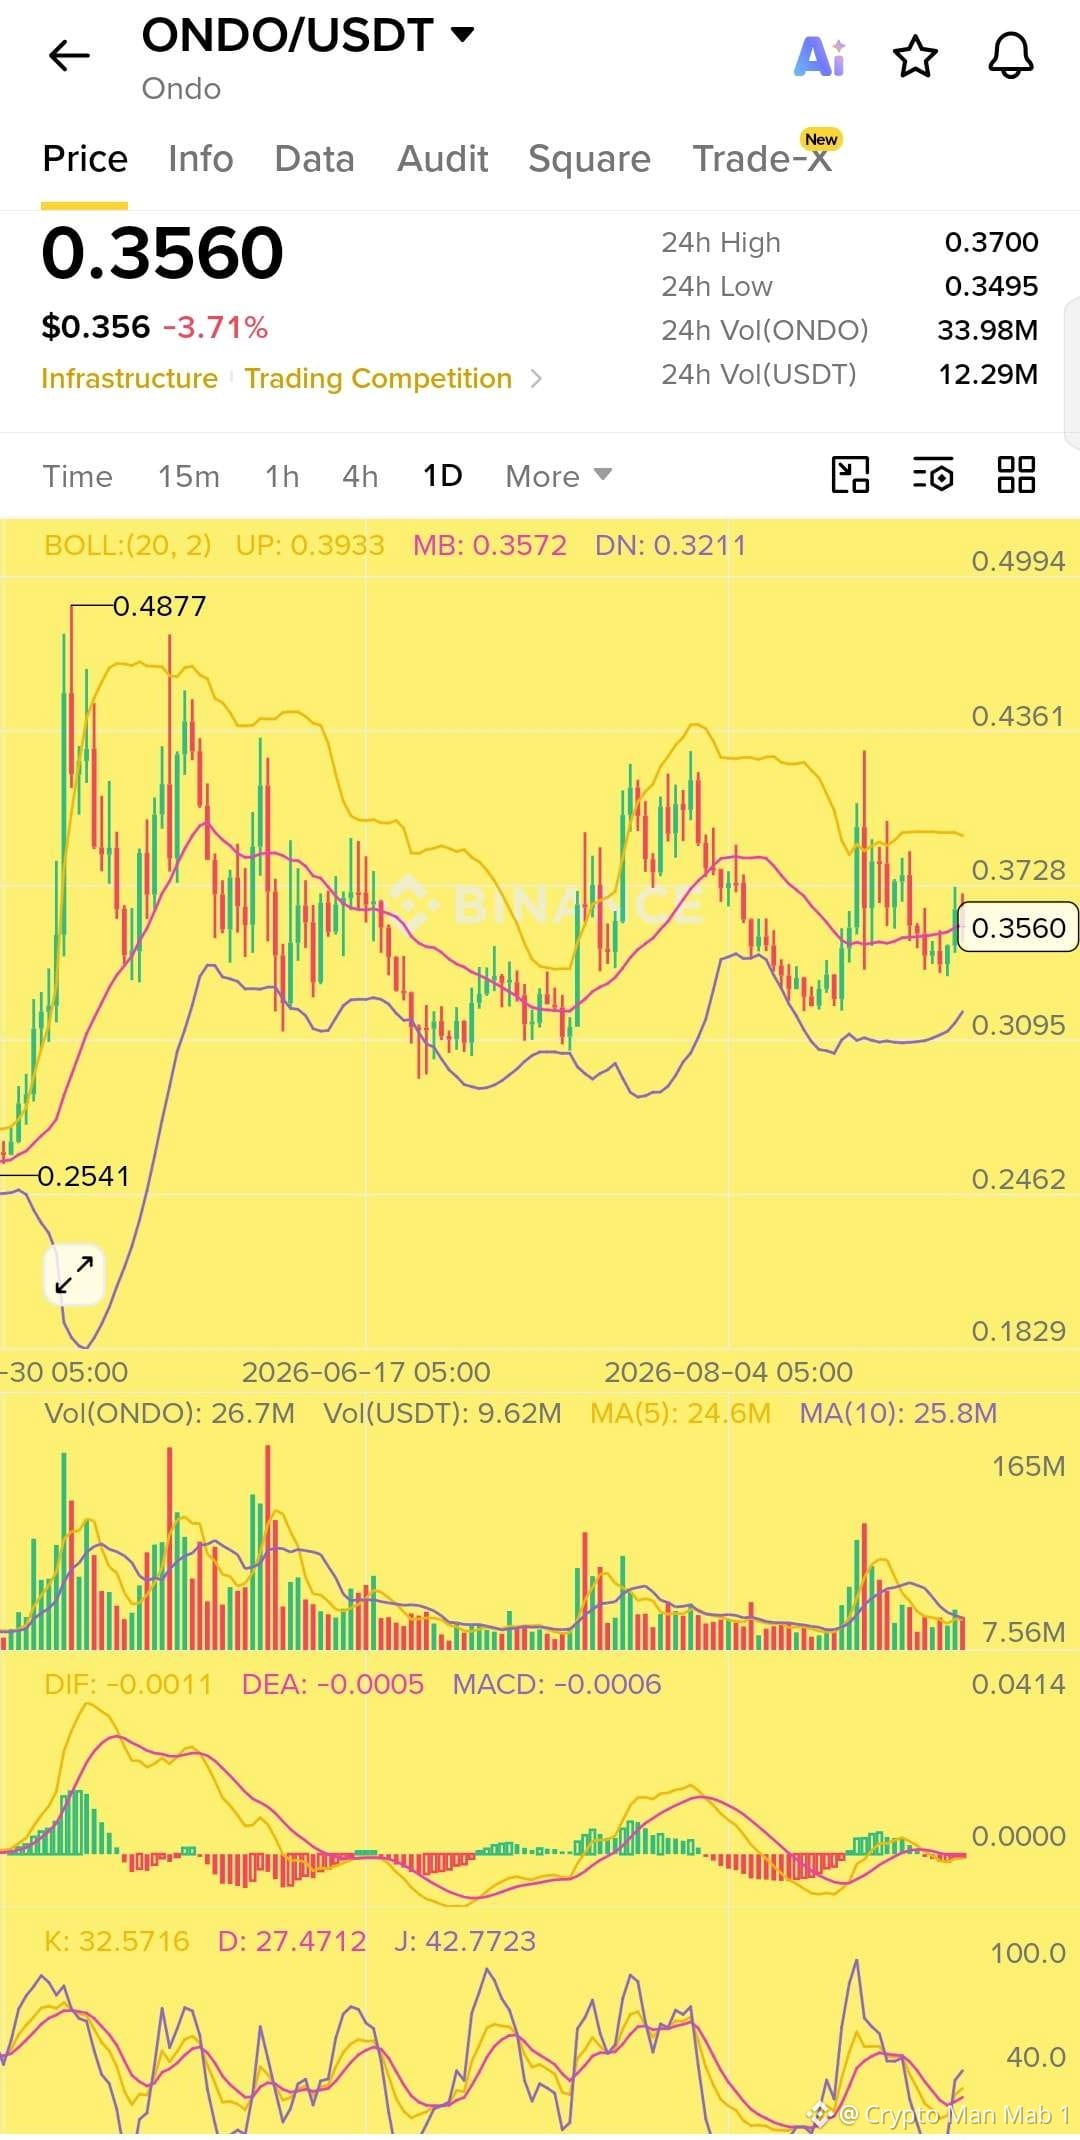
$ONDO est assis sur un niveau intéressant 👀
$ONDO se négocie autour de 0,356 $, tout près de la moyenne des Bandes de Bollinger à 0,357 $. Le prix évolue de façon latérale depuis un moment, mais les acheteurs continuent de défendre la zone 0,34–0,35 $.
Si $ONDO parvient à reprendre 0,37–0,38 $ avec un bon volume, les prochains niveaux que je surveille se situent autour de 0,393 $ et potentiellement 0,43 $.
À la baisse, une perte de 0,34 $ pourrait ramener le prix vers la zone de support à 0,32 $.
Globalement, je surveille une cassure plutôt que de poursuivre la range actuelle. 📈
Niveaux clés :
🟢 Support : 0,34 $ → 0,32 $
🚀 Résistance : 0,37 $ → 0,393 $ → 0,43 $
#ONDO #ONDOUSDT #Crypto #CryptoTrading #RWA
$ONDO est assis sur un niveau intéressant 👀
$ONDO se négocie autour de 0,356 $, tout près de la moyenne des Bandes de Bollinger à 0,357 $. Le prix évolue de façon latérale depuis un moment, mais les acheteurs continuent de défendre la zone 0,34–0,35 $.
Si $ONDO parvient à reprendre 0,37–0,38 $ avec un bon volume, les prochains niveaux que je surveille se situent autour de 0,393 $ et potentiellement 0,43 $.
À la baisse, une perte de 0,34 $ pourrait ramener le prix vers la zone de support à 0,32 $.
Globalement, je surveille une cassure plutôt que de poursuivre la range actuelle. 📈
Niveaux clés :
🟢 Support : 0,34 $ → 0,32 $
🚀 Résistance : 0,37 $ → 0,393 $ → 0,43 $
#ONDO #ONDOUSDT #Crypto #CryptoTrading #RWA
$ONDO se négocie autour de 0,356 $, tout près de la moyenne des Bandes de Bollinger à 0,357 $. Le prix évolue de façon latérale depuis un moment, mais les acheteurs continuent de défendre la zone 0,34–0,35 $.
Si $ONDO parvient à reprendre 0,37–0,38 $ avec un bon volume, les prochains niveaux que je surveille se situent autour de 0,393 $ et potentiellement 0,43 $.
À la baisse, une perte de 0,34 $ pourrait ramener le prix vers la zone de support à 0,32 $.
Globalement, je surveille une cassure plutôt que de poursuivre la range actuelle. 📈
Niveaux clés :
🟢 Support : 0,34 $ → 0,32 $
🚀 Résistance : 0,37 $ → 0,393 $ → 0,43 $
#ONDO #ONDOUSDT #Crypto #CryptoTrading #RWA
88
Les ETF sur Ethereum maintiennent l’élan. 🔥
Les ETF ETH ont désormais enregistré 11 séances consécutives d’entrées, tandis que les fonds XRP et Solana ont chacun atteint 10 jours positifs consécutifs.
Une telle régularité est difficile à ignorer.
Cela montre que l’intérêt institutionnel s’étend au-delà de Bitcoin, avec des capitaux qui s’orientent de plus en plus vers de grandes cryptomonnaies alternatives.
Si cette tendance se poursuit, la prochaine phase du marché pourrait devenir très intéressante. 👀📈
La liquidité crypto se déplace, et le marché des altcoins commence à le ressentir.
$SOL $ETH $BTC
Les ETF sur Ethereum maintiennent l’élan. 🔥
Les ETF ETH ont désormais enregistré 11 séances consécutives d’entrées, tandis que les fonds XRP et Solana ont chacun atteint 10 jours positifs consécutifs.
Une telle régularité est difficile à ignorer.
Cela montre que l’intérêt institutionnel s’étend au-delà de Bitcoin, avec des capitaux qui s’orientent de plus en plus vers de grandes cryptomonnaies alternatives.
Si cette tendance se poursuit, la prochaine phase du marché pourrait devenir très intéressante. 👀📈
La liquidité crypto se déplace, et le marché des altcoins commence à le ressentir.
$SOL $ETH $BTC
Les ETF ETH ont désormais enregistré 11 séances consécutives d’entrées, tandis que les fonds XRP et Solana ont chacun atteint 10 jours positifs consécutifs.
Une telle régularité est difficile à ignorer.
Cela montre que l’intérêt institutionnel s’étend au-delà de Bitcoin, avec des capitaux qui s’orientent de plus en plus vers de grandes cryptomonnaies alternatives.
Si cette tendance se poursuit, la prochaine phase du marché pourrait devenir très intéressante. 👀📈
La liquidité crypto se déplace, et le marché des altcoins commence à le ressentir.
$SOL $ETH $BTC
65
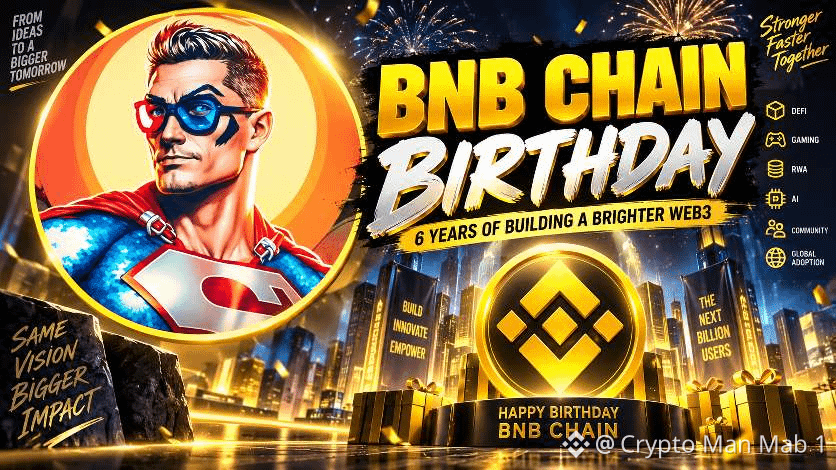
🎂 Joyeux anniversaire à @BNBChain 🟡
Il y a 6 ans, la BNB Smart Chain a été lancée avec une mission simple : rendre le Web3 plus rapide, moins cher et accessible aux prochains milliards d’utilisateurs.
Regardez ce qu’elle est devenue aujourd’hui 👇
🚀 5 000+ projets en construction à travers l’écosystème
👥 611M+ d’adresses BSC uniques
⚡ 31M de transactions quotidiennes atteignant un record historique
💰 14B$+ de TVL (valeur totale verrouillée) au pic
🏦 1,8B$+ d’actifs du monde réel tokenisés
💵 14B$ de capitalisation de stablecoins au pic
🔥 Réduction de 95 % des attaques malveillantes de MEV
⛽ Des frais de gaz descendus jusqu’à 0,001$
🌐 La BNB Chain s’est étendue au-delà de la BSC avec opBNB et BNB Greenfield, en construisant une infrastructure plus large pour la DeFi, l’IA, le gaming, les paiements, les RWAs et plus encore.
Et le réseau continue d’évoluer.
Aujourd’hui, BNB Chain traite des millions d’utilisateurs actifs quotidiens, tout en visant une finalité plus rapide, des frais plus bas et une scalabilité accrue.
Du DeFi summer aux stablecoins, aux RWAs, à l’IA et à la prochaine génération d’applications Web3, BNB Chain a joué un rôle majeur en apportant la crypto à des millions d’utilisateurs.
6 ans de passés.
Les prochains milliards d’utilisateurs sont encore en attente.
Joyeux anniversaire, BNB Chain ! 🟡
#BNBChain #BNB #BNBDay #Web3 #Crypto
$BNB
🎂 Joyeux anniversaire à @BNBChain 🟡
Il y a 6 ans, la BNB Smart Chain a été lancée avec une mission simple : rendre le Web3 plus rapide, moins cher et accessible aux prochains milliards d’utilisateurs.
Regardez ce qu’elle est devenue aujourd’hui 👇
🚀 5 000+ projets en construction à travers l’écosystème
👥 611M+ d’adresses BSC uniques
⚡ 31M de transactions quotidiennes atteignant un record historique
💰 14B$+ de TVL (valeur totale verrouillée) au pic
🏦 1,8B$+ d’actifs du monde réel tokenisés
💵 14B$ de capitalisation de stablecoins au pic
🔥 Réduction de 95 % des attaques malveillantes de MEV
⛽ Des frais de gaz descendus jusqu’à 0,001$
🌐 La BNB Chain s’est étendue au-delà de la BSC avec opBNB et BNB Greenfield, en construisant une infrastructure plus large pour la DeFi, l’IA, le gaming, les paiements, les RWAs et plus encore.
Et le réseau continue d’évoluer.
Aujourd’hui, BNB Chain traite des millions d’utilisateurs actifs quotidiens, tout en visant une finalité plus rapide, des frais plus bas et une scalabilité accrue.
Du DeFi summer aux stablecoins, aux RWAs, à l’IA et à la prochaine génération d’applications Web3, BNB Chain a joué un rôle majeur en apportant la crypto à des millions d’utilisateurs.
6 ans de passés.
Les prochains milliards d’utilisateurs sont encore en attente.
Joyeux anniversaire, BNB Chain ! 🟡
#BNBChain #BNB #BNBDay #Web3 #Crypto
$BNB
Il y a 6 ans, la BNB Smart Chain a été lancée avec une mission simple : rendre le Web3 plus rapide, moins cher et accessible aux prochains milliards d’utilisateurs.
Regardez ce qu’elle est devenue aujourd’hui 👇
🚀 5 000+ projets en construction à travers l’écosystème
👥 611M+ d’adresses BSC uniques
⚡ 31M de transactions quotidiennes atteignant un record historique
💰 14B$+ de TVL (valeur totale verrouillée) au pic
🏦 1,8B$+ d’actifs du monde réel tokenisés
💵 14B$ de capitalisation de stablecoins au pic
🔥 Réduction de 95 % des attaques malveillantes de MEV
⛽ Des frais de gaz descendus jusqu’à 0,001$
🌐 La BNB Chain s’est étendue au-delà de la BSC avec opBNB et BNB Greenfield, en construisant une infrastructure plus large pour la DeFi, l’IA, le gaming, les paiements, les RWAs et plus encore.
Et le réseau continue d’évoluer.
Aujourd’hui, BNB Chain traite des millions d’utilisateurs actifs quotidiens, tout en visant une finalité plus rapide, des frais plus bas et une scalabilité accrue.
Du DeFi summer aux stablecoins, aux RWAs, à l’IA et à la prochaine génération d’applications Web3, BNB Chain a joué un rôle majeur en apportant la crypto à des millions d’utilisateurs.
6 ans de passés.
Les prochains milliards d’utilisateurs sont encore en attente.
Joyeux anniversaire, BNB Chain ! 🟡
#BNBChain #BNB #BNBDay #Web3 #Crypto
$BNB
81
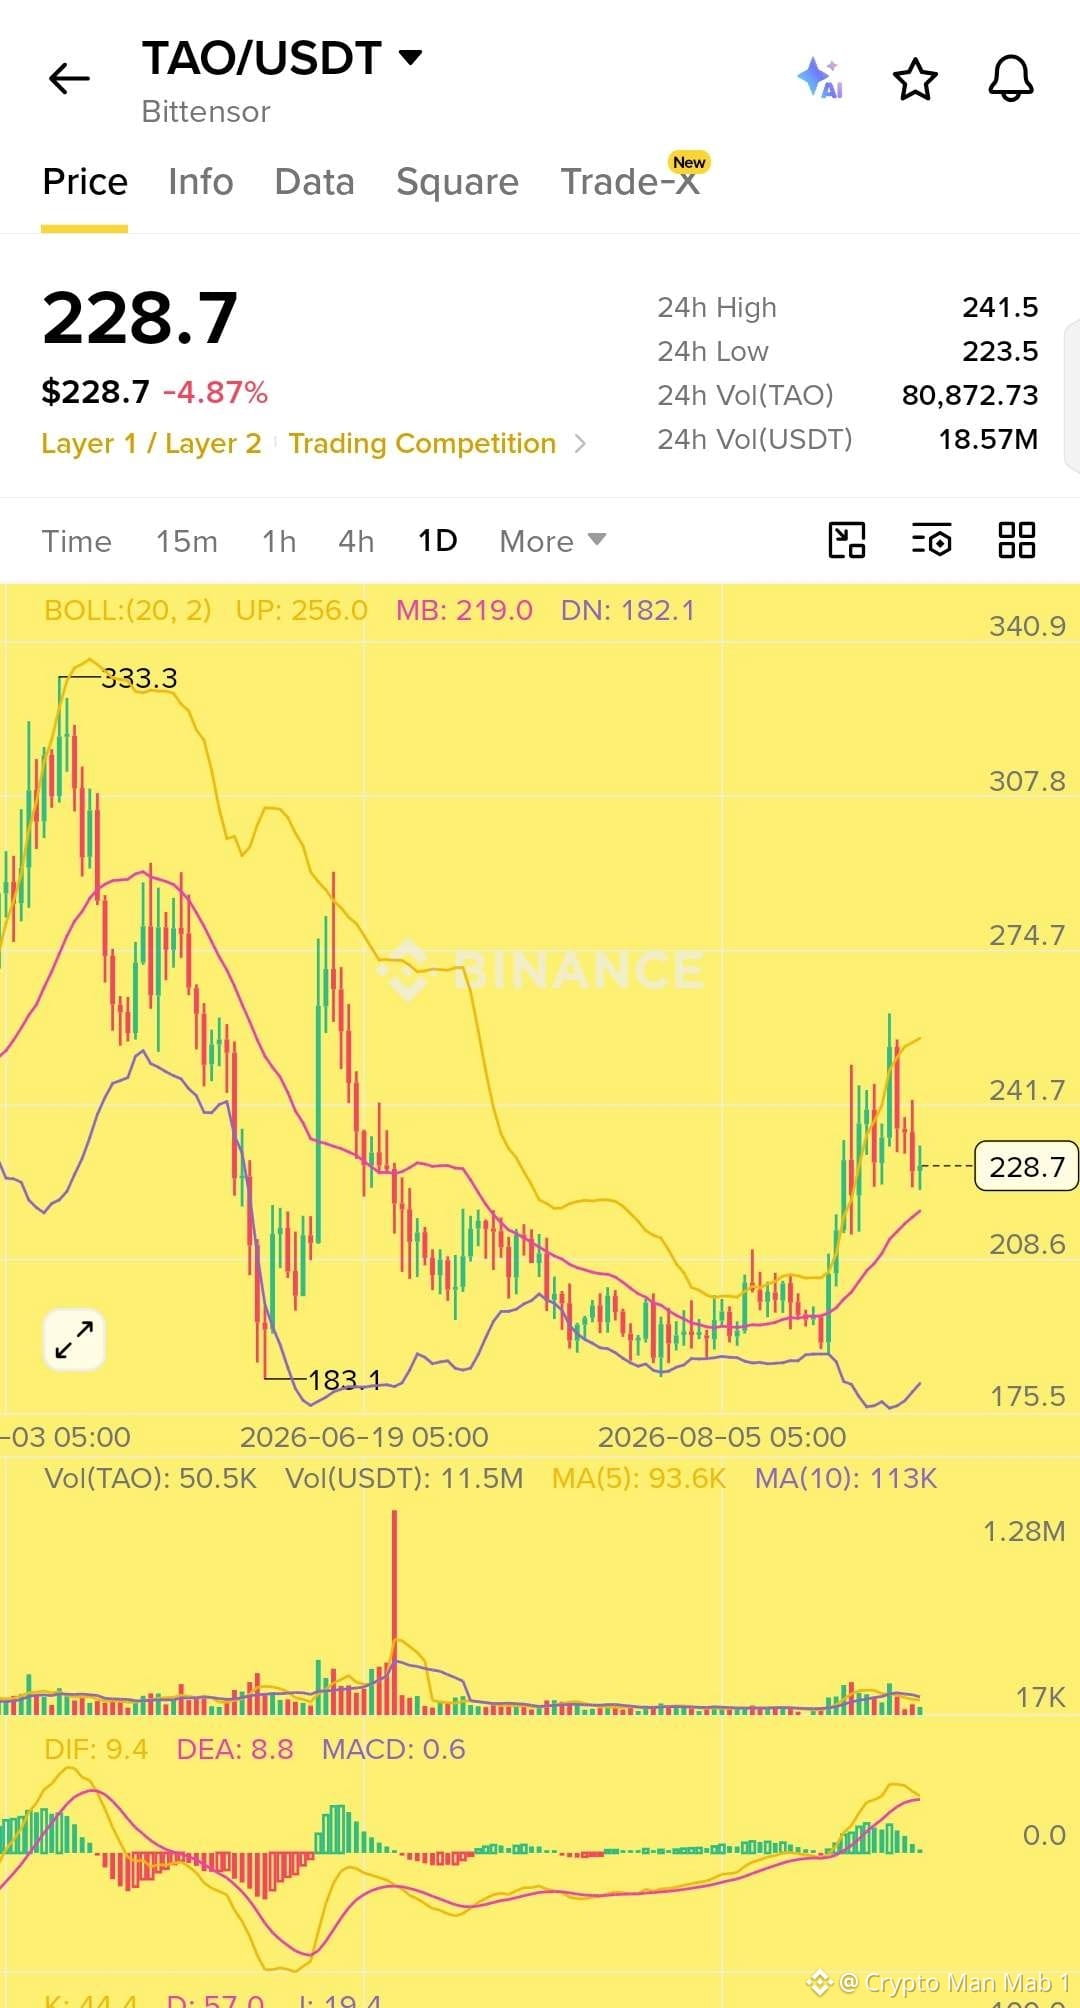
$TAO semble de plus en plus intéressant après la récente cassure 👀
Le prix est passé au-dessus de 240 $, mais il se calme désormais autour de 228 $. L’important, c’est que la structure globale semble encore plus solide que lors de la précédente tendance baissière.
La bande médiane quotidienne de Bollinger se situe autour de 219 $, tandis que le MACD reste en territoire positif. Le volume a également augmenté pendant la cassure, ce qui montre qu’il y avait un réel intérêt acheteur derrière le mouvement.
En ce moment, TAO ressemble à une pause après le rallye. Si les acheteurs reviennent et que le prix parvient à reconquérir la zone des 240 $, cela pourrait être un signe important du retour de l’élan haussier.
Pour l’instant, je surveillerais la façon dont le prix évolue autour de la zone 220–225 $ plutôt que de poursuivre le mouvement. 📈
$TAO semble de plus en plus intéressant après la récente cassure 👀
Le prix est passé au-dessus de 240 $, mais il se calme désormais autour de 228 $. L’important, c’est que la structure globale semble encore plus solide que lors de la précédente tendance baissière.
La bande médiane quotidienne de Bollinger se situe autour de 219 $, tandis que le MACD reste en territoire positif. Le volume a également augmenté pendant la cassure, ce qui montre qu’il y avait un réel intérêt acheteur derrière le mouvement.
En ce moment, TAO ressemble à une pause après le rallye. Si les acheteurs reviennent et que le prix parvient à reconquérir la zone des 240 $, cela pourrait être un signe important du retour de l’élan haussier.
Pour l’instant, je surveillerais la façon dont le prix évolue autour de la zone 220–225 $ plutôt que de poursuivre le mouvement. 📈
Le prix est passé au-dessus de 240 $, mais il se calme désormais autour de 228 $. L’important, c’est que la structure globale semble encore plus solide que lors de la précédente tendance baissière.
La bande médiane quotidienne de Bollinger se situe autour de 219 $, tandis que le MACD reste en territoire positif. Le volume a également augmenté pendant la cassure, ce qui montre qu’il y avait un réel intérêt acheteur derrière le mouvement.
En ce moment, TAO ressemble à une pause après le rallye. Si les acheteurs reviennent et que le prix parvient à reconquérir la zone des 240 $, cela pourrait être un signe important du retour de l’élan haussier.
Pour l’instant, je surveillerais la façon dont le prix évolue autour de la zone 220–225 $ plutôt que de poursuivre le mouvement. 📈
71
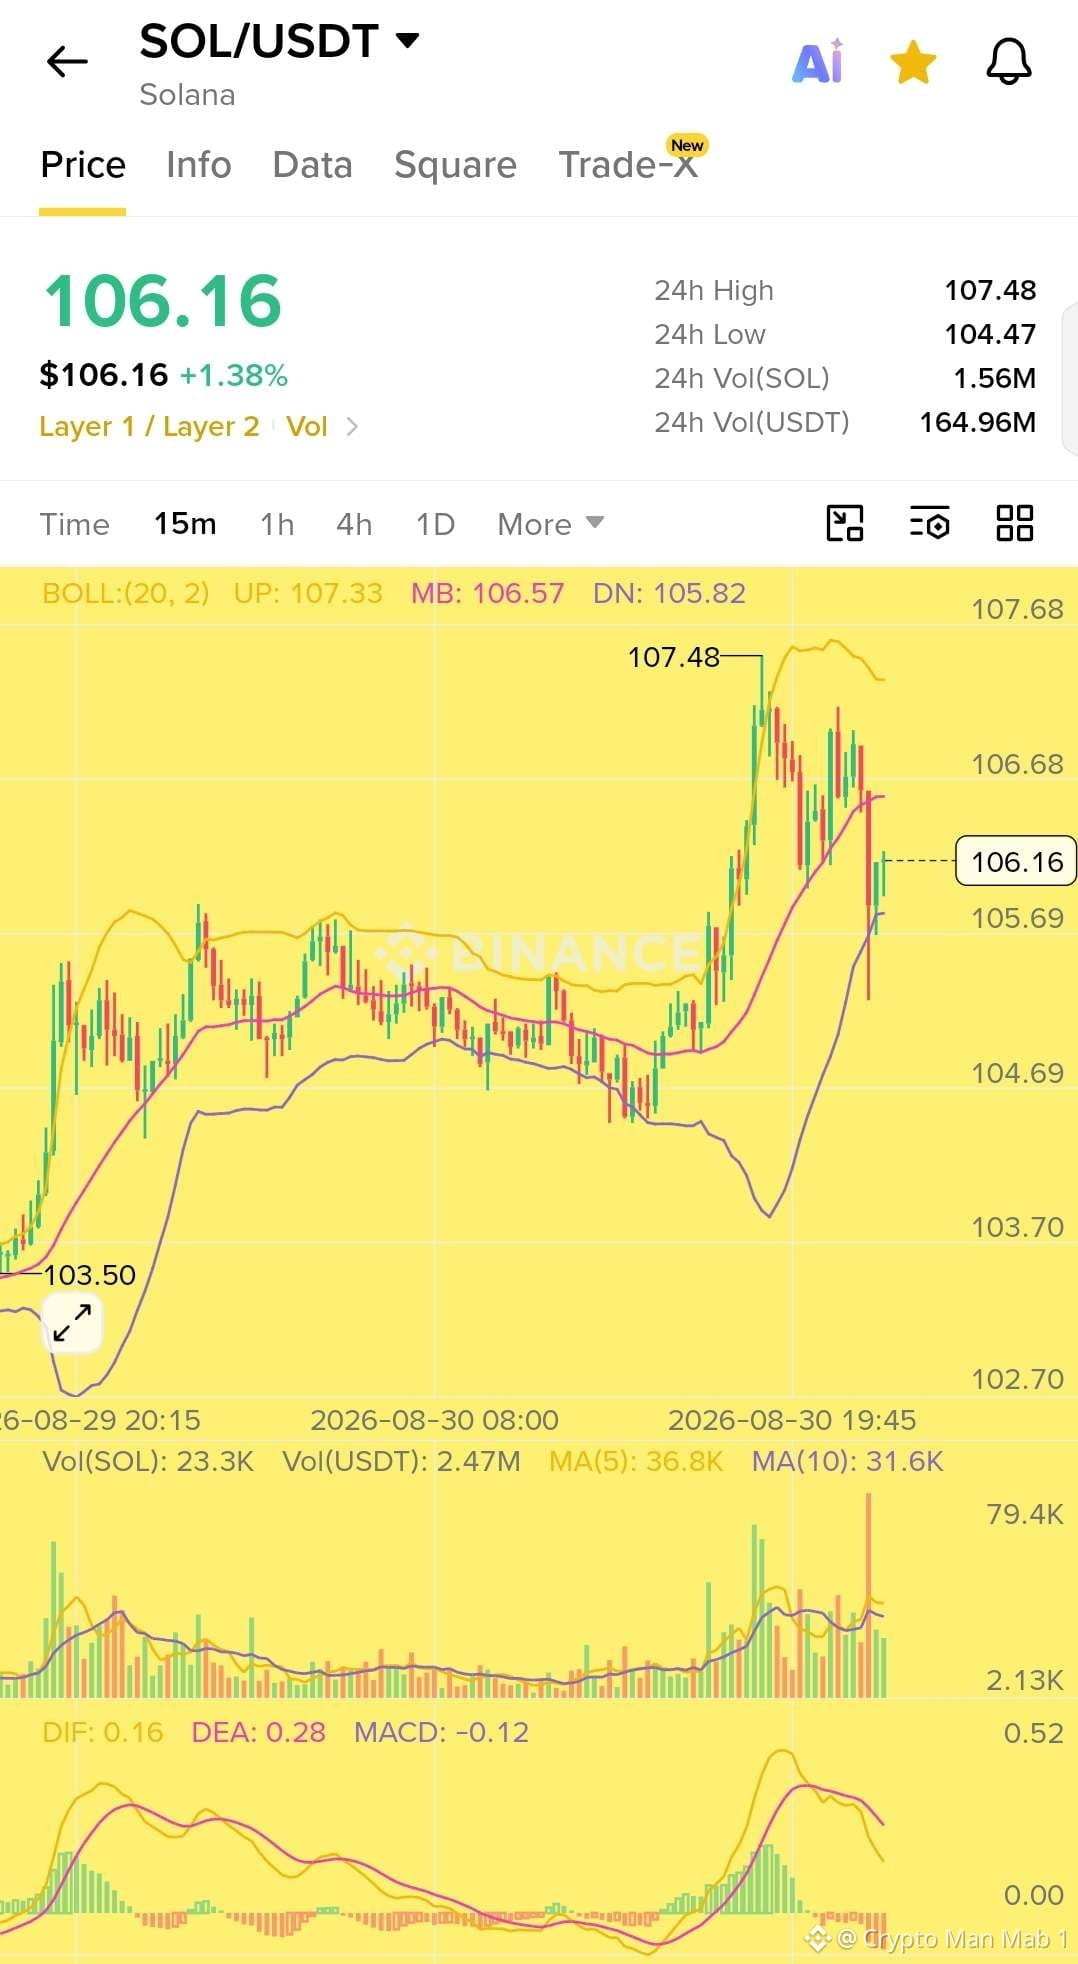
Le vote de gouvernance de $SOL Solana améliore de 25 % la vitesse des transactions
Un vote récent de gouvernance en chaîne sur le réseau Solana a entraîné une augmentation de 25 % de la vitesse des transactions, marquant une amélioration notable de l’efficacité du réseau.
La mise à niveau a été approuvée via le processus de gouvernance en chaîne de Solana, reflétant la capacité du réseau à mettre en œuvre des changements au niveau du protocole grâce au consensus de la communauté.
Le vote de gouvernance de $SOL Solana améliore de 25 % la vitesse des transactions
Un vote récent de gouvernance en chaîne sur le réseau Solana a entraîné une augmentation de 25 % de la vitesse des transactions, marquant une amélioration notable de l’efficacité du réseau.
La mise à niveau a été approuvée via le processus de gouvernance en chaîne de Solana, reflétant la capacité du réseau à mettre en œuvre des changements au niveau du protocole grâce au consensus de la communauté.
Un vote récent de gouvernance en chaîne sur le réseau Solana a entraîné une augmentation de 25 % de la vitesse des transactions, marquant une amélioration notable de l’efficacité du réseau.
La mise à niveau a été approuvée via le processus de gouvernance en chaîne de Solana, reflétant la capacité du réseau à mettre en œuvre des changements au niveau du protocole grâce au consensus de la communauté.
72
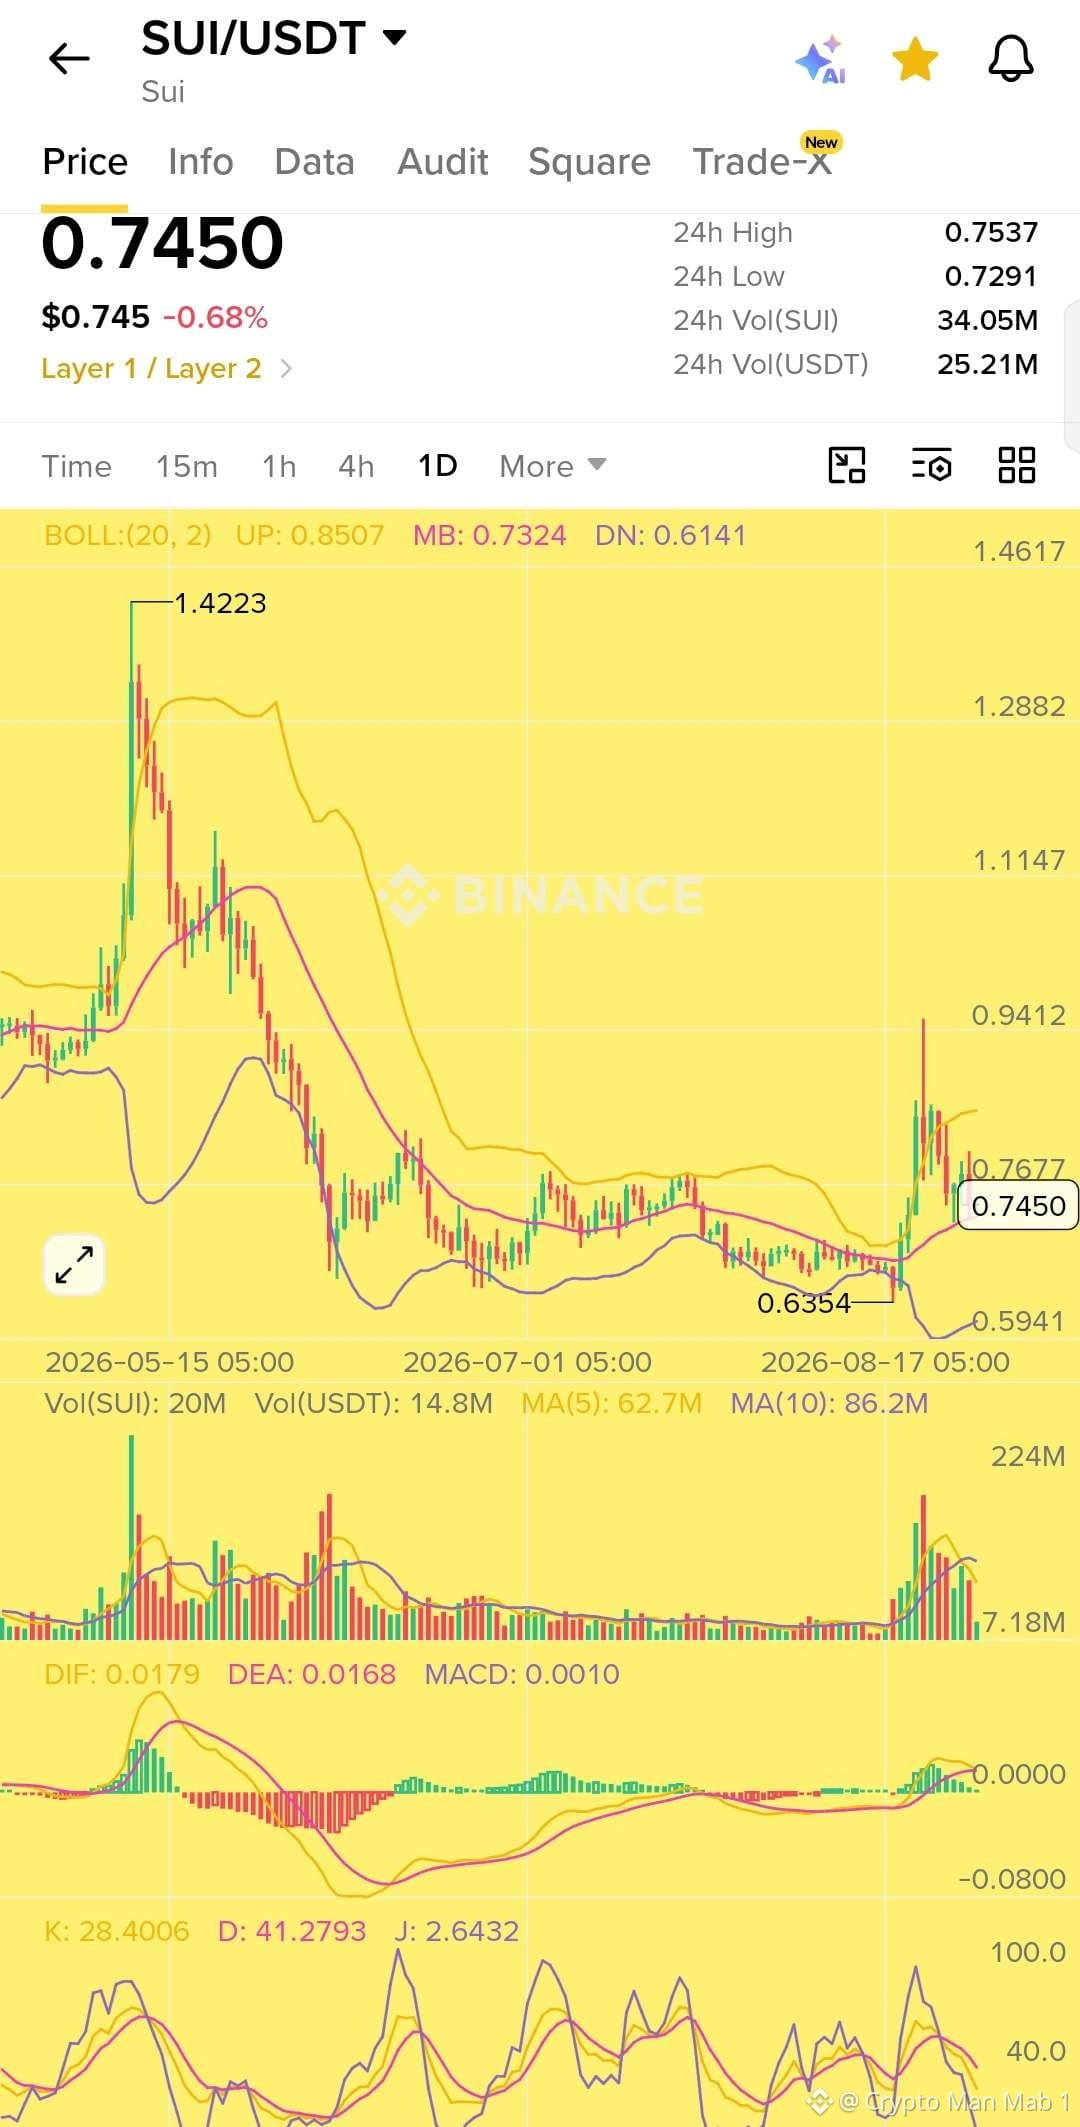
$SUI commence à devenir intéressant ici 👀
Le prix se maintient autour de 0,745 $ et est parvenu à rester au-dessus de la moyenne des bandes de Bollinger près de 0,732 $. Le MACD affiche également un élan positif tandis que le volume a augmenté après le mouvement récent.
Le niveau clé à surveiller maintenant est 0,767 $. Une forte clôture quotidienne au-dessus de cette zone pourrait ouvrir la voie vers 0,80 $, puis 0,85 $, et potentiellement 0,94 $.
Pour moi, la zone 0,72 $ à 0,75 $ est une zone intéressante à surveiller pour un setup long.
Entrée : 0,72 $ à 0,75 $
Confirmation : rupture et clôture au-dessus de 0,767 $
TP : 0,80 $ 0,85 $ 0,94 $
SL : 0,70 $
Si 0,70 $ est cassé avec une forte pression vendeuse, je m’éloignerais des positions longues car 0,635 $ pourrait revenir dans la partie.
Je surveille de près $SUI à partir d’ici. 📈
$SUI commence à devenir intéressant ici 👀
Le prix se maintient autour de 0,745 $ et est parvenu à rester au-dessus de la moyenne des bandes de Bollinger près de 0,732 $. Le MACD affiche également un élan positif tandis que le volume a augmenté après le mouvement récent.
Le niveau clé à surveiller maintenant est 0,767 $. Une forte clôture quotidienne au-dessus de cette zone pourrait ouvrir la voie vers 0,80 $, puis 0,85 $, et potentiellement 0,94 $.
Pour moi, la zone 0,72 $ à 0,75 $ est une zone intéressante à surveiller pour un setup long.
Entrée : 0,72 $ à 0,75 $
Confirmation : rupture et clôture au-dessus de 0,767 $
TP : 0,80 $ 0,85 $ 0,94 $
SL : 0,70 $
Si 0,70 $ est cassé avec une forte pression vendeuse, je m’éloignerais des positions longues car 0,635 $ pourrait revenir dans la partie.
Je surveille de près $SUI à partir d’ici. 📈
Le prix se maintient autour de 0,745 $ et est parvenu à rester au-dessus de la moyenne des bandes de Bollinger près de 0,732 $. Le MACD affiche également un élan positif tandis que le volume a augmenté après le mouvement récent.
Le niveau clé à surveiller maintenant est 0,767 $. Une forte clôture quotidienne au-dessus de cette zone pourrait ouvrir la voie vers 0,80 $, puis 0,85 $, et potentiellement 0,94 $.
Pour moi, la zone 0,72 $ à 0,75 $ est une zone intéressante à surveiller pour un setup long.
Entrée : 0,72 $ à 0,75 $
Confirmation : rupture et clôture au-dessus de 0,767 $
TP : 0,80 $ 0,85 $ 0,94 $
SL : 0,70 $
Si 0,70 $ est cassé avec une forte pression vendeuse, je m’éloignerais des positions longues car 0,635 $ pourrait revenir dans la partie.
Je surveille de près $SUI à partir d’ici. 📈
76
$BTC 🟠 Bitcoin termine sa première transaction quantique sécurisée
Bitcoin aurait terminé sa première transaction sécurisée par QSB ou Quantum Safe Bitcoin.
Cette nouvelle approche est conçue pour protéger Bitcoin contre l’algorithme de Shor, qui pourrait théoriquement permettre à des ordinateurs quantiques puissants de briser la cryptographie par courbes elliptiques sur laquelle Bitcoin s’appuie actuellement.
Ce qui rend la QSB intéressante, c’est qu’elle fonctionne dans le cadre des règles existantes de Bitcoin. Aucun hard fork ni aucun changement de consensus n’a été nécessaire pour exécuter la transaction.
Alors que l’informatique quantique continue de progresser, cela pourrait devenir une étape importante pour rendre Bitcoin plus résilient face aux menaces cryptographiques futures.
L’informatique quantique pourrait encore être dans quelques années avant de représenter une menace réelle, mais s’y préparer dès aujourd’hui pourrait être l’un des défis les plus importants pour la sécurité à long terme de Bitcoin. 🟠
$BTC 🟠 Bitcoin termine sa première transaction quantique sécurisée
Bitcoin aurait terminé sa première transaction sécurisée par QSB ou Quantum Safe Bitcoin.
Cette nouvelle approche est conçue pour protéger Bitcoin contre l’algorithme de Shor, qui pourrait théoriquement permettre à des ordinateurs quantiques puissants de briser la cryptographie par courbes elliptiques sur laquelle Bitcoin s’appuie actuellement.
Ce qui rend la QSB intéressante, c’est qu’elle fonctionne dans le cadre des règles existantes de Bitcoin. Aucun hard fork ni aucun changement de consensus n’a été nécessaire pour exécuter la transaction.
Alors que l’informatique quantique continue de progresser, cela pourrait devenir une étape importante pour rendre Bitcoin plus résilient face aux menaces cryptographiques futures.
L’informatique quantique pourrait encore être dans quelques années avant de représenter une menace réelle, mais s’y préparer dès aujourd’hui pourrait être l’un des défis les plus importants pour la sécurité à long terme de Bitcoin. 🟠
Bitcoin aurait terminé sa première transaction sécurisée par QSB ou Quantum Safe Bitcoin.
Cette nouvelle approche est conçue pour protéger Bitcoin contre l’algorithme de Shor, qui pourrait théoriquement permettre à des ordinateurs quantiques puissants de briser la cryptographie par courbes elliptiques sur laquelle Bitcoin s’appuie actuellement.
Ce qui rend la QSB intéressante, c’est qu’elle fonctionne dans le cadre des règles existantes de Bitcoin. Aucun hard fork ni aucun changement de consensus n’a été nécessaire pour exécuter la transaction.
Alors que l’informatique quantique continue de progresser, cela pourrait devenir une étape importante pour rendre Bitcoin plus résilient face aux menaces cryptographiques futures.
L’informatique quantique pourrait encore être dans quelques années avant de représenter une menace réelle, mais s’y préparer dès aujourd’hui pourrait être l’un des défis les plus importants pour la sécurité à long terme de Bitcoin. 🟠
68
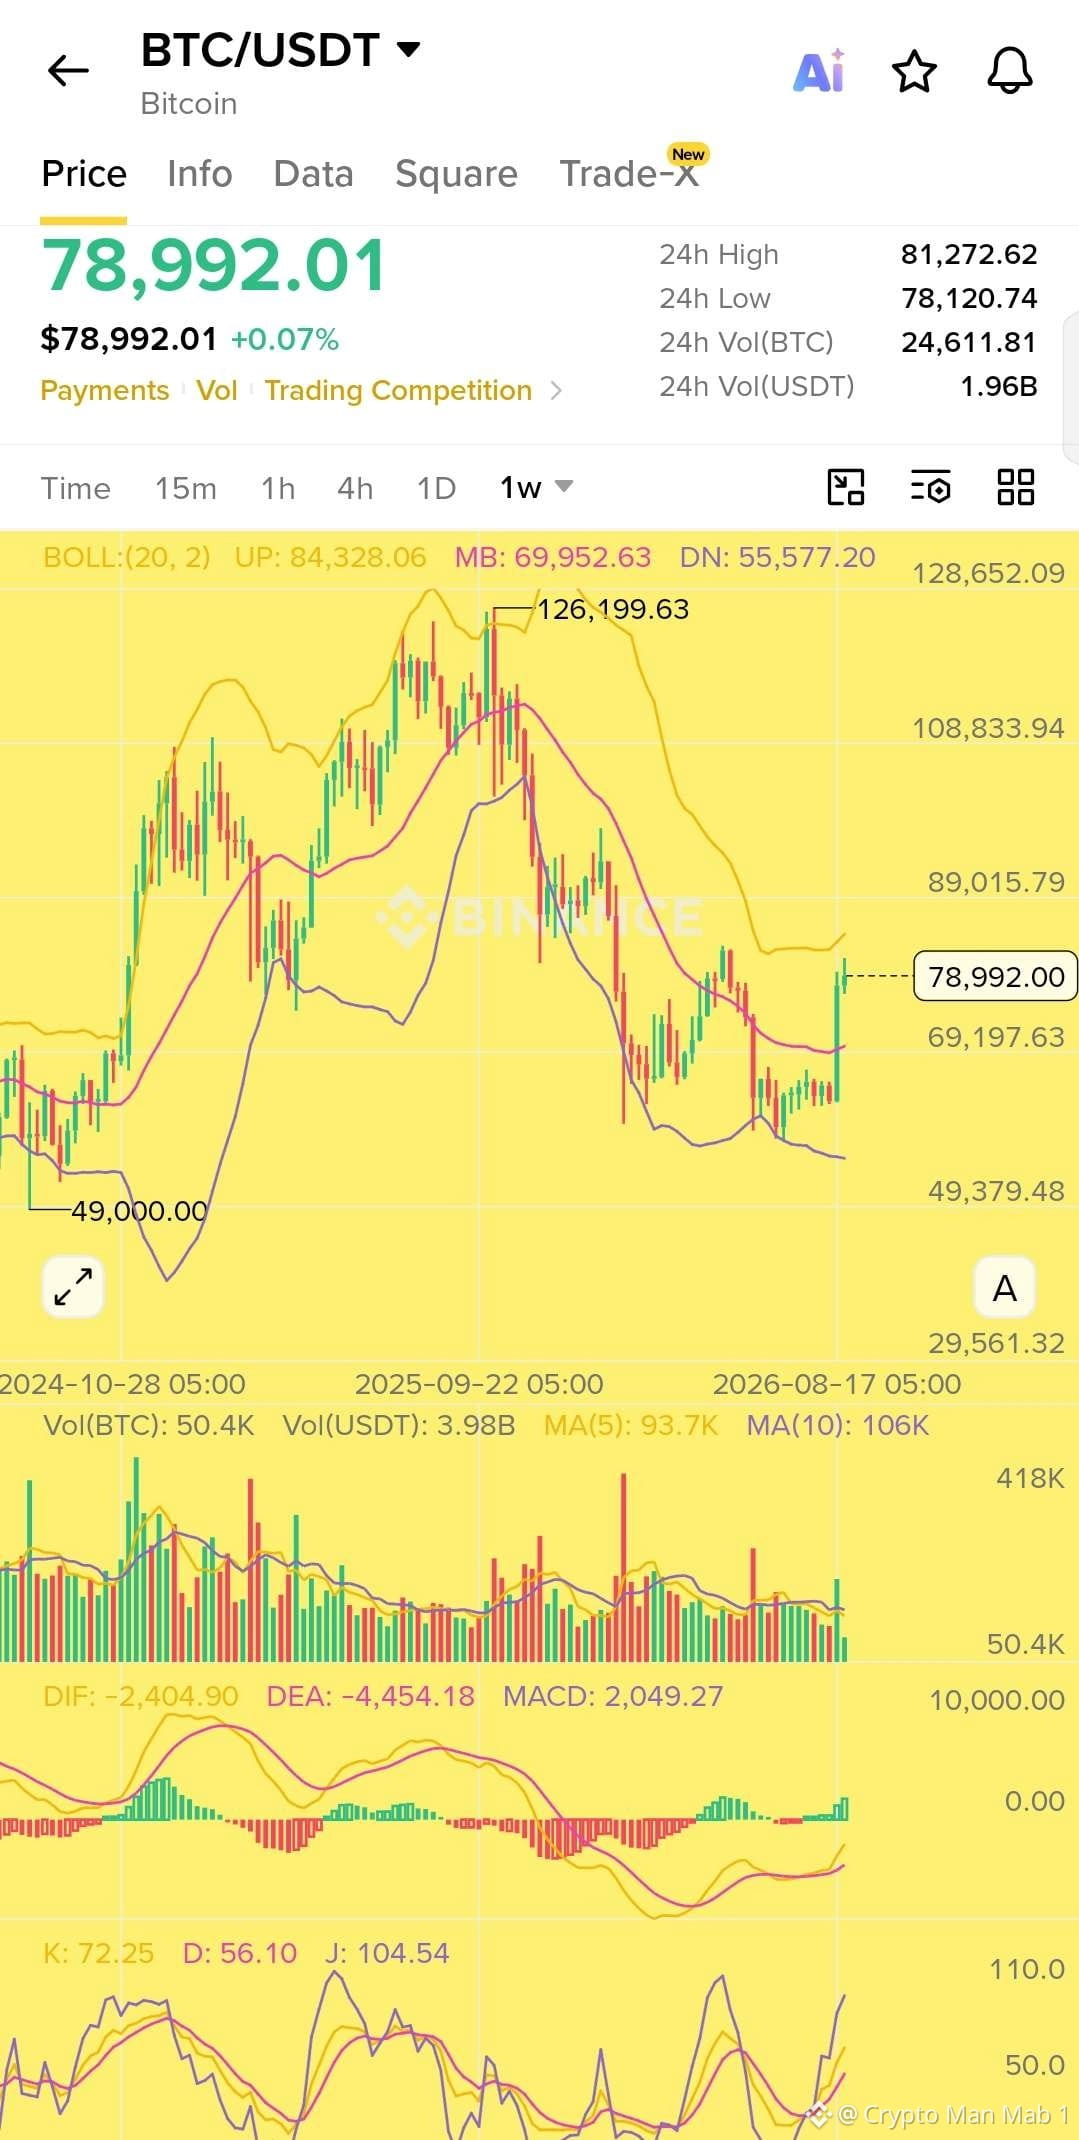
$BTC recommence à devenir intéressant 👀
Sur le graphique hebdomadaire, le Bitcoin a repoussé le niveau des 78K après un fort rebond depuis la zone des 55K.
Le niveau important à présent est entre 81K et 84K. C’est là que je m’attends à ce que les vendeurs testent la solidité de ce mouvement.
Si BTC casse et clôture la semaine au-dessus de 84,3K, alors la prochaine grande zone à surveiller se situera autour de 89K.
L’élan s’améliore aussi. Le MACD est repassé en territoire positif et la structure hebdomadaire semble beaucoup plus solide qu’il y a quelques semaines.
Mais je ne poursuivrais pas le “pump” à l’aveugle.
Si BTC est rejeté de 81K à 84K, alors un repli vers 75K ou même 70K ne me surprendrait pas.
Pour moi, le niveau clé reste 70K.
Au-dessus, je reste haussier.
Maintenant, BTC doit prouver que cette reprise est plus qu’un simple rebond. 👀
$BTC recommence à devenir intéressant 👀
Sur le graphique hebdomadaire, le Bitcoin a repoussé le niveau des 78K après un fort rebond depuis la zone des 55K.
Le niveau important à présent est entre 81K et 84K. C’est là que je m’attends à ce que les vendeurs testent la solidité de ce mouvement.
Si BTC casse et clôture la semaine au-dessus de 84,3K, alors la prochaine grande zone à surveiller se situera autour de 89K.
L’élan s’améliore aussi. Le MACD est repassé en territoire positif et la structure hebdomadaire semble beaucoup plus solide qu’il y a quelques semaines.
Mais je ne poursuivrais pas le “pump” à l’aveugle.
Si BTC est rejeté de 81K à 84K, alors un repli vers 75K ou même 70K ne me surprendrait pas.
Pour moi, le niveau clé reste 70K.
Au-dessus, je reste haussier.
Maintenant, BTC doit prouver que cette reprise est plus qu’un simple rebond. 👀
Sur le graphique hebdomadaire, le Bitcoin a repoussé le niveau des 78K après un fort rebond depuis la zone des 55K.
Le niveau important à présent est entre 81K et 84K. C’est là que je m’attends à ce que les vendeurs testent la solidité de ce mouvement.
Si BTC casse et clôture la semaine au-dessus de 84,3K, alors la prochaine grande zone à surveiller se situera autour de 89K.
L’élan s’améliore aussi. Le MACD est repassé en territoire positif et la structure hebdomadaire semble beaucoup plus solide qu’il y a quelques semaines.
Mais je ne poursuivrais pas le “pump” à l’aveugle.
Si BTC est rejeté de 81K à 84K, alors un repli vers 75K ou même 70K ne me surprendrait pas.
Pour moi, le niveau clé reste 70K.
Au-dessus, je reste haussier.
Maintenant, BTC doit prouver que cette reprise est plus qu’un simple rebond. 👀
93
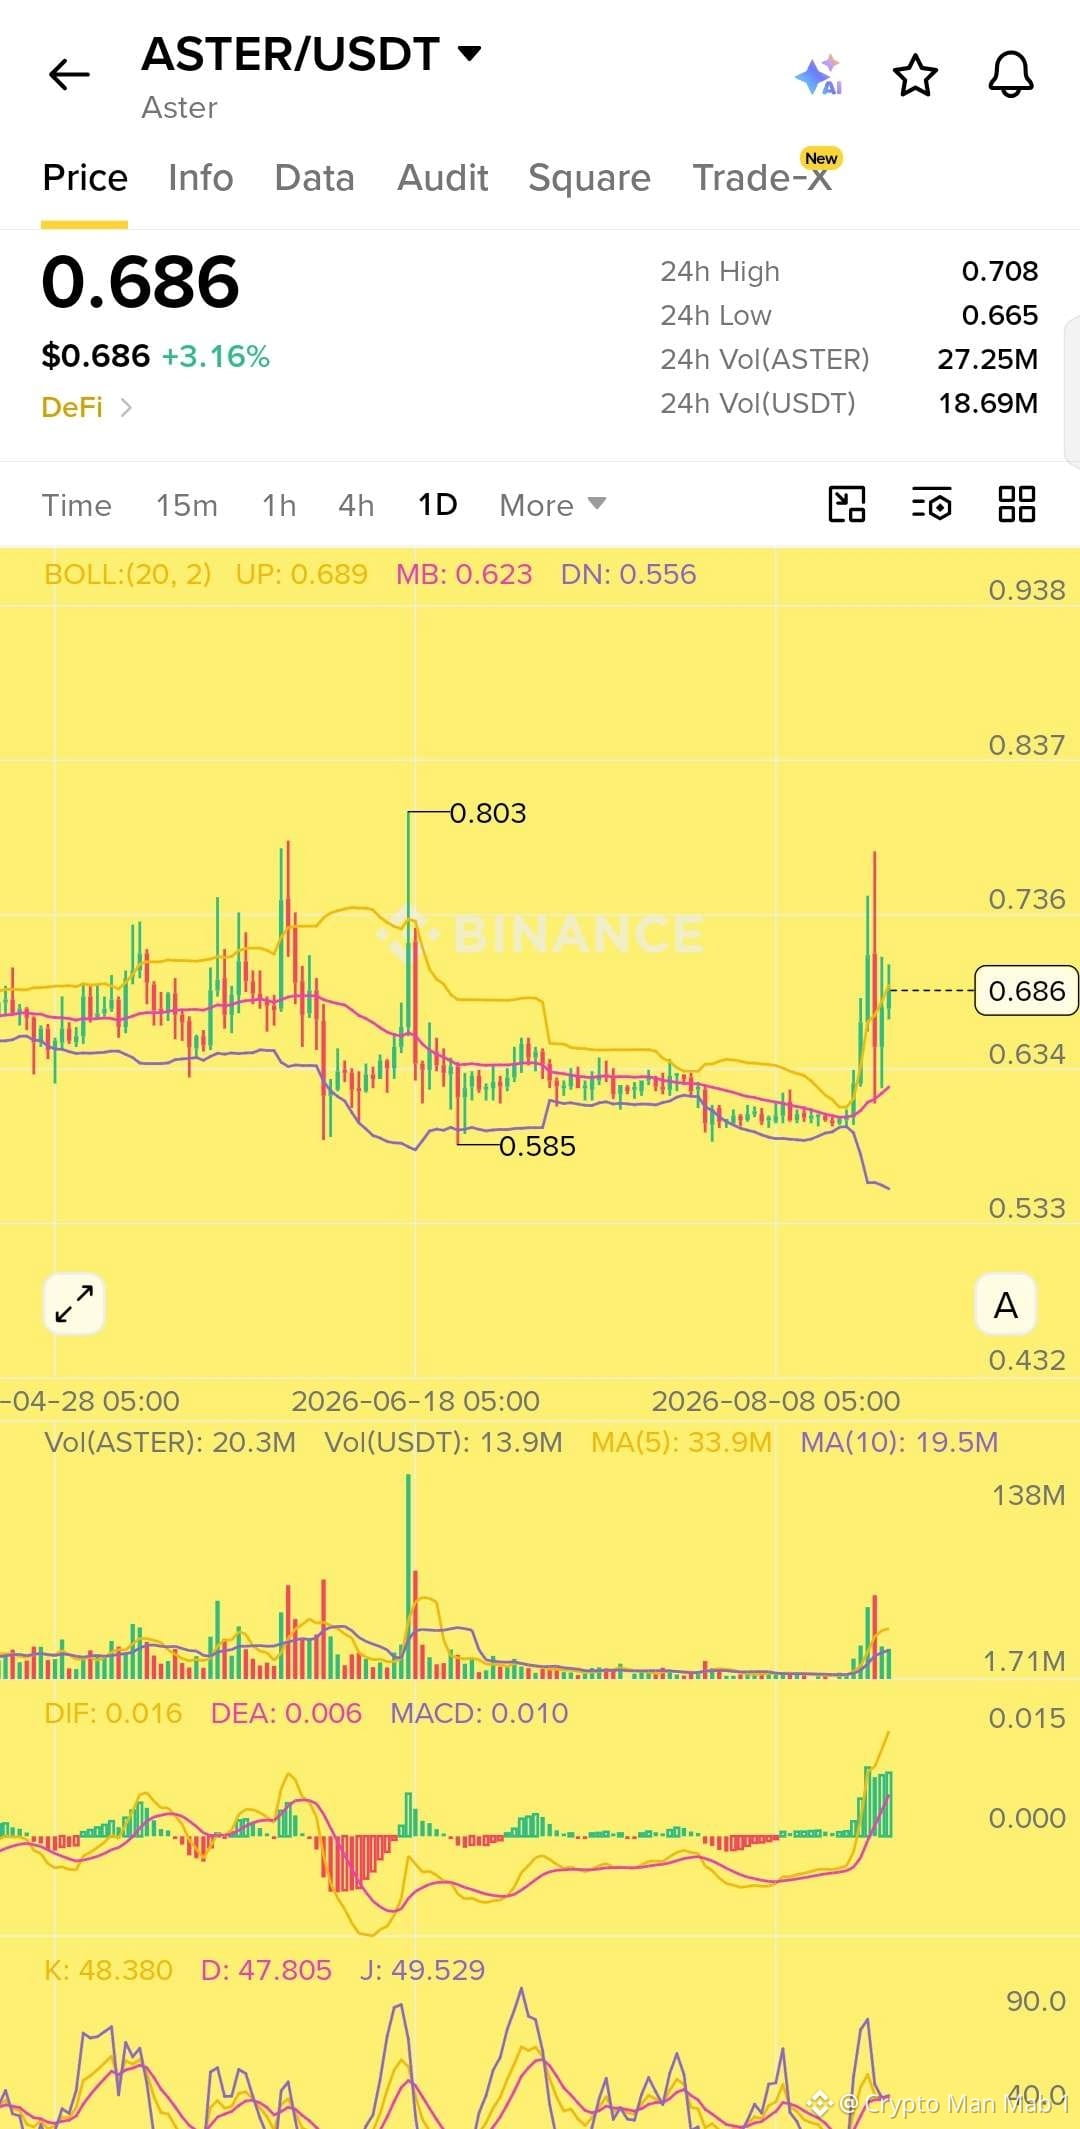
$ASTER et World LibertyFi ouvrent de grosses récompenses pour les marchés USD1 👀
Aster a lancé la phase 1 de sa campagne RWA USD1, qui se poursuivra jusqu’au 31 décembre 2026.
La campagne inclut :
125M de récompenses $WLFI basées sur l’open interest éligible
6,25M de récompenses $USD1 basées sur le volume de trading éligible
Et la partie intéressante, c’est que vous pouvez être éligible aux deux pools de récompenses, car l’open interest et le volume de trading sont calculés séparément.
Aster accorde également un boost d’open interest x2 aux positions RWA libellées en USD1 éligibles.
Pour obtenir le boost complet en mode Single Asset (actif unique), vous devez utiliser uniquement USD1 comme collatéral.
En mode Multi Asset (multi-actifs), USD1 doit représenter plus de 50% de votre collatéral moyen.
Cela pourrait rendre les marchés RWA en USD1 très intéressants pour les traders qui cherchent à maximiser leurs récompenses tout en trading.
Gardez un œil sur celui-ci 👀
$ASTER et World LibertyFi ouvrent de grosses récompenses pour les marchés USD1 👀
Aster a lancé la phase 1 de sa campagne RWA USD1, qui se poursuivra jusqu’au 31 décembre 2026.
La campagne inclut :
125M de récompenses $WLFI basées sur l’open interest éligible
6,25M de récompenses $USD1 basées sur le volume de trading éligible
Et la partie intéressante, c’est que vous pouvez être éligible aux deux pools de récompenses, car l’open interest et le volume de trading sont calculés séparément.
Aster accorde également un boost d’open interest x2 aux positions RWA libellées en USD1 éligibles.
Pour obtenir le boost complet en mode Single Asset (actif unique), vous devez utiliser uniquement USD1 comme collatéral.
En mode Multi Asset (multi-actifs), USD1 doit représenter plus de 50% de votre collatéral moyen.
Cela pourrait rendre les marchés RWA en USD1 très intéressants pour les traders qui cherchent à maximiser leurs récompenses tout en trading.
Gardez un œil sur celui-ci 👀
Aster a lancé la phase 1 de sa campagne RWA USD1, qui se poursuivra jusqu’au 31 décembre 2026.
La campagne inclut :
125M de récompenses $WLFI basées sur l’open interest éligible
6,25M de récompenses $USD1 basées sur le volume de trading éligible
Et la partie intéressante, c’est que vous pouvez être éligible aux deux pools de récompenses, car l’open interest et le volume de trading sont calculés séparément.
Aster accorde également un boost d’open interest x2 aux positions RWA libellées en USD1 éligibles.
Pour obtenir le boost complet en mode Single Asset (actif unique), vous devez utiliser uniquement USD1 comme collatéral.
En mode Multi Asset (multi-actifs), USD1 doit représenter plus de 50% de votre collatéral moyen.
Cela pourrait rendre les marchés RWA en USD1 très intéressants pour les traders qui cherchent à maximiser leurs récompenses tout en trading.
Gardez un œil sur celui-ci 👀
70
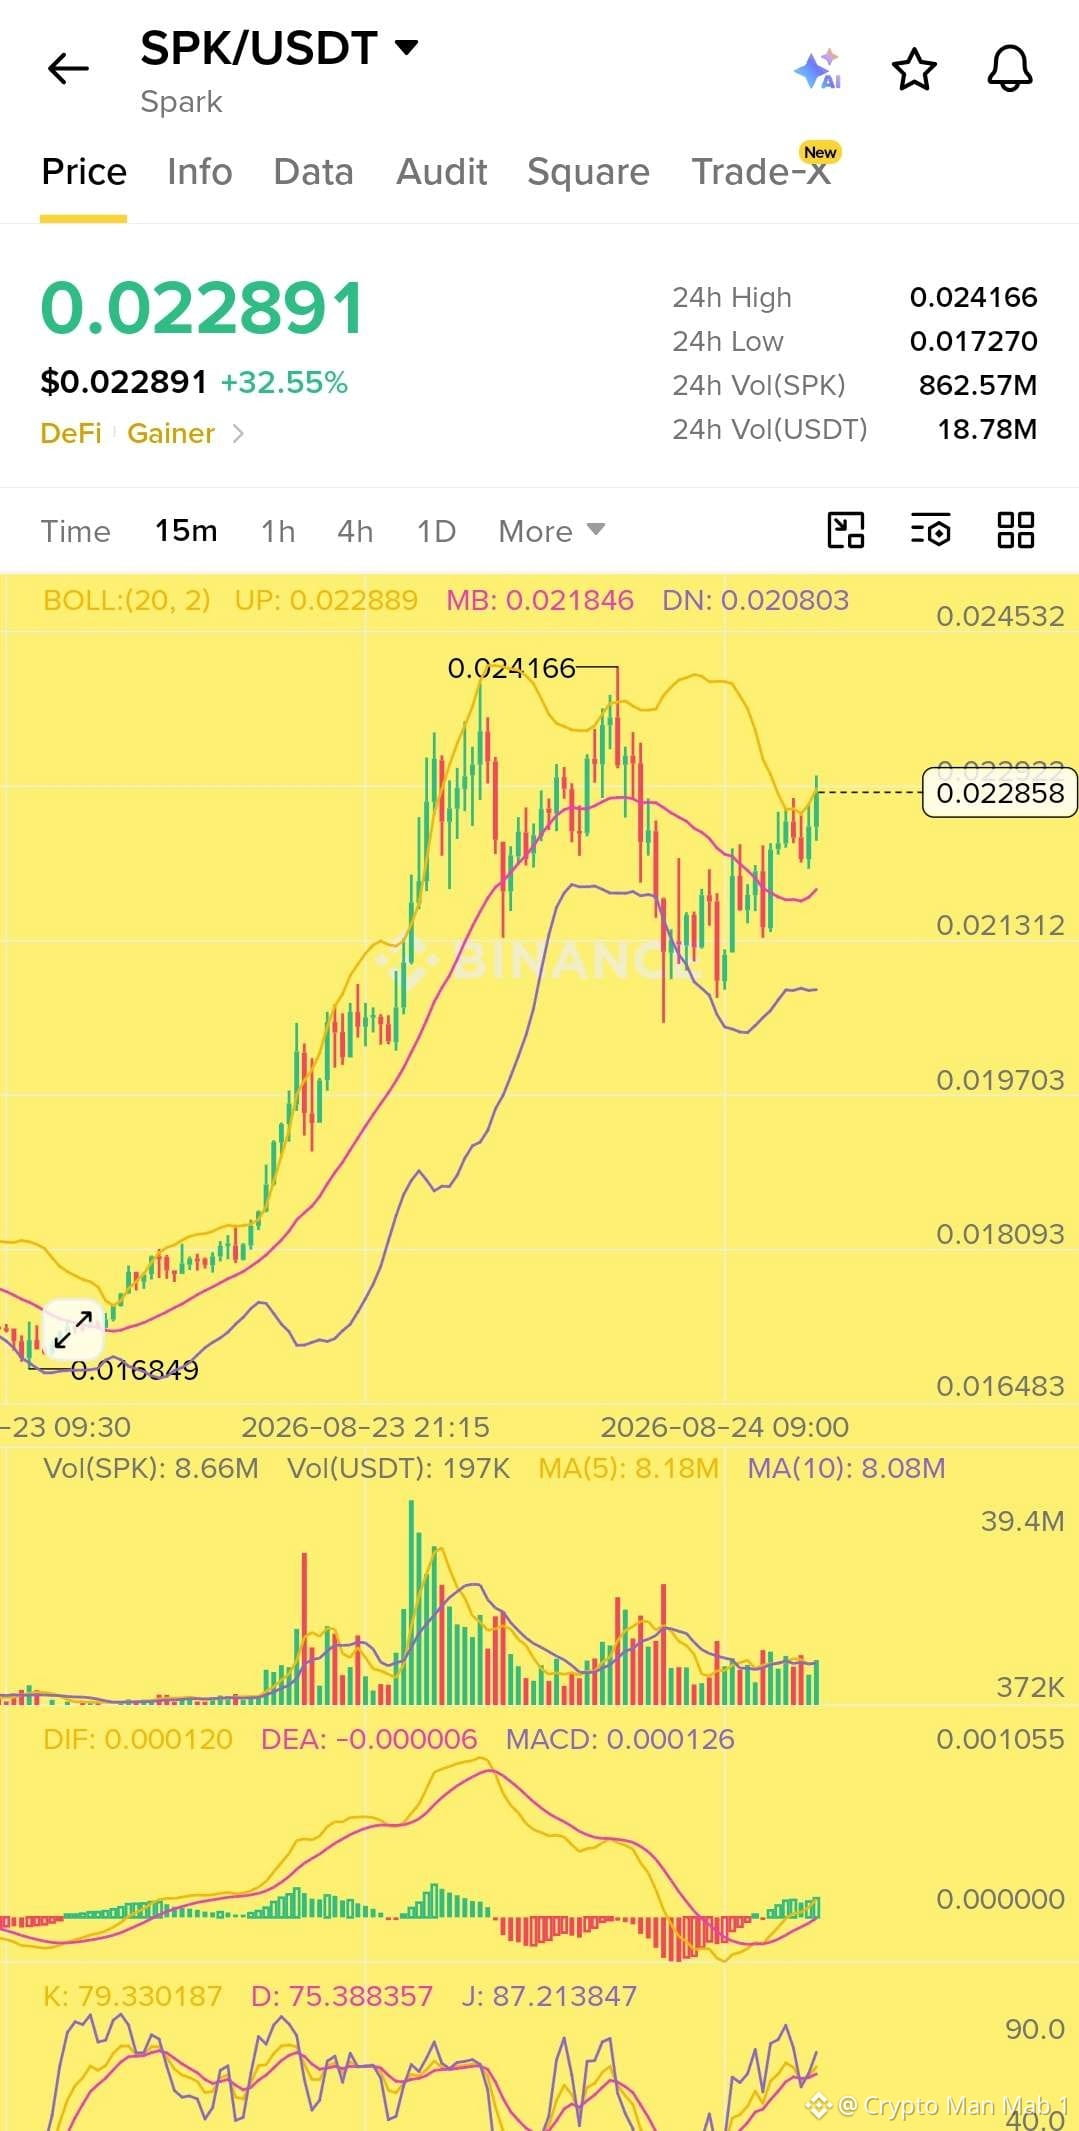
$SPK affiche une forte dynamique haussière sur le graphique 15M 📈
Le prix se situe actuellement autour de $0.02289 après une forte impulsion à la hausse. La MACD passe au vert et le prix reste au-dessus de la moyenne des bandes de Bollinger, ce qui maintient la structure à court terme positive.
La zone clé à surveiller est $0.0230-$0.0232. Une cassure nette avec un volume solide pourrait ouvrir la voie vers $0.0238, puis vers le plus haut sur 24H autour de $0.02416.
Cependant, le KDJ est déjà en zone de surachat, donc poursuivre le prix actuel est risqué. Un repli vers $0.0220-$0.0223 pourrait offrir une meilleure entrée à l’achat si le support tient.
Support : $0.0220-$0.0223
Résistance : $0.0230-$0.0232
Prochaine cible : $0.0238-$0.02416
Haussier au-dessus du support, mais attention aux rejets près de la résistance. DYOR.
$SPK affiche une forte dynamique haussière sur le graphique 15M 📈
Le prix se situe actuellement autour de $0.02289 après une forte impulsion à la hausse. La MACD passe au vert et le prix reste au-dessus de la moyenne des bandes de Bollinger, ce qui maintient la structure à court terme positive.
La zone clé à surveiller est $0.0230-$0.0232. Une cassure nette avec un volume solide pourrait ouvrir la voie vers $0.0238, puis vers le plus haut sur 24H autour de $0.02416.
Cependant, le KDJ est déjà en zone de surachat, donc poursuivre le prix actuel est risqué. Un repli vers $0.0220-$0.0223 pourrait offrir une meilleure entrée à l’achat si le support tient.
Support : $0.0220-$0.0223
Résistance : $0.0230-$0.0232
Prochaine cible : $0.0238-$0.02416
Haussier au-dessus du support, mais attention aux rejets près de la résistance. DYOR.
Le prix se situe actuellement autour de $0.02289 après une forte impulsion à la hausse. La MACD passe au vert et le prix reste au-dessus de la moyenne des bandes de Bollinger, ce qui maintient la structure à court terme positive.
La zone clé à surveiller est $0.0230-$0.0232. Une cassure nette avec un volume solide pourrait ouvrir la voie vers $0.0238, puis vers le plus haut sur 24H autour de $0.02416.
Cependant, le KDJ est déjà en zone de surachat, donc poursuivre le prix actuel est risqué. Un repli vers $0.0220-$0.0223 pourrait offrir une meilleure entrée à l’achat si le support tient.
Support : $0.0220-$0.0223
Résistance : $0.0230-$0.0232
Prochaine cible : $0.0238-$0.02416
Haussier au-dessus du support, mais attention aux rejets près de la résistance. DYOR.
75
Zcash a officiellement atteint son plus haut niveau en 8 ans.
$ZEC a bondi de 47% pour atteindre 865 $, un niveau qu’il n’avait plus vu depuis janvier 2018, d’après CoinDesk.
En juin, le jeton avait chuté à 250 $ après qu’une IA a découvert une faille critique de contrefaçon, active depuis quatre ans. Depuis ce point bas, $ZEC a bondi de 3,4x.
La reprise a pris de la vitesse après que Grayscale a déposé une demande pour convertir son Zcash Trust en ce qui serait le premier ETF au comptant de ZEC aux États-Unis, selon The Block.
Même avec cette hausse, $ZEC reste encore d’environ 73% en dessous de son sommet historique de 3 191 $.
Zcash a officiellement atteint son plus haut niveau en 8 ans.
$ZEC a bondi de 47% pour atteindre 865 $, un niveau qu’il n’avait plus vu depuis janvier 2018, d’après CoinDesk.
En juin, le jeton avait chuté à 250 $ après qu’une IA a découvert une faille critique de contrefaçon, active depuis quatre ans. Depuis ce point bas, $ZEC a bondi de 3,4x.
La reprise a pris de la vitesse après que Grayscale a déposé une demande pour convertir son Zcash Trust en ce qui serait le premier ETF au comptant de ZEC aux États-Unis, selon The Block.
Même avec cette hausse, $ZEC reste encore d’environ 73% en dessous de son sommet historique de 3 191 $.
$ZEC a bondi de 47% pour atteindre 865 $, un niveau qu’il n’avait plus vu depuis janvier 2018, d’après CoinDesk.
En juin, le jeton avait chuté à 250 $ après qu’une IA a découvert une faille critique de contrefaçon, active depuis quatre ans. Depuis ce point bas, $ZEC a bondi de 3,4x.
La reprise a pris de la vitesse après que Grayscale a déposé une demande pour convertir son Zcash Trust en ce qui serait le premier ETF au comptant de ZEC aux États-Unis, selon The Block.
Même avec cette hausse, $ZEC reste encore d’environ 73% en dessous de son sommet historique de 3 191 $.
54
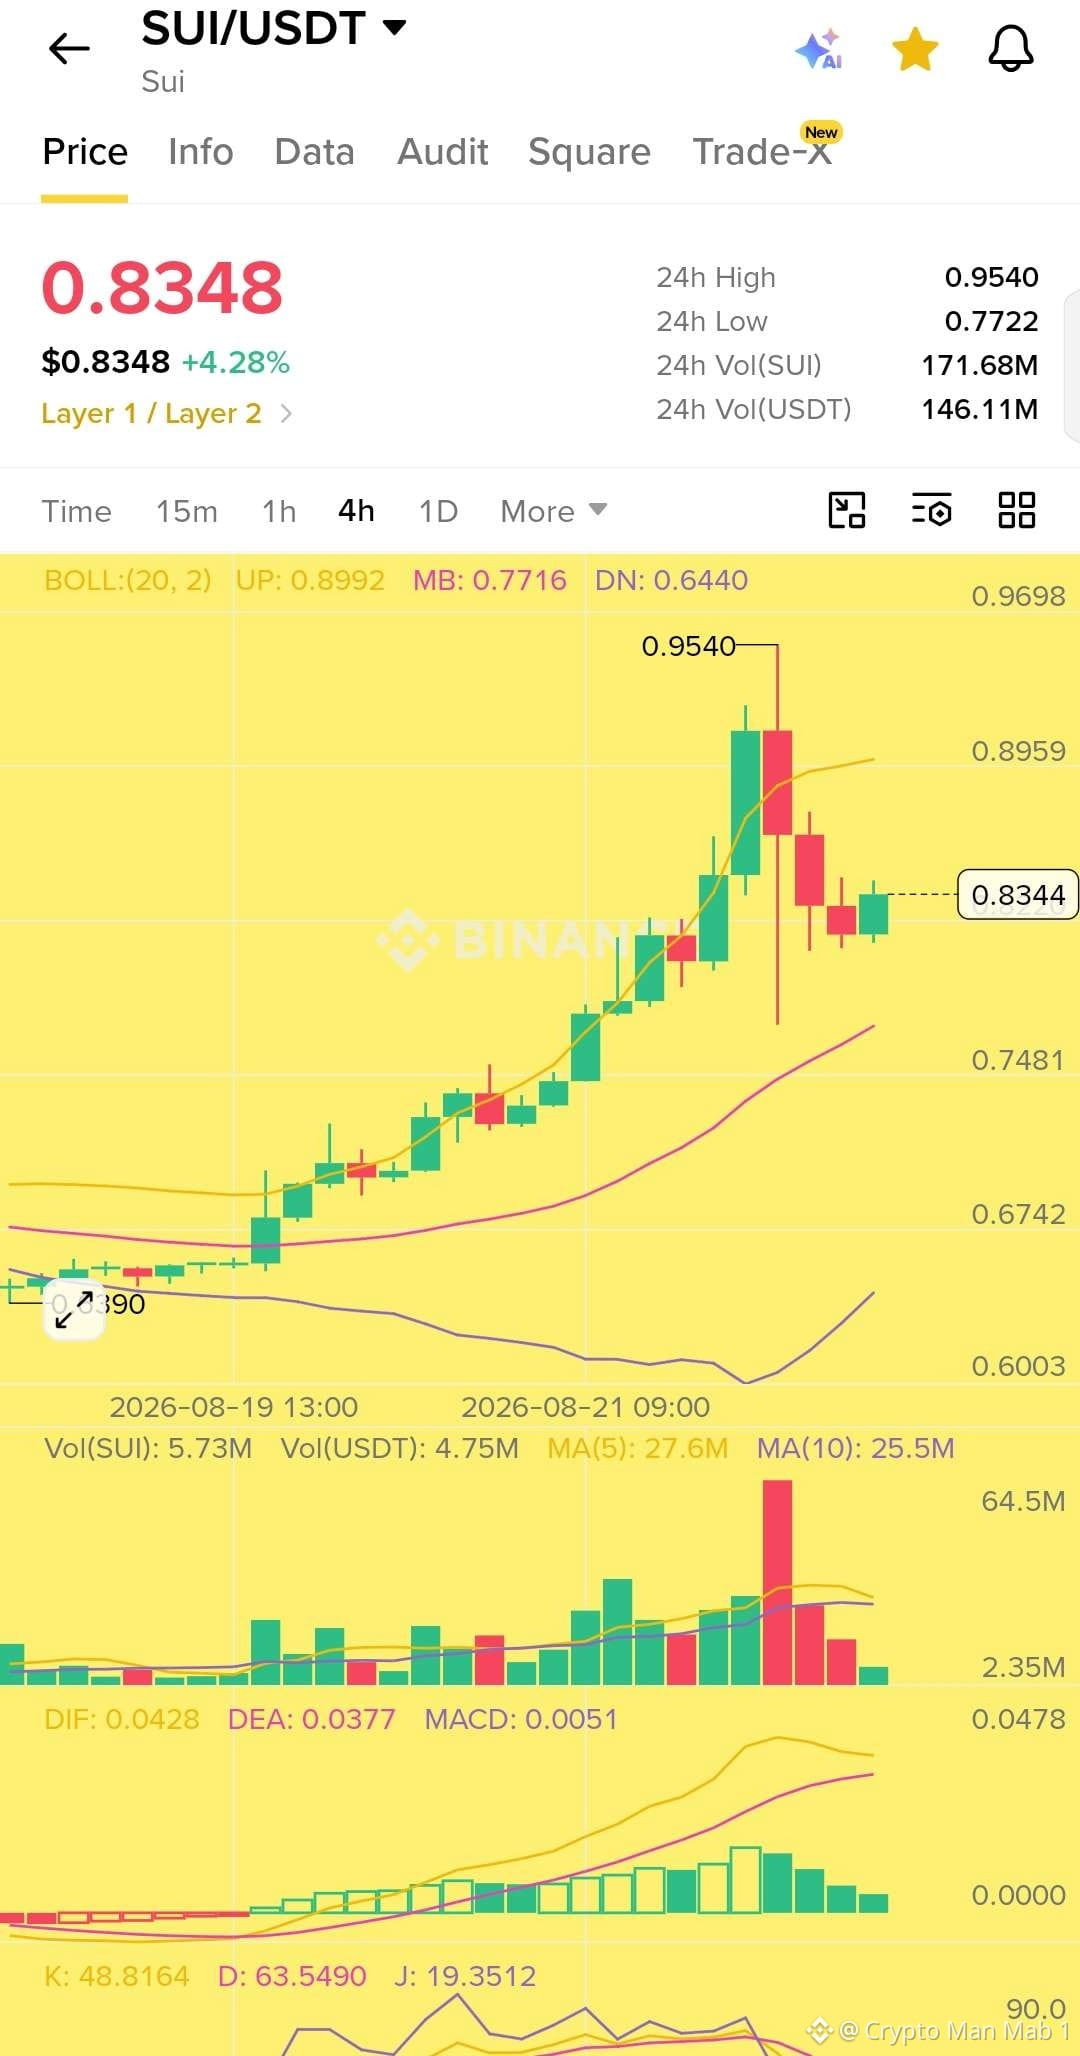
$SUI assis à $0.8348 en ce moment, +4,28% sur la journée. Honnêtement, quelques jours sauvages : ce truc est parti d’environ $0,60 jusqu’à $0,954 avant de redescendre.
Cette bougie haute est arrivée avec un énorme pic de volume (la plus grande barre de tout le graphique), ce qui signifie généralement que les gens ont commencé à prendre leurs profits massivement. Depuis, ça a continué de se replier ; maintenant, on oscille autour de la zone $0,77 à $0,83.
Techniquement, on est toujours dans une tendance haussière. Le MACD reste positif, le prix est au-dessus des moyennes mobiles clés, mais le momentum à court terme (KDJ) commence à s’atténuer. Donc ça ressemble davantage à une pause qu’à un retournement complet, mais ça vaut le coup de surveiller si ça peut tenir au-dessus des supports $0,77 à $0,80.
Ce n’est pas un conseil financier, je fais juste le suivi du graphique. DYOR 🙏
$SUI assis à $0.8348 en ce moment, +4,28% sur la journée. Honnêtement, quelques jours sauvages : ce truc est parti d’environ $0,60 jusqu’à $0,954 avant de redescendre.
Cette bougie haute est arrivée avec un énorme pic de volume (la plus grande barre de tout le graphique), ce qui signifie généralement que les gens ont commencé à prendre leurs profits massivement. Depuis, ça a continué de se replier ; maintenant, on oscille autour de la zone $0,77 à $0,83.
Techniquement, on est toujours dans une tendance haussière. Le MACD reste positif, le prix est au-dessus des moyennes mobiles clés, mais le momentum à court terme (KDJ) commence à s’atténuer. Donc ça ressemble davantage à une pause qu’à un retournement complet, mais ça vaut le coup de surveiller si ça peut tenir au-dessus des supports $0,77 à $0,80.
Ce n’est pas un conseil financier, je fais juste le suivi du graphique. DYOR 🙏
Cette bougie haute est arrivée avec un énorme pic de volume (la plus grande barre de tout le graphique), ce qui signifie généralement que les gens ont commencé à prendre leurs profits massivement. Depuis, ça a continué de se replier ; maintenant, on oscille autour de la zone $0,77 à $0,83.
Techniquement, on est toujours dans une tendance haussière. Le MACD reste positif, le prix est au-dessus des moyennes mobiles clés, mais le momentum à court terme (KDJ) commence à s’atténuer. Donc ça ressemble davantage à une pause qu’à un retournement complet, mais ça vaut le coup de surveiller si ça peut tenir au-dessus des supports $0,77 à $0,80.
Ce n’est pas un conseil financier, je fais juste le suivi du graphique. DYOR 🙏
63
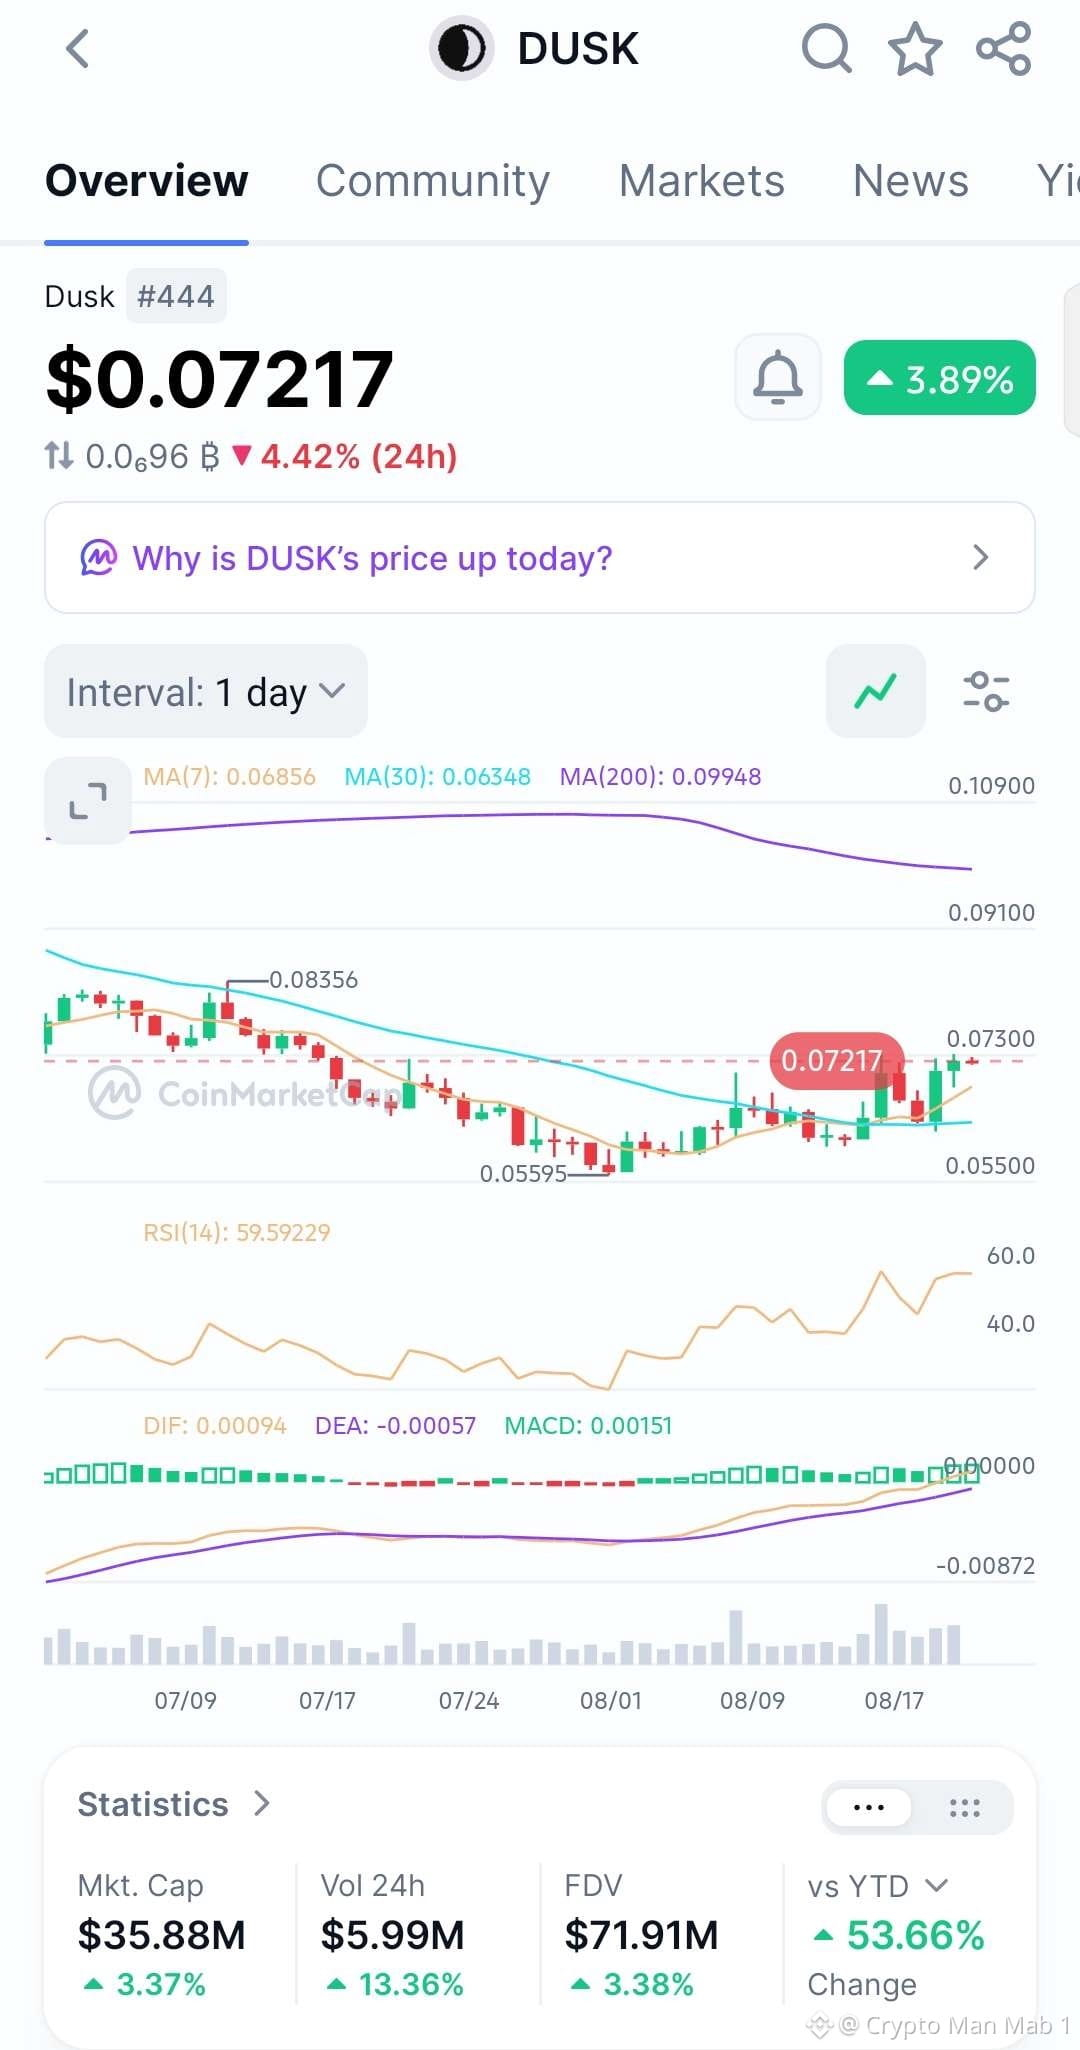
$DUSK montre une certaine force intéressante sur le graphique journalier 👀
Le prix se situe autour de 0,07217 et a regagné au-dessus de la moyenne mobile sur 7 jours à 0,06856 ainsi que de la moyenne mobile sur 30 jours à 0,06348.
Le RSI est proche de 60, ce qui indique que l’élan haussier se construit, mais il n’est pas encore en zone de surachat.
Le MACD est également en train de repasser dans le positif, avec un histogramme qui s’élargit, ce qui soutient la reprise en cours.
Le niveau clé à surveiller est 0,073. Une cassure nette et une clôture quotidienne au-dessus de cette zone pourraient ouvrir la voie vers 0,0835 et potentiellement plus haut.
Si 0,0685 échoue, l’élan pourrait faiblir et nous pourrions voir un nouvel essai de la zone de support inférieur vers 0,0635.
Pour l’instant, $DUSK semble essayer de faire basculer à nouveau la tendance en faveur des haussiers. 👀📈
$DUSK montre une certaine force intéressante sur le graphique journalier 👀
Le prix se situe autour de 0,07217 et a regagné au-dessus de la moyenne mobile sur 7 jours à 0,06856 ainsi que de la moyenne mobile sur 30 jours à 0,06348.
Le RSI est proche de 60, ce qui indique que l’élan haussier se construit, mais il n’est pas encore en zone de surachat.
Le MACD est également en train de repasser dans le positif, avec un histogramme qui s’élargit, ce qui soutient la reprise en cours.
Le niveau clé à surveiller est 0,073. Une cassure nette et une clôture quotidienne au-dessus de cette zone pourraient ouvrir la voie vers 0,0835 et potentiellement plus haut.
Si 0,0685 échoue, l’élan pourrait faiblir et nous pourrions voir un nouvel essai de la zone de support inférieur vers 0,0635.
Pour l’instant, $DUSK semble essayer de faire basculer à nouveau la tendance en faveur des haussiers. 👀📈
Le prix se situe autour de 0,07217 et a regagné au-dessus de la moyenne mobile sur 7 jours à 0,06856 ainsi que de la moyenne mobile sur 30 jours à 0,06348.
Le RSI est proche de 60, ce qui indique que l’élan haussier se construit, mais il n’est pas encore en zone de surachat.
Le MACD est également en train de repasser dans le positif, avec un histogramme qui s’élargit, ce qui soutient la reprise en cours.
Le niveau clé à surveiller est 0,073. Une cassure nette et une clôture quotidienne au-dessus de cette zone pourraient ouvrir la voie vers 0,0835 et potentiellement plus haut.
Si 0,0685 échoue, l’élan pourrait faiblir et nous pourrions voir un nouvel essai de la zone de support inférieur vers 0,0635.
Pour l’instant, $DUSK semble essayer de faire basculer à nouveau la tendance en faveur des haussiers. 👀📈
71
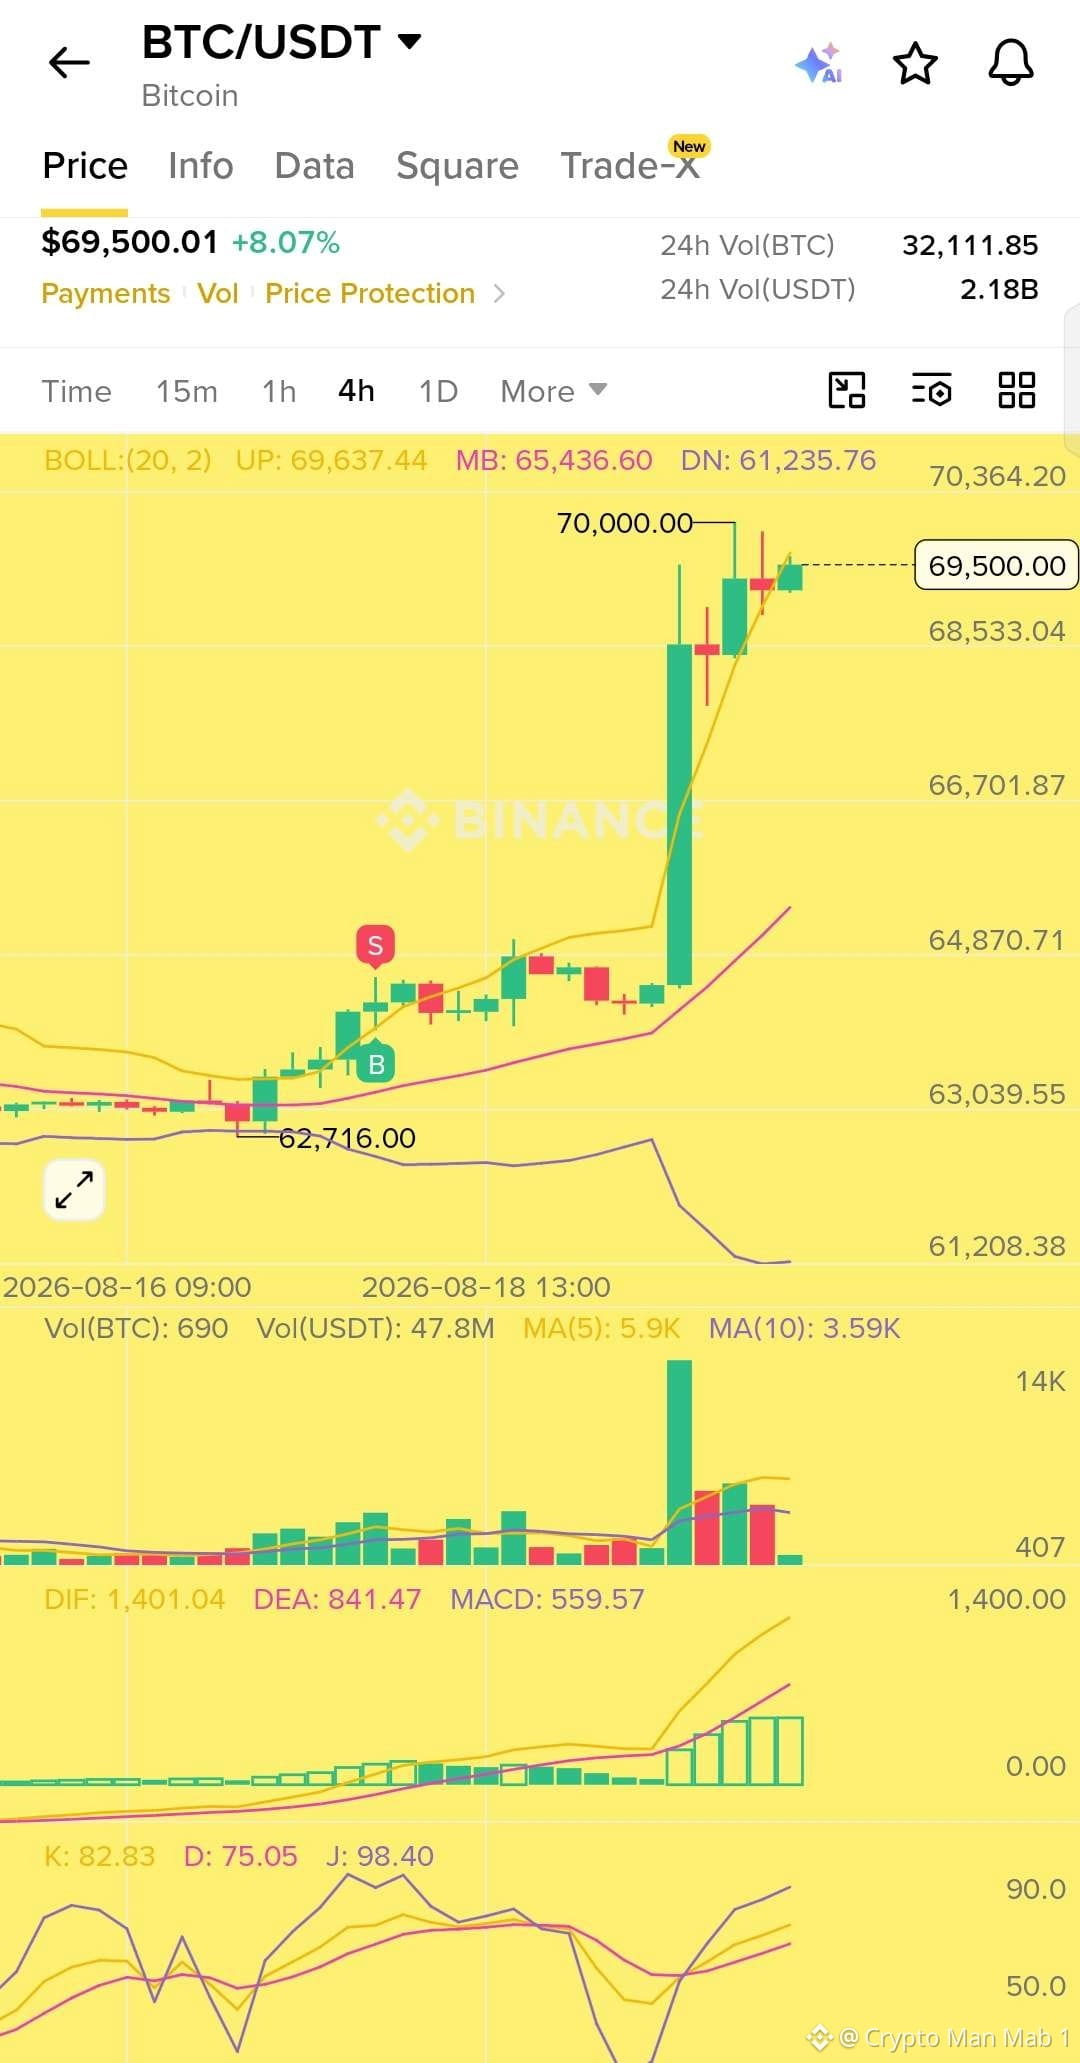
$BTC se rapproche très fortement de la zone des 70K et le graphique en 4H reste nettement haussier.
La cassure depuis la zone des 64K s’est accompagnée d’un fort pic de volume et BTC est désormais en train de se maintenir au-dessus de 68,5K. La MACD montre également un élan haussier solide.
La seule chose que je surveille ici, c’est la situation de surachat. Poursuivre BTC juste sous les 70K peut être risqué si un repli rapide se produit.
Si BTC obtient une clôture 4H nette au-dessus de 70K, alors les 70,3K et les niveaux supérieurs pourraient entrer en jeu.
Pour l’instant, le niveau clé est simple
Au-dessus de 70K = poursuite haussière
Sous 68,5K = repli possible vers 66,7K
Les haussiers de BTC restent aux commandes, mais c’est ici que la patience compte. 📈
$BTC se rapproche très fortement de la zone des 70K et le graphique en 4H reste nettement haussier.
La cassure depuis la zone des 64K s’est accompagnée d’un fort pic de volume et BTC est désormais en train de se maintenir au-dessus de 68,5K. La MACD montre également un élan haussier solide.
La seule chose que je surveille ici, c’est la situation de surachat. Poursuivre BTC juste sous les 70K peut être risqué si un repli rapide se produit.
Si BTC obtient une clôture 4H nette au-dessus de 70K, alors les 70,3K et les niveaux supérieurs pourraient entrer en jeu.
Pour l’instant, le niveau clé est simple
Au-dessus de 70K = poursuite haussière
Sous 68,5K = repli possible vers 66,7K
Les haussiers de BTC restent aux commandes, mais c’est ici que la patience compte. 📈
La cassure depuis la zone des 64K s’est accompagnée d’un fort pic de volume et BTC est désormais en train de se maintenir au-dessus de 68,5K. La MACD montre également un élan haussier solide.
La seule chose que je surveille ici, c’est la situation de surachat. Poursuivre BTC juste sous les 70K peut être risqué si un repli rapide se produit.
Si BTC obtient une clôture 4H nette au-dessus de 70K, alors les 70,3K et les niveaux supérieurs pourraient entrer en jeu.
Pour l’instant, le niveau clé est simple
Au-dessus de 70K = poursuite haussière
Sous 68,5K = repli possible vers 66,7K
Les haussiers de BTC restent aux commandes, mais c’est ici que la patience compte. 📈
76
Connectez-vous pour découvrir plus de contenu
Rejoignez la communauté mondiale des adeptes de cryptomonnaies sur Binance Square
⚡️ Suviez les dernières informations importantes sur les cryptomonnaies.
💬 Jugé digne de confiance par la plus grande plateforme d’échange de cryptomonnaies au monde.
👍 Découvrez les connaissances que partagent les créateurs vérifiés.
Adresse e-mail/Nº de téléphone