
KCM 1
139 Publications

KCM 1
Signaler
Bloquer l’utilisateur
0 Suivis
6 Abonnés
18 J’aime
Publications
·
--
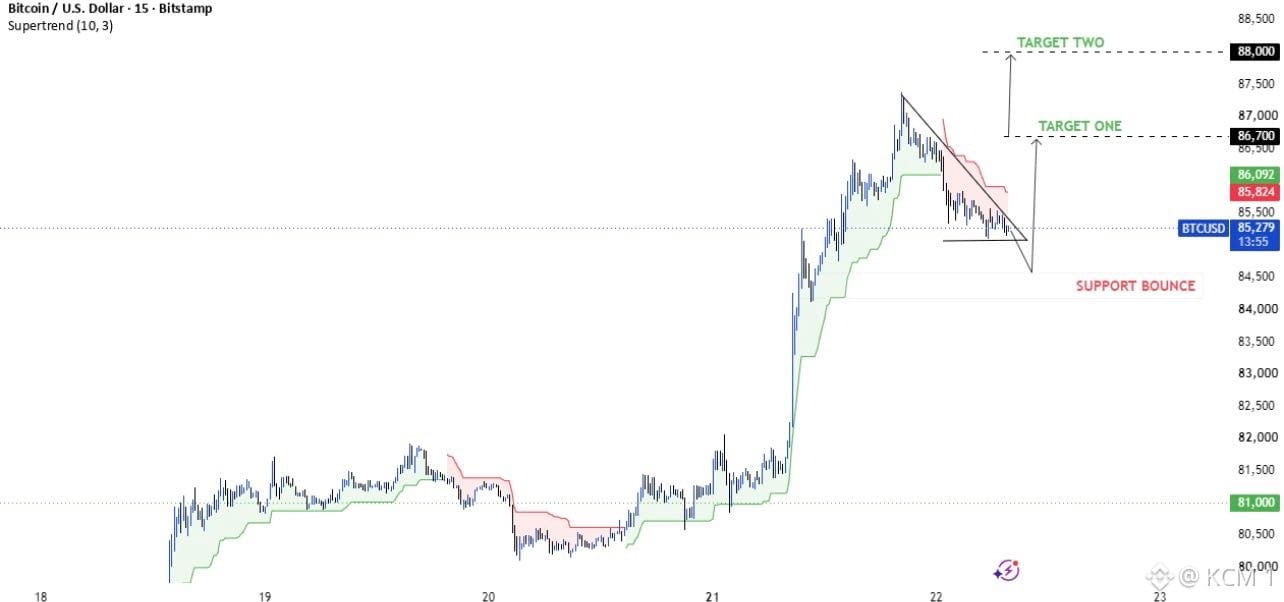
Alors que les vendeurs en cassure vendent à découvert le repli, cette consolidation en figure en coin descendant sur le $BTC se resserre directement au-dessus d’un support intraday clé, annonçant une poursuite haussière.
Après une forte impulsion haussière, le prix est revenu à l’intérieur d’un modèle de coin descendant étroit ; il teste actuellement le support proche de $85,279[span_0](start_span)[span_0](end_span). L’indicateur Supertrend et la zone locale de support horizontal signalent que les acheteurs défendent la borne inférieure, préparant une possible expansion à partir de la structure en drapeau[span_1](start_span)[span_1](end_span).
Une cassure nette au-dessus de la ligne de résistance du coin descendant confirme le mouvement à la hausse, ouvrant l’objectif 1 à $86,700 et l’objectif 2 à $88,000[span_2](start_span)[span_2](end_span). Le maintien au-dessus du support local proche de $84,500 préserve la thèse haussière, tandis qu’une cassure en dessous invalide le scénario[span_3](start_span)[span_3](end_span).
Ne vendez pas à découvert sur le support du coin descendant : attendez l’expansion du prix pour confirmer la prochaine étape à la hausse.
#BTC #Bitcoin #CryptoAnalysis #TechnicalAnalysis #Trading
Alors que les vendeurs en cassure vendent à découvert le repli, cette consolidation en figure en coin descendant sur le $BTC se resserre directement au-dessus d’un support intraday clé, annonçant une poursuite haussière.
Après une forte impulsion haussière, le prix est revenu à l’intérieur d’un modèle de coin descendant étroit ; il teste actuellement le support proche de $85,279[span_0](start_span)[span_0](end_span). L’indicateur Supertrend et la zone locale de support horizontal signalent que les acheteurs défendent la borne inférieure, préparant une possible expansion à partir de la structure en drapeau[span_1](start_span)[span_1](end_span).
Une cassure nette au-dessus de la ligne de résistance du coin descendant confirme le mouvement à la hausse, ouvrant l’objectif 1 à $86,700 et l’objectif 2 à $88,000[span_2](start_span)[span_2](end_span). Le maintien au-dessus du support local proche de $84,500 préserve la thèse haussière, tandis qu’une cassure en dessous invalide le scénario[span_3](start_span)[span_3](end_span).
Ne vendez pas à découvert sur le support du coin descendant : attendez l’expansion du prix pour confirmer la prochaine étape à la hausse.
#BTC #Bitcoin #CryptoAnalysis #TechnicalAnalysis #Trading
Après une forte impulsion haussière, le prix est revenu à l’intérieur d’un modèle de coin descendant étroit ; il teste actuellement le support proche de $85,279[span_0](start_span)[span_0](end_span). L’indicateur Supertrend et la zone locale de support horizontal signalent que les acheteurs défendent la borne inférieure, préparant une possible expansion à partir de la structure en drapeau[span_1](start_span)[span_1](end_span).
Une cassure nette au-dessus de la ligne de résistance du coin descendant confirme le mouvement à la hausse, ouvrant l’objectif 1 à $86,700 et l’objectif 2 à $88,000[span_2](start_span)[span_2](end_span). Le maintien au-dessus du support local proche de $84,500 préserve la thèse haussière, tandis qu’une cassure en dessous invalide le scénario[span_3](start_span)[span_3](end_span).
Ne vendez pas à découvert sur le support du coin descendant : attendez l’expansion du prix pour confirmer la prochaine étape à la hausse.
#BTC #Bitcoin #CryptoAnalysis #TechnicalAnalysis #Trading
49
·
--
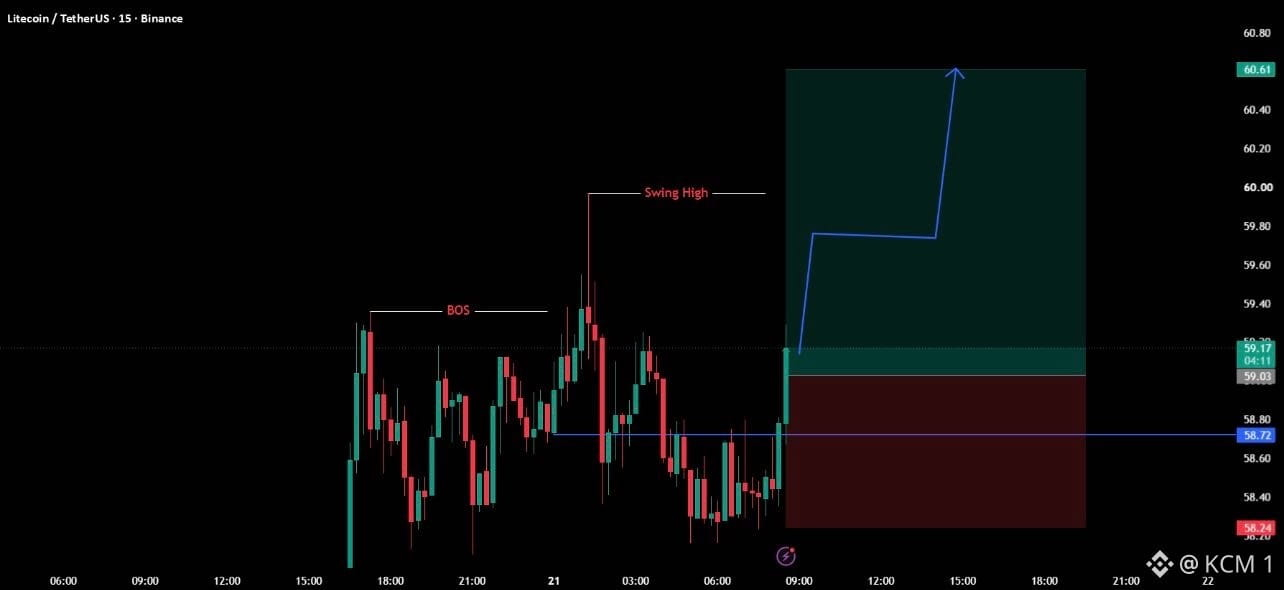
Alors que beaucoup attendent une confirmation sur timeframe supérieure, cette cassure de structure intraday sur $LTC déclenche un setup de continuation long à haut RR.
Après avoir établi une claire Break of Structure (BOS) et avoir formé un swing high clé, le prix a balayé la liquidité sur la timeframe inférieure avant que des acheteurs agressifs n’interviennent près de $58.72. La forte bougie engloutissante haussière issue du plus bas interne confirme l’absorption de la demande, réorientant l’élan local vers le haut.
En restant au-dessus du niveau d’invalidation de la position à $58.24, le momentum haussier est préservé, avec pour cibles un balayage du précédent swing high puis une expansion complète vers $60.61. Un échec à défendre le support et une chute sous $58.24 invalident le setup, signalant un repli plus profond vers des zones de demande plus basses.
N’attendez pas que le prix s’envole : alignez vos entrées avec les changements de structure sur la timeframe inférieure issus de zones de demande clés.
#LTC #Litecoin #CryptoAnalysis #TechnicalAnalysis #Trading
Alors que beaucoup attendent une confirmation sur timeframe supérieure, cette cassure de structure intraday sur $LTC déclenche un setup de continuation long à haut RR.
Après avoir établi une claire Break of Structure (BOS) et avoir formé un swing high clé, le prix a balayé la liquidité sur la timeframe inférieure avant que des acheteurs agressifs n’interviennent près de $58.72. La forte bougie engloutissante haussière issue du plus bas interne confirme l’absorption de la demande, réorientant l’élan local vers le haut.
En restant au-dessus du niveau d’invalidation de la position à $58.24, le momentum haussier est préservé, avec pour cibles un balayage du précédent swing high puis une expansion complète vers $60.61. Un échec à défendre le support et une chute sous $58.24 invalident le setup, signalant un repli plus profond vers des zones de demande plus basses.
N’attendez pas que le prix s’envole : alignez vos entrées avec les changements de structure sur la timeframe inférieure issus de zones de demande clés.
#LTC #Litecoin #CryptoAnalysis #TechnicalAnalysis #Trading
Après avoir établi une claire Break of Structure (BOS) et avoir formé un swing high clé, le prix a balayé la liquidité sur la timeframe inférieure avant que des acheteurs agressifs n’interviennent près de $58.72. La forte bougie engloutissante haussière issue du plus bas interne confirme l’absorption de la demande, réorientant l’élan local vers le haut.
En restant au-dessus du niveau d’invalidation de la position à $58.24, le momentum haussier est préservé, avec pour cibles un balayage du précédent swing high puis une expansion complète vers $60.61. Un échec à défendre le support et une chute sous $58.24 invalident le setup, signalant un repli plus profond vers des zones de demande plus basses.
N’attendez pas que le prix s’envole : alignez vos entrées avec les changements de structure sur la timeframe inférieure issus de zones de demande clés.
#LTC #Litecoin #CryptoAnalysis #TechnicalAnalysis #Trading
574
·
--
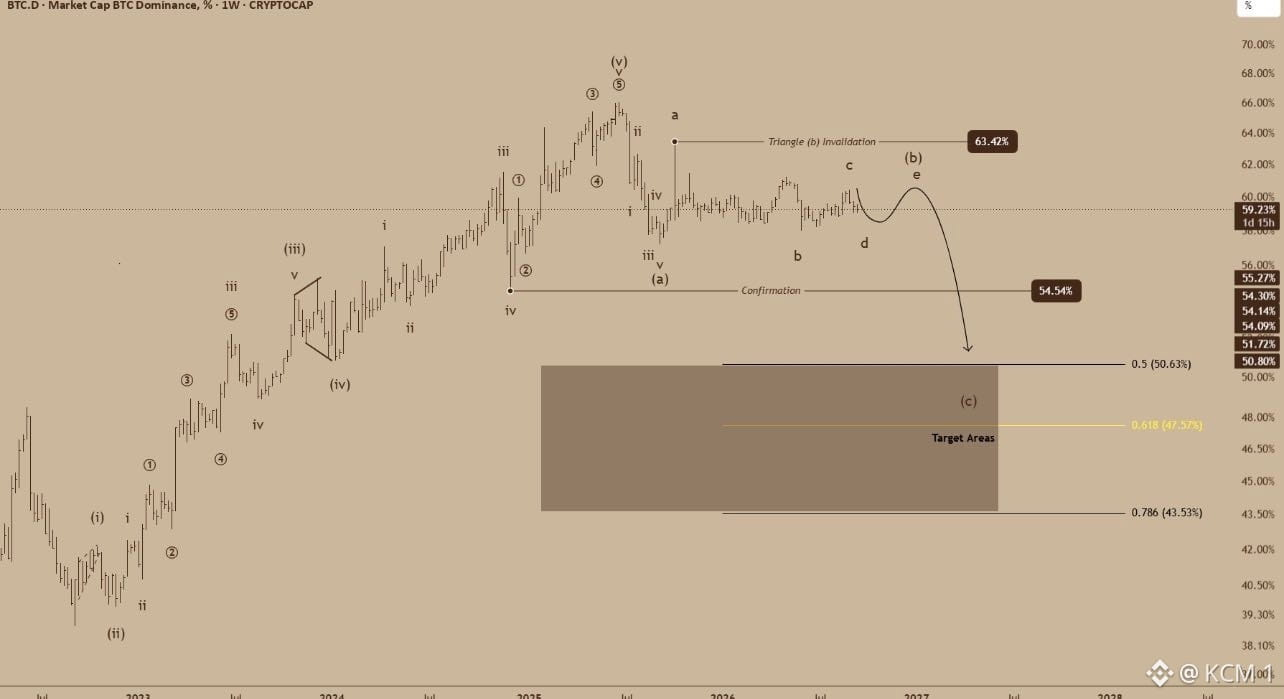
Pendant que les maximalistes de Bitcoin se positionnent pour une domination plus forte, ce triangle de la théorie des Vagues d’Elliott sur $BTC .D signale une rupture macro susceptible d’ouvrir la voie à une expansion prolongée des altcoins.
Après l’achèvement d’une structure motrice principale en 5 vagues, la domination du marché se consolide désormais à l’intérieur d’une figure triangulaire corrective (b), autour de 59,23 % . La projection des Vagues d’Elliott anticipe un achèvement final d’une sous-vague au sein du triangle avant une résolution en une impulsion baissière agressive (c).
Le maintien sous le niveau d’invalidation du triangle à 63,42 % préserve le cadre de consolidation corrective. Une rupture et une clôture hebdomadaire en dessous du support de confirmation à 54,54 % déclenchent la baisse de la vague (c), visant des zones de support Fibonacci plus basses à 50,63 % (0,5 Fib), 47,57 % (0,618 Fib) et 43,53 % (0,786 Fib).
Ne négligez pas les changements de la domination du marché : surveillez la rupture de $BTC .D pour confirmer quand la liquidité s’oriente agressivement vers les altcoins.
#BTC #BTC dominance #Altseason #CryptoAnalysis #TechnicalAnalysis
Pendant que les maximalistes de Bitcoin se positionnent pour une domination plus forte, ce triangle de la théorie des Vagues d’Elliott sur $BTC .D signale une rupture macro susceptible d’ouvrir la voie à une expansion prolongée des altcoins.
Après l’achèvement d’une structure motrice principale en 5 vagues, la domination du marché se consolide désormais à l’intérieur d’une figure triangulaire corrective (b), autour de 59,23 % . La projection des Vagues d’Elliott anticipe un achèvement final d’une sous-vague au sein du triangle avant une résolution en une impulsion baissière agressive (c).
Le maintien sous le niveau d’invalidation du triangle à 63,42 % préserve le cadre de consolidation corrective. Une rupture et une clôture hebdomadaire en dessous du support de confirmation à 54,54 % déclenchent la baisse de la vague (c), visant des zones de support Fibonacci plus basses à 50,63 % (0,5 Fib), 47,57 % (0,618 Fib) et 43,53 % (0,786 Fib).
Ne négligez pas les changements de la domination du marché : surveillez la rupture de $BTC .D pour confirmer quand la liquidité s’oriente agressivement vers les altcoins.
#BTC #BTC dominance #Altseason #CryptoAnalysis #TechnicalAnalysis
Après l’achèvement d’une structure motrice principale en 5 vagues, la domination du marché se consolide désormais à l’intérieur d’une figure triangulaire corrective (b), autour de 59,23 % . La projection des Vagues d’Elliott anticipe un achèvement final d’une sous-vague au sein du triangle avant une résolution en une impulsion baissière agressive (c).
Le maintien sous le niveau d’invalidation du triangle à 63,42 % préserve le cadre de consolidation corrective. Une rupture et une clôture hebdomadaire en dessous du support de confirmation à 54,54 % déclenchent la baisse de la vague (c), visant des zones de support Fibonacci plus basses à 50,63 % (0,5 Fib), 47,57 % (0,618 Fib) et 43,53 % (0,786 Fib).
Ne négligez pas les changements de la domination du marché : surveillez la rupture de $BTC .D pour confirmer quand la liquidité s’oriente agressivement vers les altcoins.
#BTC #BTC dominance #Altseason #CryptoAnalysis #TechnicalAnalysis
41
·
--
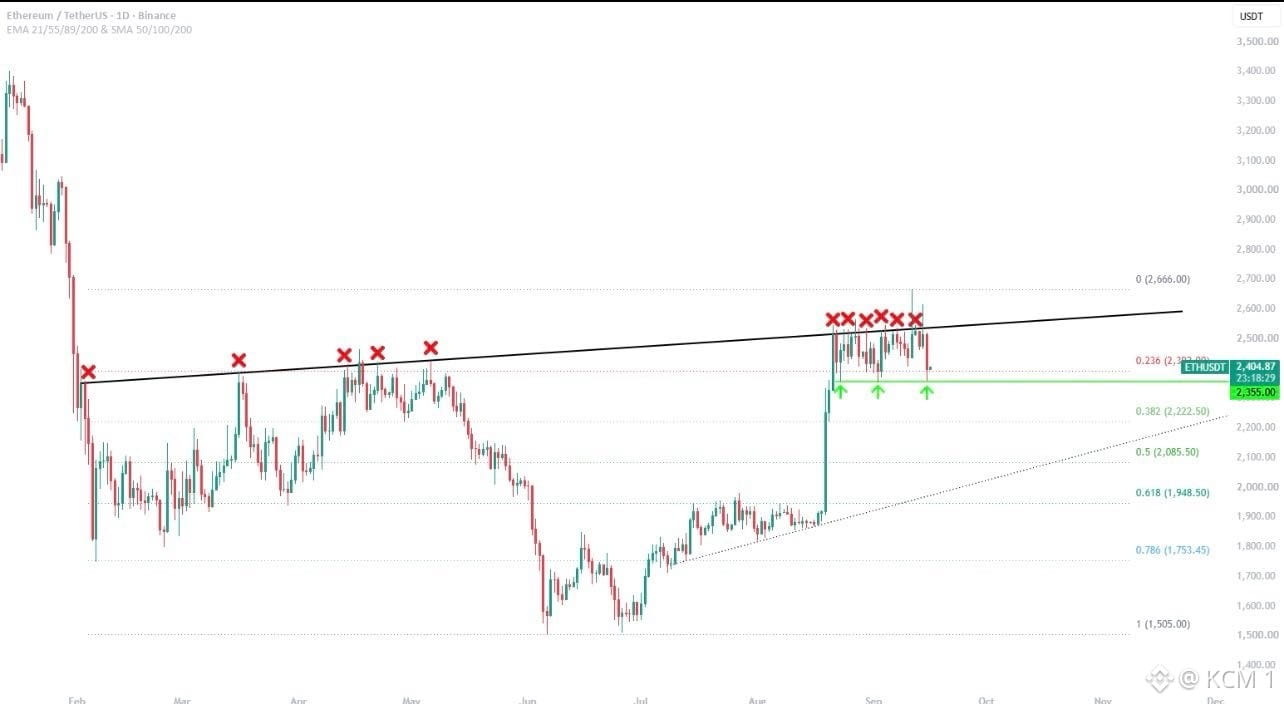
Alors que beaucoup se concentrent sur les rejets répétés en haut, cette zone de consolidation sur le $ETH maintient un niveau de support horizontal crucial.
Après avoir échoué à plusieurs reprises à franchir la ligne de résistance ascendante marquée par des X de rejet rouges, le prix s’est replié vers la ligne de demande horizontale à $2 355,00. Les rebonds répétés des flèches vertes sur ce niveau indiquent un fort intérêt acheteur, absorbant la pression de vente au-dessus à l’intérieur de la zone de consolidation.
Un maintien solide au-dessus de $2 355,00 conserve la structure d’accumulation haussière active, préparant une nouvelle tentative pour franchir la résistance dynamique proche de $2 600,00. Toutefois, une clôture quotidienne en dessous de $2 355,00 invalide la configuration de la zone, ouvrant un potentiel de baisse vers des niveaux Fibonacci plus bas à $2 222,50 et $2 085,50.
Ne paniquez pas face aux rejets répétés — observez comment le prix défend les niveaux clés de support horizontal avant le prochain grand mouvement.
#ETH #Ethereum #CryptoAnalysis #TechnicalAnalysis
Alors que beaucoup se concentrent sur les rejets répétés en haut, cette zone de consolidation sur le $ETH maintient un niveau de support horizontal crucial.
Après avoir échoué à plusieurs reprises à franchir la ligne de résistance ascendante marquée par des X de rejet rouges, le prix s’est replié vers la ligne de demande horizontale à $2 355,00. Les rebonds répétés des flèches vertes sur ce niveau indiquent un fort intérêt acheteur, absorbant la pression de vente au-dessus à l’intérieur de la zone de consolidation.
Un maintien solide au-dessus de $2 355,00 conserve la structure d’accumulation haussière active, préparant une nouvelle tentative pour franchir la résistance dynamique proche de $2 600,00. Toutefois, une clôture quotidienne en dessous de $2 355,00 invalide la configuration de la zone, ouvrant un potentiel de baisse vers des niveaux Fibonacci plus bas à $2 222,50 et $2 085,50.
Ne paniquez pas face aux rejets répétés — observez comment le prix défend les niveaux clés de support horizontal avant le prochain grand mouvement.
#ETH #Ethereum #CryptoAnalysis #TechnicalAnalysis
Après avoir échoué à plusieurs reprises à franchir la ligne de résistance ascendante marquée par des X de rejet rouges, le prix s’est replié vers la ligne de demande horizontale à $2 355,00. Les rebonds répétés des flèches vertes sur ce niveau indiquent un fort intérêt acheteur, absorbant la pression de vente au-dessus à l’intérieur de la zone de consolidation.
Un maintien solide au-dessus de $2 355,00 conserve la structure d’accumulation haussière active, préparant une nouvelle tentative pour franchir la résistance dynamique proche de $2 600,00. Toutefois, une clôture quotidienne en dessous de $2 355,00 invalide la configuration de la zone, ouvrant un potentiel de baisse vers des niveaux Fibonacci plus bas à $2 222,50 et $2 085,50.
Ne paniquez pas face aux rejets répétés — observez comment le prix défend les niveaux clés de support horizontal avant le prochain grand mouvement.
#ETH #Ethereum #CryptoAnalysis #TechnicalAnalysis
55
·
--
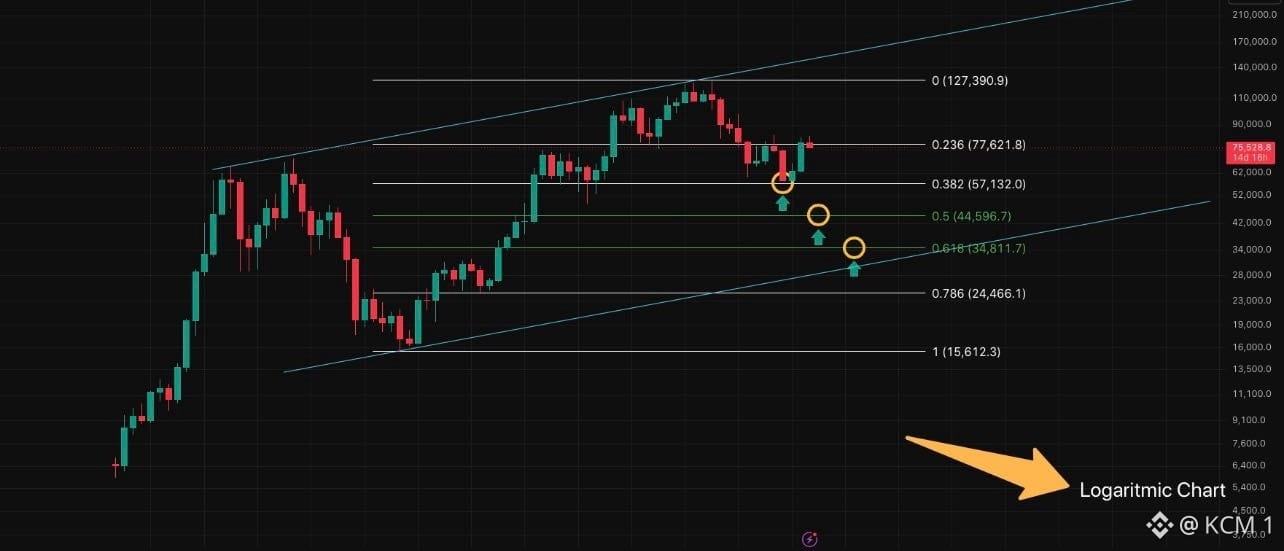
Pendant que les taureaux célèbrent les rebonds locaux, cette configuration de canal logarithmique sur $BTC signale une correction macro visant des niveaux clés de retracement de Fibonacci.
Après avoir culminé près de la borne supérieure du canal à $127,390.9 , le prix est retombé en cassant un support intermédiaire et teste désormais le niveau de Fib 0.236 autour de $77,621.8 . L’échec à maintenir la structure du haut confirme qu’un cycle correctif macro se déroule à l’intérieur du canal pluriannuel.
Le rejet sous $77,621.8 ouvre des cibles de baisse successives : le Fib 0.382 à $57,132.0 , puis le Fib 0.5 à $44,596.7 et le Fib 0.618 à $34,811.7 . Pour invalider la thèse de la correction macro et reconstruire une dynamique haussière, il faut reprendre et tenir au-dessus de $77,621.8 .
N’ignorez pas les bornes du canal logarithmique : les niveaux de Fibonacci macro guident les corrections profondes du marché.
#BTC #Bitcoin #CryptoAnalysis #TechnicalAnalysis
Pendant que les taureaux célèbrent les rebonds locaux, cette configuration de canal logarithmique sur $BTC signale une correction macro visant des niveaux clés de retracement de Fibonacci.
Après avoir culminé près de la borne supérieure du canal à $127,390.9 , le prix est retombé en cassant un support intermédiaire et teste désormais le niveau de Fib 0.236 autour de $77,621.8 . L’échec à maintenir la structure du haut confirme qu’un cycle correctif macro se déroule à l’intérieur du canal pluriannuel.
Le rejet sous $77,621.8 ouvre des cibles de baisse successives : le Fib 0.382 à $57,132.0 , puis le Fib 0.5 à $44,596.7 et le Fib 0.618 à $34,811.7 . Pour invalider la thèse de la correction macro et reconstruire une dynamique haussière, il faut reprendre et tenir au-dessus de $77,621.8 .
N’ignorez pas les bornes du canal logarithmique : les niveaux de Fibonacci macro guident les corrections profondes du marché.
#BTC #Bitcoin #CryptoAnalysis #TechnicalAnalysis
Après avoir culminé près de la borne supérieure du canal à $127,390.9 , le prix est retombé en cassant un support intermédiaire et teste désormais le niveau de Fib 0.236 autour de $77,621.8 . L’échec à maintenir la structure du haut confirme qu’un cycle correctif macro se déroule à l’intérieur du canal pluriannuel.
Le rejet sous $77,621.8 ouvre des cibles de baisse successives : le Fib 0.382 à $57,132.0 , puis le Fib 0.5 à $44,596.7 et le Fib 0.618 à $34,811.7 . Pour invalider la thèse de la correction macro et reconstruire une dynamique haussière, il faut reprendre et tenir au-dessus de $77,621.8 .
N’ignorez pas les bornes du canal logarithmique : les niveaux de Fibonacci macro guident les corrections profondes du marché.
#BTC #Bitcoin #CryptoAnalysis #TechnicalAnalysis
71
·
--
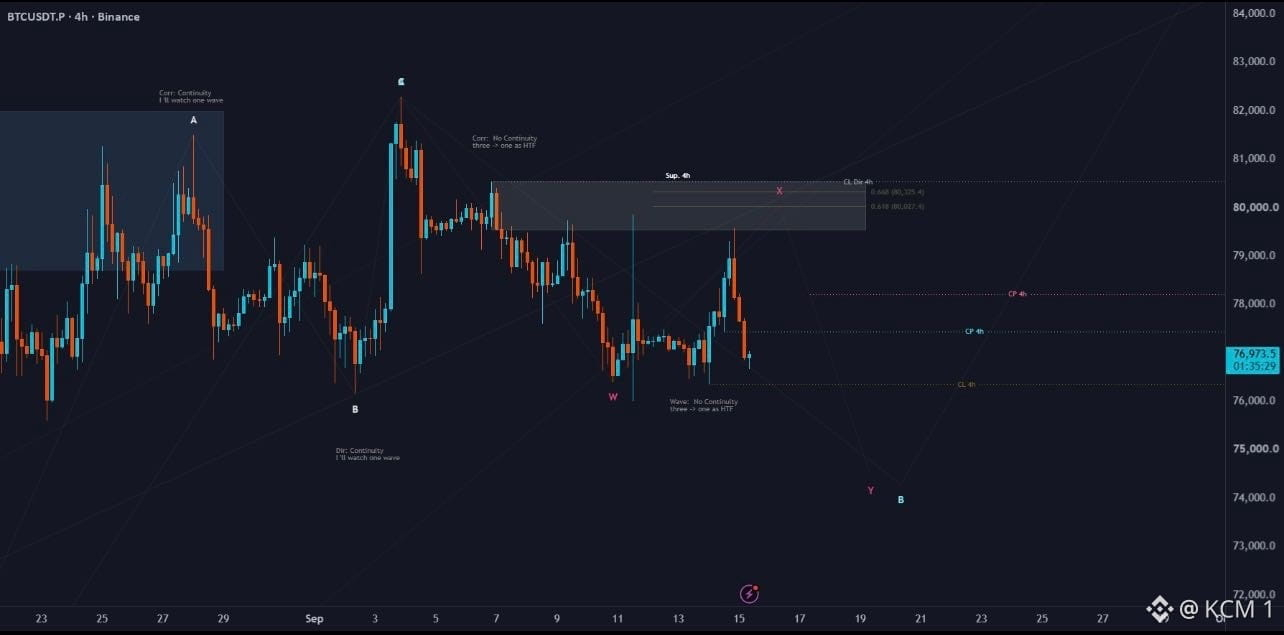
Pendant que le consensus surveille un rebond local, cette structure de correction sur $BTC indique une traction structurelle plus profonde à la baisse afin de finaliser le schéma correctif.
Après avoir été rejeté depuis la zone d’offre en 4 heures près de 80 000 $, le prix a rompu le support sur le plus court terme, évoluant à la baisse autour de 76 973 $. La structure du prix marque une séquence de correction en vagues (W-X-Y) : le retest manqué au niveau de l’offre au-dessus confirme le contrôle des baissiers pour la prochaine jambe à la baisse.
En restant sous le plafond d’offre en 4 heures près de 80 000 $, la thèse corrective demeure valable, avec pour objectif une finalisation de vague plus basse autour de 74 000 $. Un rebond solide et une clôture journalière au-dessus de 80 200 $ invalident la configuration de vague corrective, rouvrant ainsi le momentum haussier.
Ne t’achète pas sur des vagues correctives incomplètes — attends que la demande structurelle confirme le point de pivot final.
#BTC #Bitcoin #CryptoAnalysis #TechnicalAnalysis
Pendant que le consensus surveille un rebond local, cette structure de correction sur $BTC indique une traction structurelle plus profonde à la baisse afin de finaliser le schéma correctif.
Après avoir été rejeté depuis la zone d’offre en 4 heures près de 80 000 $, le prix a rompu le support sur le plus court terme, évoluant à la baisse autour de 76 973 $. La structure du prix marque une séquence de correction en vagues (W-X-Y) : le retest manqué au niveau de l’offre au-dessus confirme le contrôle des baissiers pour la prochaine jambe à la baisse.
En restant sous le plafond d’offre en 4 heures près de 80 000 $, la thèse corrective demeure valable, avec pour objectif une finalisation de vague plus basse autour de 74 000 $. Un rebond solide et une clôture journalière au-dessus de 80 200 $ invalident la configuration de vague corrective, rouvrant ainsi le momentum haussier.
Ne t’achète pas sur des vagues correctives incomplètes — attends que la demande structurelle confirme le point de pivot final.
#BTC #Bitcoin #CryptoAnalysis #TechnicalAnalysis
Après avoir été rejeté depuis la zone d’offre en 4 heures près de 80 000 $, le prix a rompu le support sur le plus court terme, évoluant à la baisse autour de 76 973 $. La structure du prix marque une séquence de correction en vagues (W-X-Y) : le retest manqué au niveau de l’offre au-dessus confirme le contrôle des baissiers pour la prochaine jambe à la baisse.
En restant sous le plafond d’offre en 4 heures près de 80 000 $, la thèse corrective demeure valable, avec pour objectif une finalisation de vague plus basse autour de 74 000 $. Un rebond solide et une clôture journalière au-dessus de 80 200 $ invalident la configuration de vague corrective, rouvrant ainsi le momentum haussier.
Ne t’achète pas sur des vagues correctives incomplètes — attends que la demande structurelle confirme le point de pivot final.
#BTC #Bitcoin #CryptoAnalysis #TechnicalAnalysis
69
·
--
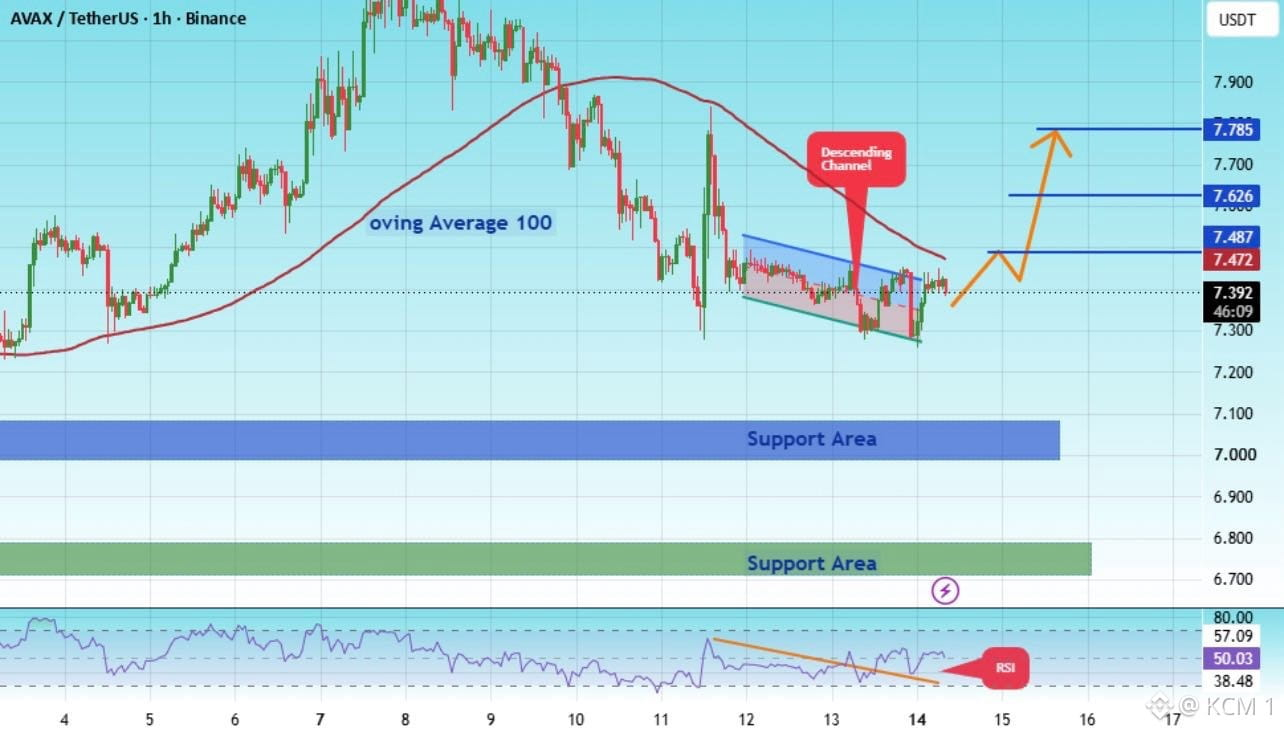
Tout le monde observe cette consolidation serrée sur $AVAX , mais passe à côté d’un dépassement de RSI qui prépare une inversion majeure de canal.
Après un repli sous la moyenne mobile sur 100 périodes sur le graphique en 1 heure, le prix s’est contracté à l’intérieur d’un canal descendant étroit au-dessus de $7.300 . Dans le même temps, le RSI a cassé sa ligne de tendance baissière, signalant une arrivée d’élan haussier avant que le prix ne passe à l’action.
Une cassure nette au-dessus de $7.472 confirme l’inversion du schéma, ouvrant la voie à des objectifs haussiers successifs à $7.626 et $7.785 . Le maintien au-dessus des zones de support clés autour de $7.050 et $6.750 garde le scénario de poursuite haussière pleinement intact.
N’attendez pas l’expansion du prix : les indicateurs de momentum précèdent la cassure avant que le prix ne la confirme.
#AVAX #Avalanche #CryptoAnalysis #TechnicalAnalysis
Tout le monde observe cette consolidation serrée sur $AVAX , mais passe à côté d’un dépassement de RSI qui prépare une inversion majeure de canal.
Après un repli sous la moyenne mobile sur 100 périodes sur le graphique en 1 heure, le prix s’est contracté à l’intérieur d’un canal descendant étroit au-dessus de $7.300 . Dans le même temps, le RSI a cassé sa ligne de tendance baissière, signalant une arrivée d’élan haussier avant que le prix ne passe à l’action.
Une cassure nette au-dessus de $7.472 confirme l’inversion du schéma, ouvrant la voie à des objectifs haussiers successifs à $7.626 et $7.785 . Le maintien au-dessus des zones de support clés autour de $7.050 et $6.750 garde le scénario de poursuite haussière pleinement intact.
N’attendez pas l’expansion du prix : les indicateurs de momentum précèdent la cassure avant que le prix ne la confirme.
#AVAX #Avalanche #CryptoAnalysis #TechnicalAnalysis
Après un repli sous la moyenne mobile sur 100 périodes sur le graphique en 1 heure, le prix s’est contracté à l’intérieur d’un canal descendant étroit au-dessus de $7.300 . Dans le même temps, le RSI a cassé sa ligne de tendance baissière, signalant une arrivée d’élan haussier avant que le prix ne passe à l’action.
Une cassure nette au-dessus de $7.472 confirme l’inversion du schéma, ouvrant la voie à des objectifs haussiers successifs à $7.626 et $7.785 . Le maintien au-dessus des zones de support clés autour de $7.050 et $6.750 garde le scénario de poursuite haussière pleinement intact.
N’attendez pas l’expansion du prix : les indicateurs de momentum précèdent la cassure avant que le prix ne la confirme.
#AVAX #Avalanche #CryptoAnalysis #TechnicalAnalysis
70
·
--
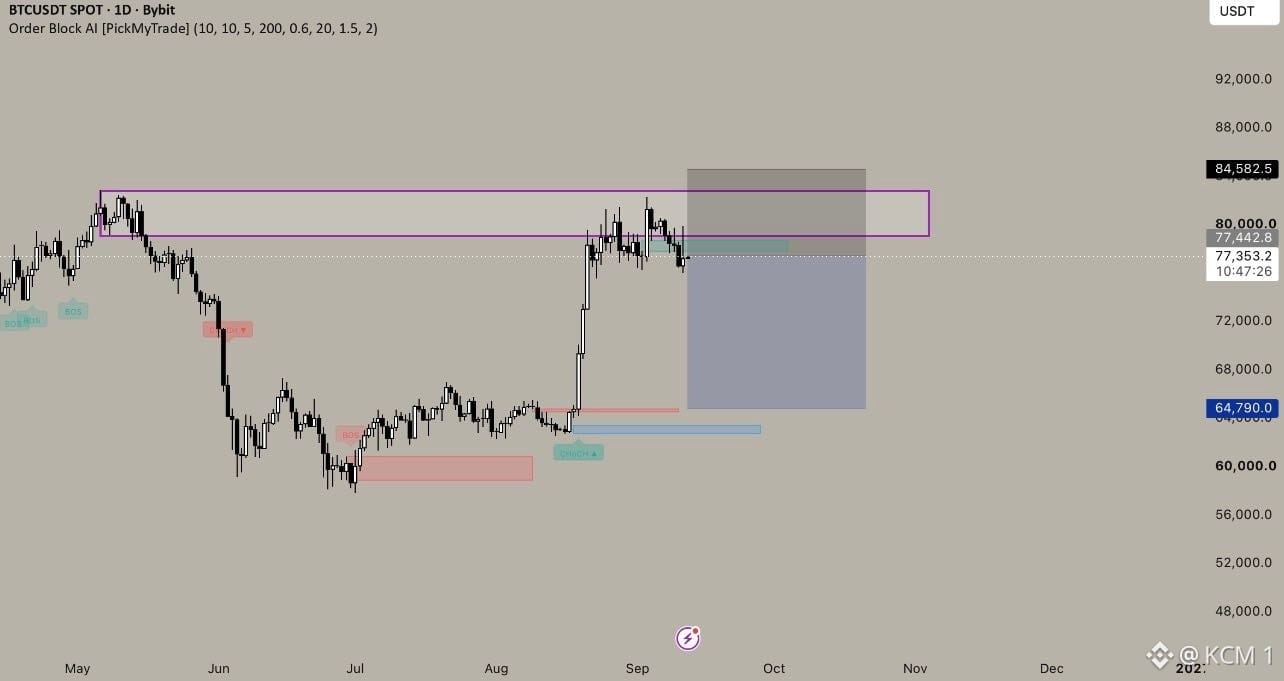
Alors que les acheteurs en quête de cassure poursuivent des niveaux plus élevés, cette configuration de short sur $BTC se positionne pour un balayage propre de la liquidité à la baisse.
Après avoir retesté le bloc d’ordres daily principal près de $80,000, le prix a fortement rejeté la zone d’offre autour de $84,582. La réaction actuelle montre une distribution à la résistance, ce qui maintient la thèse baissière valide pour un repli vers le bloc de demande majeur.
En restant sous le niveau d’invalidation à $84,582, le trade short reste actif, avec comme objectif un balayage complet de liquidité vers le bas jusqu’à $64,790. Une cassure suivie d’une clôture journalière au-dessus de $84,582 invalide la configuration et rouvre une expansion haussière à plus long terme.
Ne vous laissez pas tenter par les blocs d’ordres au-dessus du prix : faites confirmer le rejet par la résistance avant de trader le repli.
#BTC #Bitcoin #CryptoAnalysis #TechnicalAnalysis
Alors que les acheteurs en quête de cassure poursuivent des niveaux plus élevés, cette configuration de short sur $BTC se positionne pour un balayage propre de la liquidité à la baisse.
Après avoir retesté le bloc d’ordres daily principal près de $80,000, le prix a fortement rejeté la zone d’offre autour de $84,582. La réaction actuelle montre une distribution à la résistance, ce qui maintient la thèse baissière valide pour un repli vers le bloc de demande majeur.
En restant sous le niveau d’invalidation à $84,582, le trade short reste actif, avec comme objectif un balayage complet de liquidité vers le bas jusqu’à $64,790. Une cassure suivie d’une clôture journalière au-dessus de $84,582 invalide la configuration et rouvre une expansion haussière à plus long terme.
Ne vous laissez pas tenter par les blocs d’ordres au-dessus du prix : faites confirmer le rejet par la résistance avant de trader le repli.
#BTC #Bitcoin #CryptoAnalysis #TechnicalAnalysis
Après avoir retesté le bloc d’ordres daily principal près de $80,000, le prix a fortement rejeté la zone d’offre autour de $84,582. La réaction actuelle montre une distribution à la résistance, ce qui maintient la thèse baissière valide pour un repli vers le bloc de demande majeur.
En restant sous le niveau d’invalidation à $84,582, le trade short reste actif, avec comme objectif un balayage complet de liquidité vers le bas jusqu’à $64,790. Une cassure suivie d’une clôture journalière au-dessus de $84,582 invalide la configuration et rouvre une expansion haussière à plus long terme.
Ne vous laissez pas tenter par les blocs d’ordres au-dessus du prix : faites confirmer le rejet par la résistance avant de trader le repli.
#BTC #Bitcoin #CryptoAnalysis #TechnicalAnalysis
51
·
--
Tout le monde regarde ce rebond net et bien marqué, mais en manquant le test du double sommet et le surcoût de la résistance en approche proche de 79 800 $.
Après s’être détaché de la figure en biseau ascendant et être descendu jusqu’à 77 800 $, le prix a effectué un rapide repli directement vers une résistance clé. Le rejet au niveau de la ligne horizontale en pointillés indique que les vendeurs sont actifs, ouvrant la voie à des objectifs potentiels à la baisse : 77 800 $ et la zone d’objectif secondaire autour de 77 000 $.
Une cassure sous 78 828 $ confirme la poursuite baissière vers les zones cibles inférieures. Cependant, une forte impulsion au-dessus de 79 800 $ invalide le scénario baissier et rouvre un élan haussier vers 80 200 $.
Ne pas acheter la pompe de soulagement trop tôt : attendez que la structure du marché confirme le rejet avant de trader le mouvement.
#BTC #Bitcoin #CryptoAnalysis #TechnicalAnalysis
Tout le monde regarde ce rebond net et bien marqué, mais en manquant le test du double sommet et le surcoût de la résistance en approche proche de 79 800 $.
Après s’être détaché de la figure en biseau ascendant et être descendu jusqu’à 77 800 $, le prix a effectué un rapide repli directement vers une résistance clé. Le rejet au niveau de la ligne horizontale en pointillés indique que les vendeurs sont actifs, ouvrant la voie à des objectifs potentiels à la baisse : 77 800 $ et la zone d’objectif secondaire autour de 77 000 $.
Une cassure sous 78 828 $ confirme la poursuite baissière vers les zones cibles inférieures. Cependant, une forte impulsion au-dessus de 79 800 $ invalide le scénario baissier et rouvre un élan haussier vers 80 200 $.
Ne pas acheter la pompe de soulagement trop tôt : attendez que la structure du marché confirme le rejet avant de trader le mouvement.
#BTC #Bitcoin #CryptoAnalysis #TechnicalAnalysis
Après s’être détaché de la figure en biseau ascendant et être descendu jusqu’à 77 800 $, le prix a effectué un rapide repli directement vers une résistance clé. Le rejet au niveau de la ligne horizontale en pointillés indique que les vendeurs sont actifs, ouvrant la voie à des objectifs potentiels à la baisse : 77 800 $ et la zone d’objectif secondaire autour de 77 000 $.
Une cassure sous 78 828 $ confirme la poursuite baissière vers les zones cibles inférieures. Cependant, une forte impulsion au-dessus de 79 800 $ invalide le scénario baissier et rouvre un élan haussier vers 80 200 $.
Ne pas acheter la pompe de soulagement trop tôt : attendez que la structure du marché confirme le rejet avant de trader le mouvement.
#BTC #Bitcoin #CryptoAnalysis #TechnicalAnalysis

63
·
--
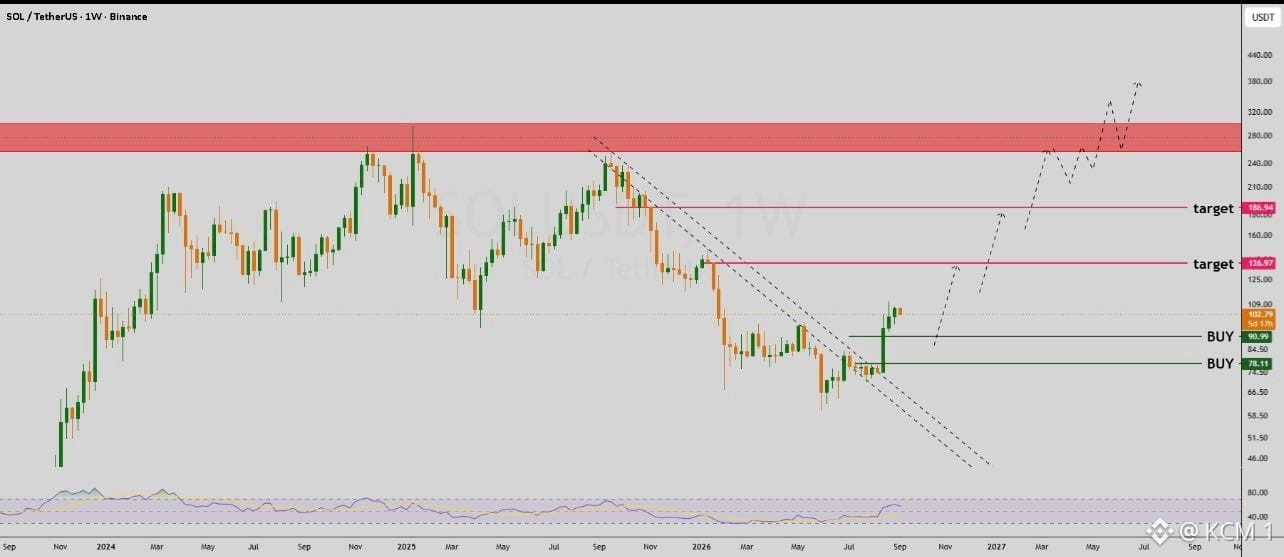
Tout le monde observe cette inversion hebdomadaire sur $SOL , mais passe à côté de la cassure de tendance sur plusieurs mois confirmant un pivot macro majeur.
Après avoir cassé la structure en canal parallèle descendant, le prix a reconquis le support structurel clé au-dessus de la zone d'achat à $90.99. Cette forte expansion haussière sur le timeframe hebdomadaire signale un changement de caractère à long terme, effaçant des mois de consolidation avec plus hauts décroissants.
En restant au-dessus des niveaux d'accumulation de $90.99 et $78.11, le scénario haussier macro se valide, débloquant des objectifs haussiers successifs à $138.97 et $186.94 . Maintenir cet élan ouvre la voie à une impulsion en plusieurs étapes vers la résistance majeure sous le plafond au-dessus de $260.00 .
Ne négligez pas les cassures de trendlines hebdomadaires : les changements de structure macro mettent en place les plus grands mouvements macro.
#SOL #Solana #CryptoAnalysis #TechnicalAnalysis
Tout le monde observe cette inversion hebdomadaire sur $SOL , mais passe à côté de la cassure de tendance sur plusieurs mois confirmant un pivot macro majeur.
Après avoir cassé la structure en canal parallèle descendant, le prix a reconquis le support structurel clé au-dessus de la zone d'achat à $90.99. Cette forte expansion haussière sur le timeframe hebdomadaire signale un changement de caractère à long terme, effaçant des mois de consolidation avec plus hauts décroissants.
En restant au-dessus des niveaux d'accumulation de $90.99 et $78.11, le scénario haussier macro se valide, débloquant des objectifs haussiers successifs à $138.97 et $186.94 . Maintenir cet élan ouvre la voie à une impulsion en plusieurs étapes vers la résistance majeure sous le plafond au-dessus de $260.00 .
Ne négligez pas les cassures de trendlines hebdomadaires : les changements de structure macro mettent en place les plus grands mouvements macro.
#SOL #Solana #CryptoAnalysis #TechnicalAnalysis
Après avoir cassé la structure en canal parallèle descendant, le prix a reconquis le support structurel clé au-dessus de la zone d'achat à $90.99. Cette forte expansion haussière sur le timeframe hebdomadaire signale un changement de caractère à long terme, effaçant des mois de consolidation avec plus hauts décroissants.
En restant au-dessus des niveaux d'accumulation de $90.99 et $78.11, le scénario haussier macro se valide, débloquant des objectifs haussiers successifs à $138.97 et $186.94 . Maintenir cet élan ouvre la voie à une impulsion en plusieurs étapes vers la résistance majeure sous le plafond au-dessus de $260.00 .
Ne négligez pas les cassures de trendlines hebdomadaires : les changements de structure macro mettent en place les plus grands mouvements macro.
#SOL #Solana #CryptoAnalysis #TechnicalAnalysis
65
·
--
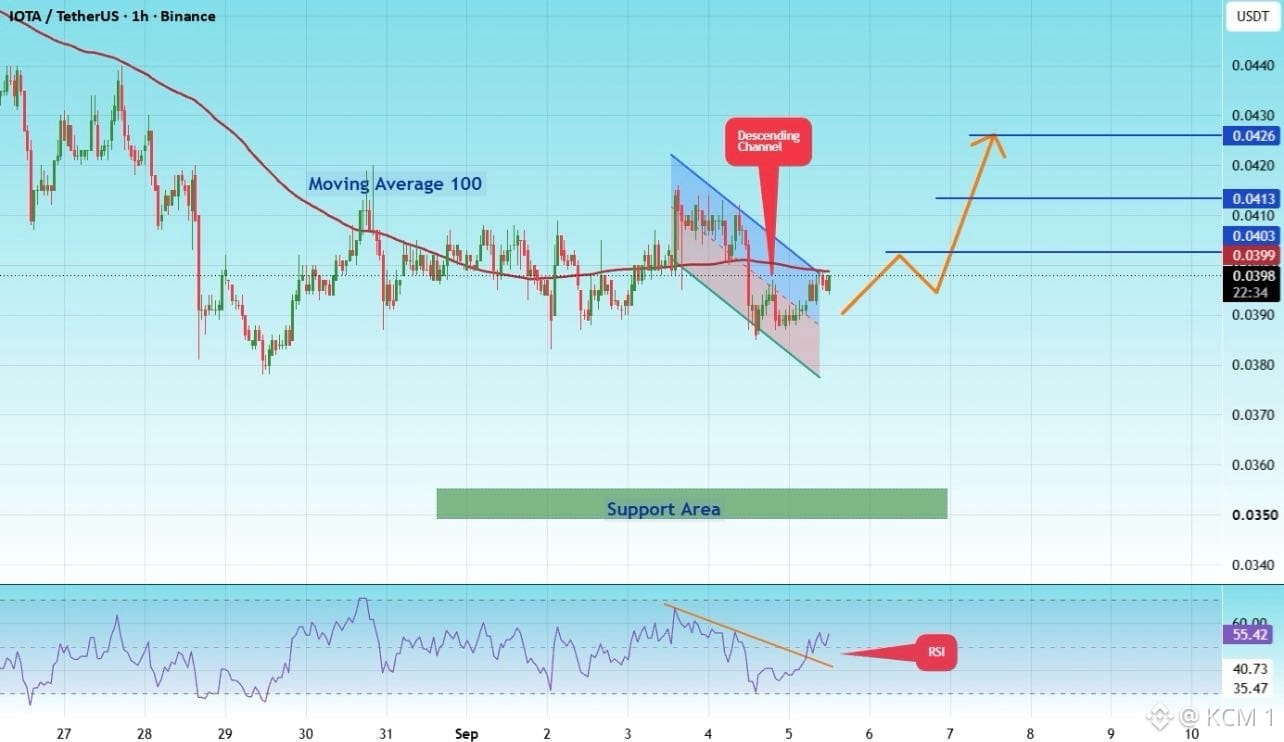
Tout le monde observe ce canal descendant serré sur $IOTA, mais passe à côté de la divergence haussière qui se forme, en particulier sur le RSI.
Après s’être consolidé autour de la moyenne mobile sur 100 périodes sur le graphique en 1 heure, le prix teste la limite supérieure de sa pente descendante locale. Pendant ce temps, le RSI est sorti de sa tendance baissière, signalant que l’élan acheteur se construit en arrière-plan avant que le prix ne réagisse.
Une cassure nette au-dessus de $0.0399 confirme le scénario de retournement, ouvrant la voie vers des objectifs de résistance intermédiaires à $0.0403, $0.0413 et $0.0426. Le maintien au-dessus de la zone de support locale proche de $0.0350 conserve pleinement la thèse haussière.
Ne cherchez pas l’expansion complète de la bougie : observez plutôt comment l’élan fait sortir le prix des schémas de consolidation locaux.
#IOTA #CryptoAnalysis #TechnicalAnalysis #Trading
Tout le monde observe ce canal descendant serré sur $IOTA, mais passe à côté de la divergence haussière qui se forme, en particulier sur le RSI.
Après s’être consolidé autour de la moyenne mobile sur 100 périodes sur le graphique en 1 heure, le prix teste la limite supérieure de sa pente descendante locale. Pendant ce temps, le RSI est sorti de sa tendance baissière, signalant que l’élan acheteur se construit en arrière-plan avant que le prix ne réagisse.
Une cassure nette au-dessus de $0.0399 confirme le scénario de retournement, ouvrant la voie vers des objectifs de résistance intermédiaires à $0.0403, $0.0413 et $0.0426. Le maintien au-dessus de la zone de support locale proche de $0.0350 conserve pleinement la thèse haussière.
Ne cherchez pas l’expansion complète de la bougie : observez plutôt comment l’élan fait sortir le prix des schémas de consolidation locaux.
#IOTA #CryptoAnalysis #TechnicalAnalysis #Trading
Après s’être consolidé autour de la moyenne mobile sur 100 périodes sur le graphique en 1 heure, le prix teste la limite supérieure de sa pente descendante locale. Pendant ce temps, le RSI est sorti de sa tendance baissière, signalant que l’élan acheteur se construit en arrière-plan avant que le prix ne réagisse.
Une cassure nette au-dessus de $0.0399 confirme le scénario de retournement, ouvrant la voie vers des objectifs de résistance intermédiaires à $0.0403, $0.0413 et $0.0426. Le maintien au-dessus de la zone de support locale proche de $0.0350 conserve pleinement la thèse haussière.
Ne cherchez pas l’expansion complète de la bougie : observez plutôt comment l’élan fait sortir le prix des schémas de consolidation locaux.
#IOTA #CryptoAnalysis #TechnicalAnalysis #Trading
56
·
--
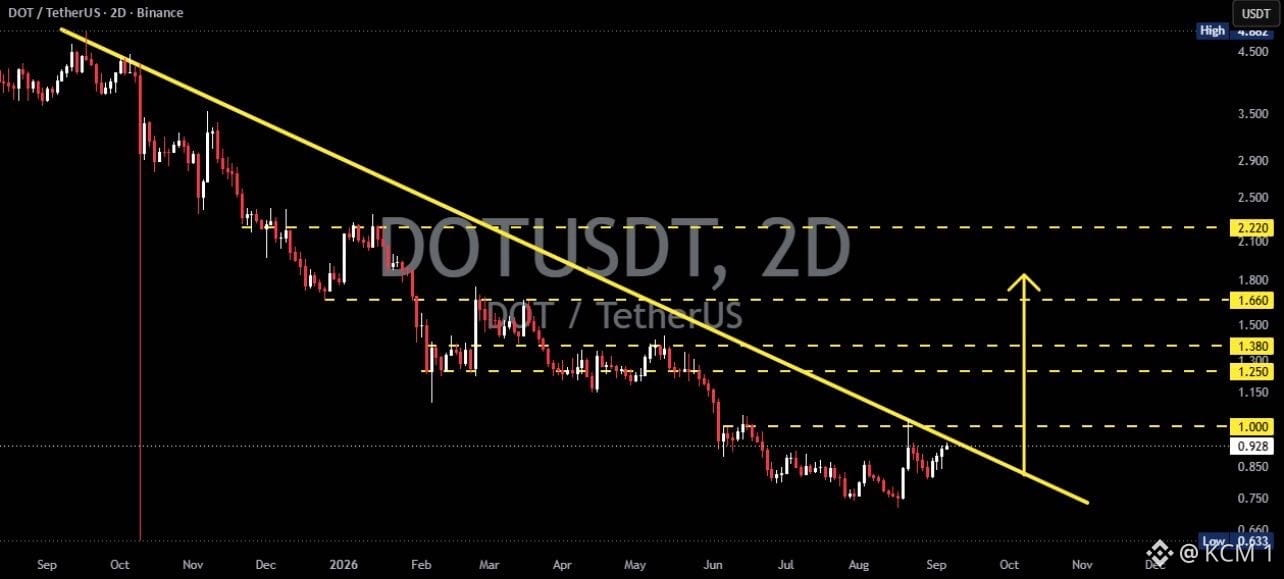
Tout le monde surveille cette tendance baissière de plusieurs mois sur $DOT, mais passe à côté du potentiel breakout de la ligne de tendance en formation près de la résistance locale.
Après des mois de sommets descendants contenus sous une forte ligne de tendance diagonale jaune, le prix teste la résistance autour de 0,928 $ près de la base macro. Une cassure nette au-dessus de ce plafond diagonal signale un changement de structure, faisant passer l’élan d’une distribution prolongée à une accumulation précoce.
Le franchissement de 1,000 $ confirme la cassure de la ligne de tendance, ouvrant des objectifs haussiers successifs à 1,250 $, 1,380 $ et 1,660 $. En revanche, un échec à briser la résistance diagonale laisse $DOT vulnérable à un nouveau test du support vers 0,750 $.
Ne tradez pas la ligne — attendez que la structure du marché confirme la cassure au-dessus de la résistance majeure.
#DOT #Polkadot #CryptoAnalysis #TechnicalAnalysis
Tout le monde surveille cette tendance baissière de plusieurs mois sur $DOT, mais passe à côté du potentiel breakout de la ligne de tendance en formation près de la résistance locale.
Après des mois de sommets descendants contenus sous une forte ligne de tendance diagonale jaune, le prix teste la résistance autour de 0,928 $ près de la base macro. Une cassure nette au-dessus de ce plafond diagonal signale un changement de structure, faisant passer l’élan d’une distribution prolongée à une accumulation précoce.
Le franchissement de 1,000 $ confirme la cassure de la ligne de tendance, ouvrant des objectifs haussiers successifs à 1,250 $, 1,380 $ et 1,660 $. En revanche, un échec à briser la résistance diagonale laisse $DOT vulnérable à un nouveau test du support vers 0,750 $.
Ne tradez pas la ligne — attendez que la structure du marché confirme la cassure au-dessus de la résistance majeure.
#DOT #Polkadot #CryptoAnalysis #TechnicalAnalysis
Après des mois de sommets descendants contenus sous une forte ligne de tendance diagonale jaune, le prix teste la résistance autour de 0,928 $ près de la base macro. Une cassure nette au-dessus de ce plafond diagonal signale un changement de structure, faisant passer l’élan d’une distribution prolongée à une accumulation précoce.
Le franchissement de 1,000 $ confirme la cassure de la ligne de tendance, ouvrant des objectifs haussiers successifs à 1,250 $, 1,380 $ et 1,660 $. En revanche, un échec à briser la résistance diagonale laisse $DOT vulnérable à un nouveau test du support vers 0,750 $.
Ne tradez pas la ligne — attendez que la structure du marché confirme la cassure au-dessus de la résistance majeure.
#DOT #Polkadot #CryptoAnalysis #TechnicalAnalysis
75
·
--
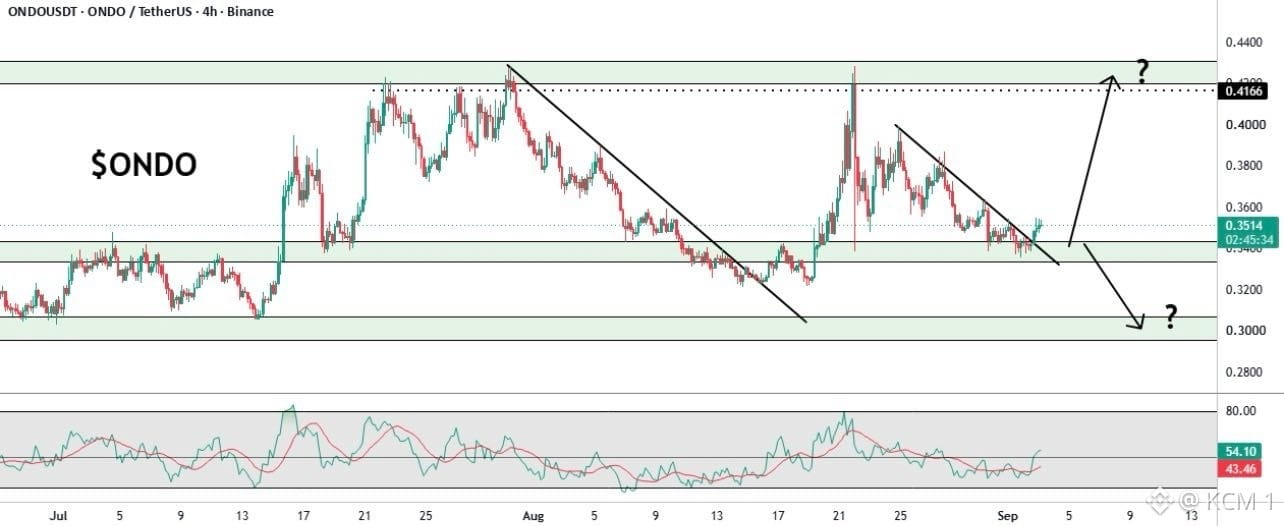
Alors que le marché débat de la direction au niveau du support local, ce nœud de décision sur $ONDO met en place un déclencheur d’expansion binaire clair.
Après avoir cassé la ligne de tendance baissière locale, le prix reteste un support dynamique près de $0.3400 à l’intérieur d’un bloc de demande horizontal clé. Le RSI qui repasse au-dessus de 50 indique qu’un momentum haussier sous-jacent tente de reprendre le contrôle de la structure sur la période de temps inférieure.
Un maintien solide au-dessus de $0.3400 ouvre une voie directe pour une poussée haussière vers la résistance supérieure à $0.4166 . Cependant, un échec à défendre le support risque d’entraîner un nouveau test de rupture vers une demande macro plus basse près de $0.3000 .
Ne prédisez pas le résultat trop tôt — laissez le retest du support confirmer la direction de l’expansion.
#ONDO #OndoFinance #CryptoAnalysis #TechnicalAnalysis
Alors que le marché débat de la direction au niveau du support local, ce nœud de décision sur $ONDO met en place un déclencheur d’expansion binaire clair.
Après avoir cassé la ligne de tendance baissière locale, le prix reteste un support dynamique près de $0.3400 à l’intérieur d’un bloc de demande horizontal clé. Le RSI qui repasse au-dessus de 50 indique qu’un momentum haussier sous-jacent tente de reprendre le contrôle de la structure sur la période de temps inférieure.
Un maintien solide au-dessus de $0.3400 ouvre une voie directe pour une poussée haussière vers la résistance supérieure à $0.4166 . Cependant, un échec à défendre le support risque d’entraîner un nouveau test de rupture vers une demande macro plus basse près de $0.3000 .
Ne prédisez pas le résultat trop tôt — laissez le retest du support confirmer la direction de l’expansion.
#ONDO #OndoFinance #CryptoAnalysis #TechnicalAnalysis
Après avoir cassé la ligne de tendance baissière locale, le prix reteste un support dynamique près de $0.3400 à l’intérieur d’un bloc de demande horizontal clé. Le RSI qui repasse au-dessus de 50 indique qu’un momentum haussier sous-jacent tente de reprendre le contrôle de la structure sur la période de temps inférieure.
Un maintien solide au-dessus de $0.3400 ouvre une voie directe pour une poussée haussière vers la résistance supérieure à $0.4166 . Cependant, un échec à défendre le support risque d’entraîner un nouveau test de rupture vers une demande macro plus basse près de $0.3000 .
Ne prédisez pas le résultat trop tôt — laissez le retest du support confirmer la direction de l’expansion.
#ONDO #OndoFinance #CryptoAnalysis #TechnicalAnalysis
76
·
--
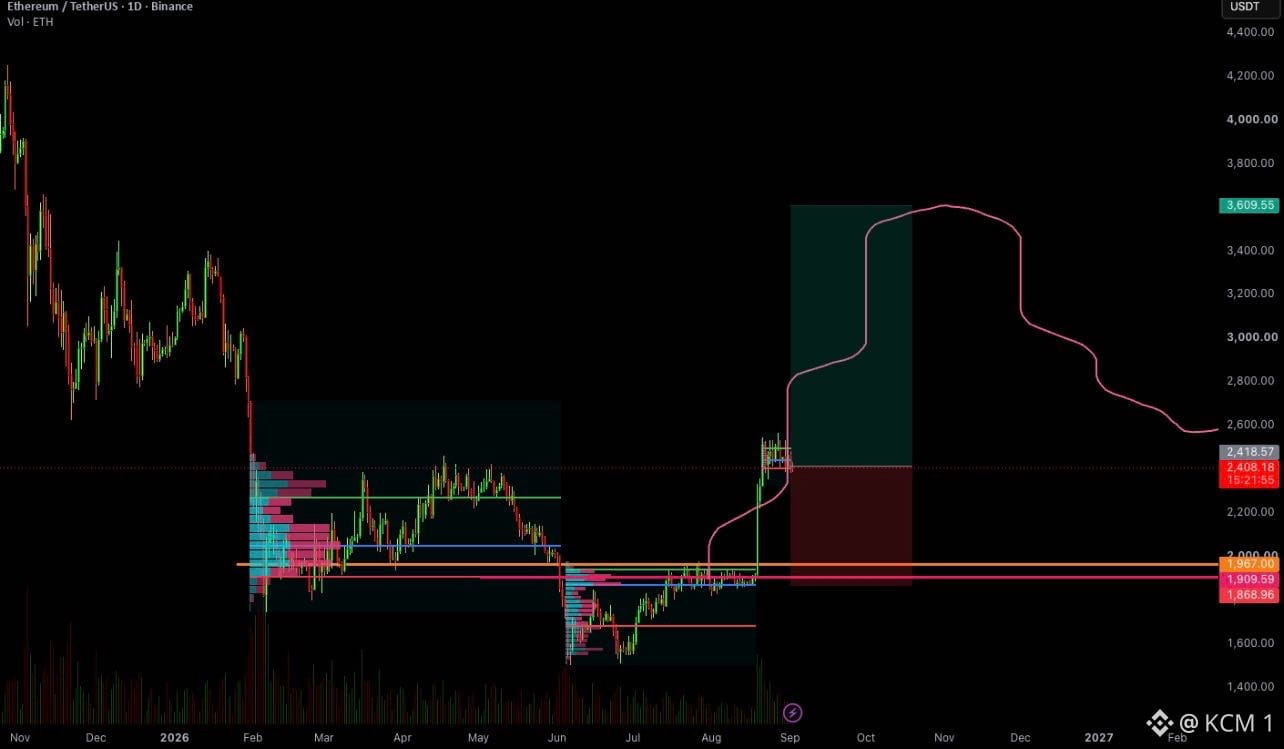
Alors que le consensus anticipe une trajectoire ascendante directe, cette projection sur $ETH trace une feuille de route macro à forte conviction couvrant la prochaine phase du cycle.
Après avoir reconquis le niveau clé de consolidation à $2,400, l’action des prix établit un creux plus haut au-dessus d’un support majeur du profil de volume. La courbe projetée modélise une poussée d’expansion agressive vers $3,600, suivie d’une phase de correction macro prolongée jusqu’au début de 2027.
Se maintenir au-dessus du niveau principal d’invalidation près de $1,900 préserve pleinement la trajectoire d’expansion haussière à long terme. La reconquête de l’offre en surplomb ouvre la porte à un potentiel de hausse significatif avant que le marché n’atteigne son pic de cycle.
Concentrez-vous sur la structure macro plutôt que sur le bruit quotidien — le cadre de tendance plus large guide les véritables mouvements.
#ETH #Ethereum #CryptoAnalysis #TechnicalAnalysis
Alors que le consensus anticipe une trajectoire ascendante directe, cette projection sur $ETH trace une feuille de route macro à forte conviction couvrant la prochaine phase du cycle.
Après avoir reconquis le niveau clé de consolidation à $2,400, l’action des prix établit un creux plus haut au-dessus d’un support majeur du profil de volume. La courbe projetée modélise une poussée d’expansion agressive vers $3,600, suivie d’une phase de correction macro prolongée jusqu’au début de 2027.
Se maintenir au-dessus du niveau principal d’invalidation près de $1,900 préserve pleinement la trajectoire d’expansion haussière à long terme. La reconquête de l’offre en surplomb ouvre la porte à un potentiel de hausse significatif avant que le marché n’atteigne son pic de cycle.
Concentrez-vous sur la structure macro plutôt que sur le bruit quotidien — le cadre de tendance plus large guide les véritables mouvements.
#ETH #Ethereum #CryptoAnalysis #TechnicalAnalysis
Après avoir reconquis le niveau clé de consolidation à $2,400, l’action des prix établit un creux plus haut au-dessus d’un support majeur du profil de volume. La courbe projetée modélise une poussée d’expansion agressive vers $3,600, suivie d’une phase de correction macro prolongée jusqu’au début de 2027.
Se maintenir au-dessus du niveau principal d’invalidation près de $1,900 préserve pleinement la trajectoire d’expansion haussière à long terme. La reconquête de l’offre en surplomb ouvre la porte à un potentiel de hausse significatif avant que le marché n’atteigne son pic de cycle.
Concentrez-vous sur la structure macro plutôt que sur le bruit quotidien — le cadre de tendance plus large guide les véritables mouvements.
#ETH #Ethereum #CryptoAnalysis #TechnicalAnalysis
70
·
--
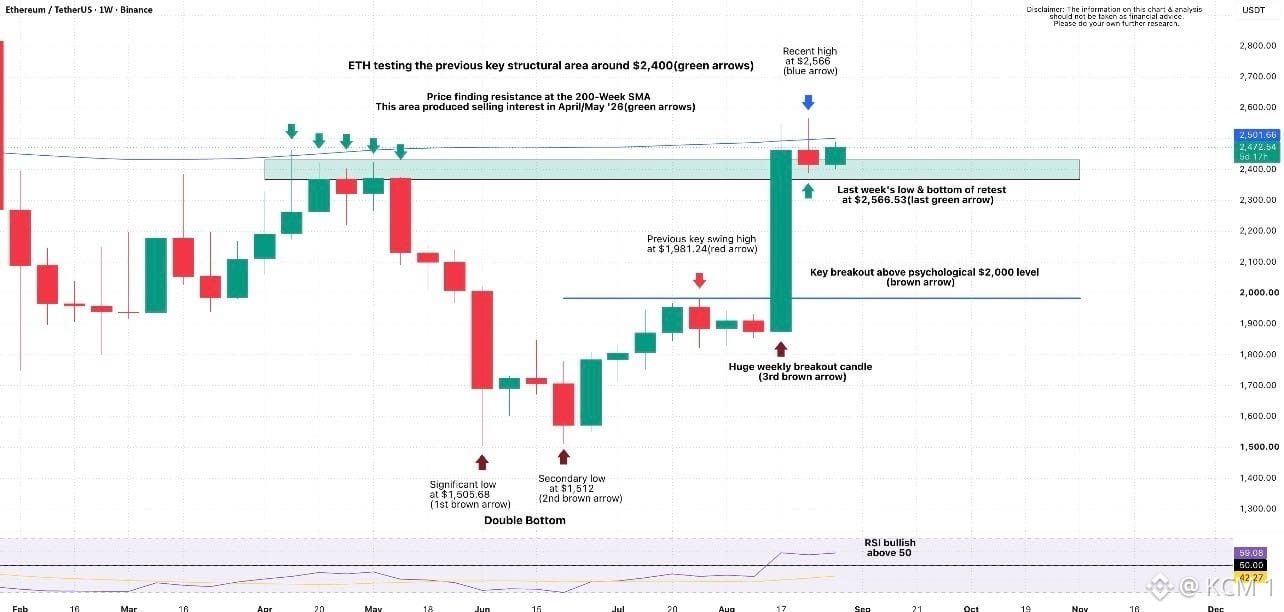
Tout le monde observe ce re-test hebdomadaire sur $ETH, mais beaucoup passent à côté de la base macro en double creux qui alimente la cassure.
Après avoir construit une solide base en double creux près de 1 505 $ et franchi le seuil psychologique des 2 000 $, le prix s’est directement étendu jusqu’à la zone clé de résistance structurelle autour de 2 400 $. La gigantesque bougie verte hebdomadaire de cassure confirme un fort retour de la demande institutionnelle sur le marché.
Le maintien au-dessus de l’ancien plafond horizontal près de 2 400 $ transforme l’offre historique en nouveau support structurel. Avec un RSI hebdomadaire qui reste haussier au-dessus de 50, un re-test réussi de cette zone ouvre la voie vers une extension au-delà du récent sommet à 2 566 $.
Ne laissez pas les petits re-tests vous ébranler — observez comment les anciennes zones de résistance se transforment en solide support haussier.
#ETH #Ethereum #CryptoAnalysis #TechnicalAnalysis
Tout le monde observe ce re-test hebdomadaire sur $ETH, mais beaucoup passent à côté de la base macro en double creux qui alimente la cassure.
Après avoir construit une solide base en double creux près de 1 505 $ et franchi le seuil psychologique des 2 000 $, le prix s’est directement étendu jusqu’à la zone clé de résistance structurelle autour de 2 400 $. La gigantesque bougie verte hebdomadaire de cassure confirme un fort retour de la demande institutionnelle sur le marché.
Le maintien au-dessus de l’ancien plafond horizontal près de 2 400 $ transforme l’offre historique en nouveau support structurel. Avec un RSI hebdomadaire qui reste haussier au-dessus de 50, un re-test réussi de cette zone ouvre la voie vers une extension au-delà du récent sommet à 2 566 $.
Ne laissez pas les petits re-tests vous ébranler — observez comment les anciennes zones de résistance se transforment en solide support haussier.
#ETH #Ethereum #CryptoAnalysis #TechnicalAnalysis
Après avoir construit une solide base en double creux près de 1 505 $ et franchi le seuil psychologique des 2 000 $, le prix s’est directement étendu jusqu’à la zone clé de résistance structurelle autour de 2 400 $. La gigantesque bougie verte hebdomadaire de cassure confirme un fort retour de la demande institutionnelle sur le marché.
Le maintien au-dessus de l’ancien plafond horizontal près de 2 400 $ transforme l’offre historique en nouveau support structurel. Avec un RSI hebdomadaire qui reste haussier au-dessus de 50, un re-test réussi de cette zone ouvre la voie vers une extension au-delà du récent sommet à 2 566 $.
Ne laissez pas les petits re-tests vous ébranler — observez comment les anciennes zones de résistance se transforment en solide support haussier.
#ETH #Ethereum #CryptoAnalysis #TechnicalAnalysis
97
·
--
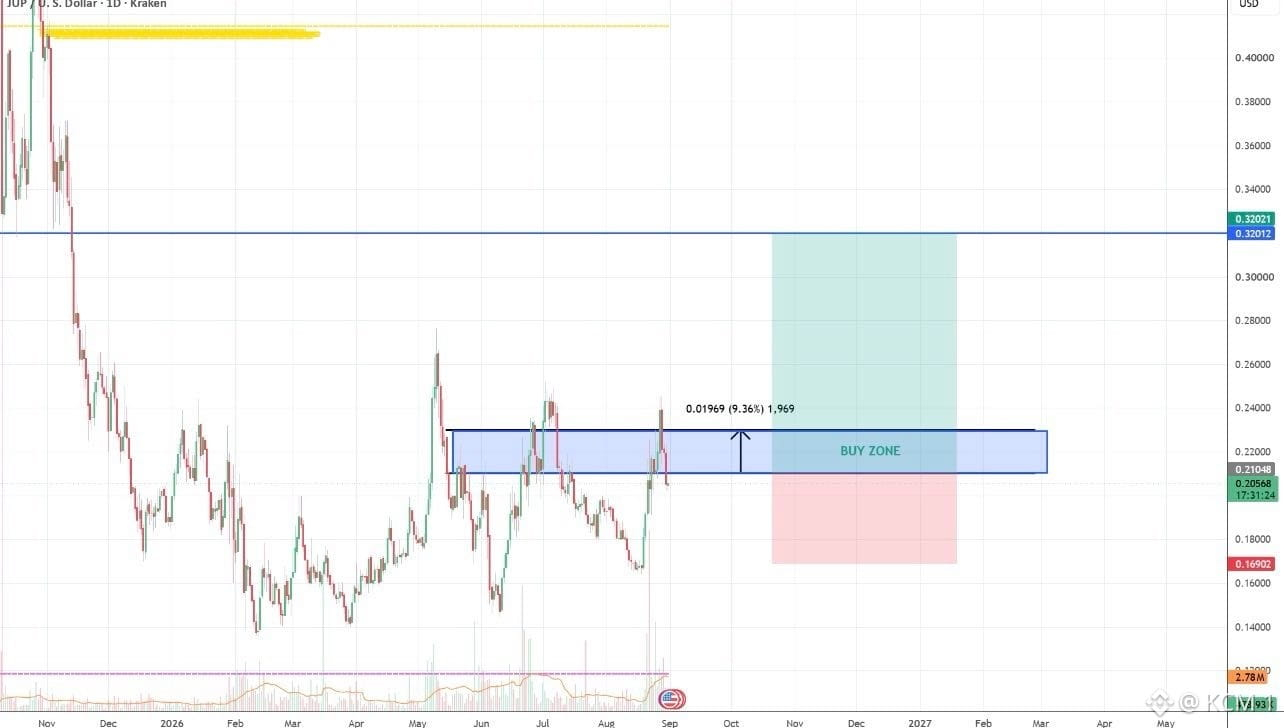
Tout le monde surveille cette consolidation sur $JUP, mais passe à côté du bloc de demande clé qui met en place une configuration haussière à forte probabilité.
Après avoir trouvé un creux macro autour de $0.1400 et formé une structure de creux ascendant, le prix teste le support d’accumulation principal dans la zone d’achat de $0.2100 à $0.2300. Les rebonds répétés sur cette plage horizontale indiquent que les acheteurs défendent constamment la base contre les ventes à des unités de temps inférieures.
Se maintenir au-dessus de la borne inférieure près de $0.2050 valide la configuration de trading, ouvrant la voie à une expansion haussière vers l’objectif de résistance supérieure à $0.3200. Maintenir un stop loss près de $0.1690 protège contre d’éventuelles cassures de tendance macro.
Les acheteurs patients accumulent dans les zones de demande clés avant que la phase d’expansion ne démarre.
#JUP #Jupiter #CryptoAnalysis #TechnicalAnalysis
Tout le monde surveille cette consolidation sur $JUP, mais passe à côté du bloc de demande clé qui met en place une configuration haussière à forte probabilité.
Après avoir trouvé un creux macro autour de $0.1400 et formé une structure de creux ascendant, le prix teste le support d’accumulation principal dans la zone d’achat de $0.2100 à $0.2300. Les rebonds répétés sur cette plage horizontale indiquent que les acheteurs défendent constamment la base contre les ventes à des unités de temps inférieures.
Se maintenir au-dessus de la borne inférieure près de $0.2050 valide la configuration de trading, ouvrant la voie à une expansion haussière vers l’objectif de résistance supérieure à $0.3200. Maintenir un stop loss près de $0.1690 protège contre d’éventuelles cassures de tendance macro.
Les acheteurs patients accumulent dans les zones de demande clés avant que la phase d’expansion ne démarre.
#JUP #Jupiter #CryptoAnalysis #TechnicalAnalysis
Après avoir trouvé un creux macro autour de $0.1400 et formé une structure de creux ascendant, le prix teste le support d’accumulation principal dans la zone d’achat de $0.2100 à $0.2300. Les rebonds répétés sur cette plage horizontale indiquent que les acheteurs défendent constamment la base contre les ventes à des unités de temps inférieures.
Se maintenir au-dessus de la borne inférieure près de $0.2050 valide la configuration de trading, ouvrant la voie à une expansion haussière vers l’objectif de résistance supérieure à $0.3200. Maintenir un stop loss près de $0.1690 protège contre d’éventuelles cassures de tendance macro.
Les acheteurs patients accumulent dans les zones de demande clés avant que la phase d’expansion ne démarre.
#JUP #Jupiter #CryptoAnalysis #TechnicalAnalysis
80
·
--
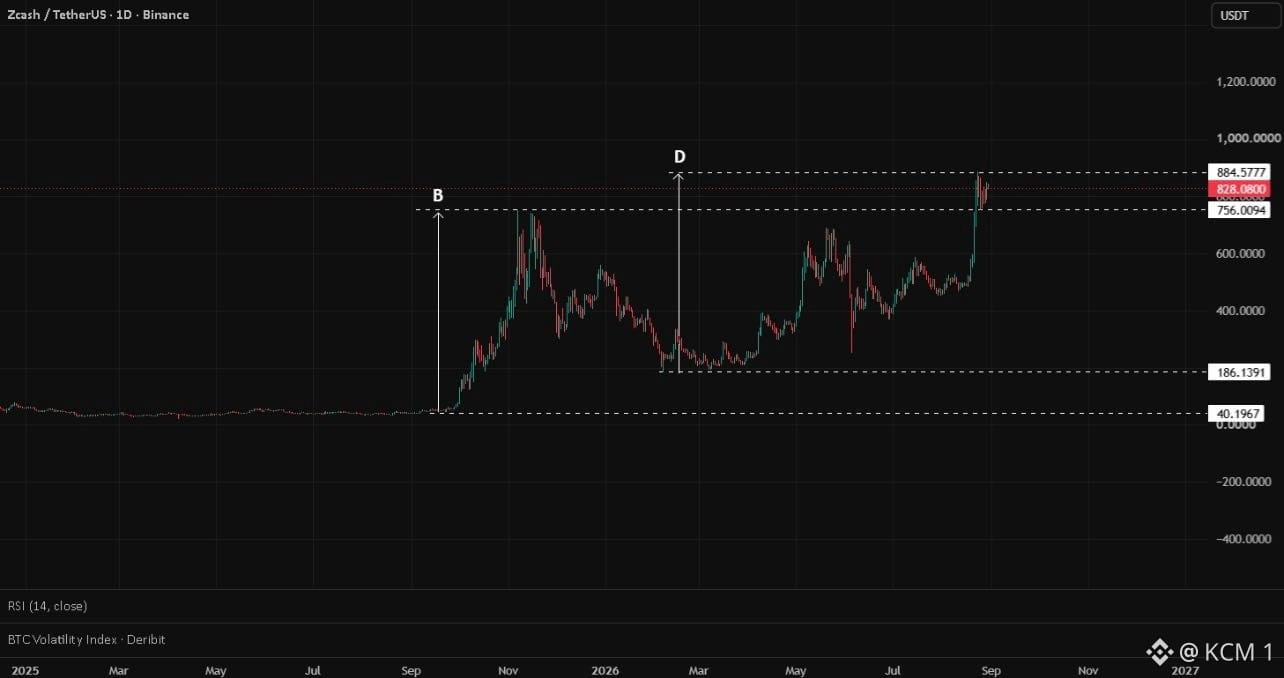
Tout le monde regarde cette énorme cassure sur $ZEC, mais en manquant la projection historique du mouvement mesuré vers une importante zone d’offre.
Après avoir complété une large accumulation en base et franchi les sommets précédents de la fourchette près de $756.00, le prix s’est fortement étendu à la hausse jusqu’à $884.57. L’impulsion verticale reflète les cycles précédents de forte impulsion, poussant le prix directement vers des niveaux de résistance macro clés.
Une retest temporaire vers le niveau de cassure proche de $756.00 confirmerait l’ancienne résistance comme un support solide. Le fait de rester au-dessus de ce seuil clé maintient la structure haussière et ouvre la voie à une poursuite vers 1,000.00 .
Ne poursuis pas l’expansion verticale : observe comment la structure du marché se construit au-dessus des zones de cassure majeures.
#ZEC #Zcash #CryptoAnalysis #TechnicalAnalysis
Tout le monde regarde cette énorme cassure sur $ZEC, mais en manquant la projection historique du mouvement mesuré vers une importante zone d’offre.
Après avoir complété une large accumulation en base et franchi les sommets précédents de la fourchette près de $756.00, le prix s’est fortement étendu à la hausse jusqu’à $884.57. L’impulsion verticale reflète les cycles précédents de forte impulsion, poussant le prix directement vers des niveaux de résistance macro clés.
Une retest temporaire vers le niveau de cassure proche de $756.00 confirmerait l’ancienne résistance comme un support solide. Le fait de rester au-dessus de ce seuil clé maintient la structure haussière et ouvre la voie à une poursuite vers 1,000.00 .
Ne poursuis pas l’expansion verticale : observe comment la structure du marché se construit au-dessus des zones de cassure majeures.
#ZEC #Zcash #CryptoAnalysis #TechnicalAnalysis
Après avoir complété une large accumulation en base et franchi les sommets précédents de la fourchette près de $756.00, le prix s’est fortement étendu à la hausse jusqu’à $884.57. L’impulsion verticale reflète les cycles précédents de forte impulsion, poussant le prix directement vers des niveaux de résistance macro clés.
Une retest temporaire vers le niveau de cassure proche de $756.00 confirmerait l’ancienne résistance comme un support solide. Le fait de rester au-dessus de ce seuil clé maintient la structure haussière et ouvre la voie à une poursuite vers 1,000.00 .
Ne poursuis pas l’expansion verticale : observe comment la structure du marché se construit au-dessus des zones de cassure majeures.
#ZEC #Zcash #CryptoAnalysis #TechnicalAnalysis
81
·
--
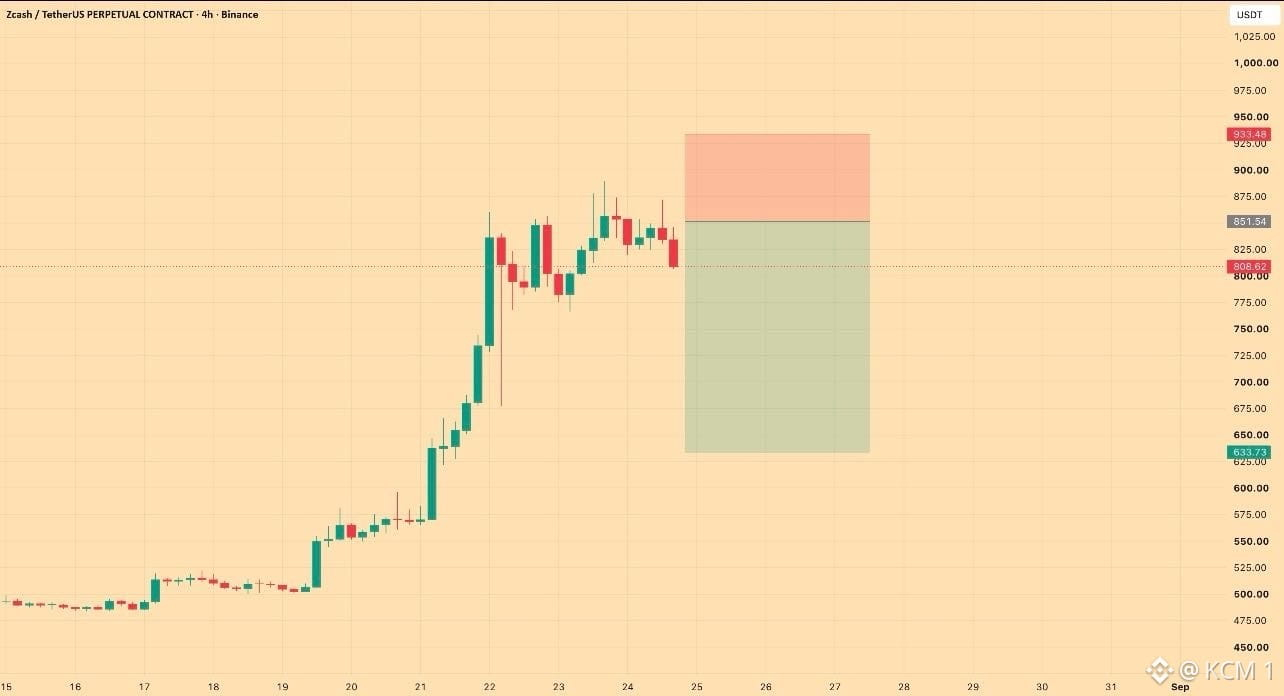
Tout le monde regarde cette rallye trop étirée sur $ZEC, mais en manquant la phase de distribution qui se met en place sur les plus hauts locaux.
Après une course verticale explosive de $500 jusqu'à $880, l'élan s'est essoufflé pour se transformer en une consolidation serrée en creux plus élevés sur le graphique en 4 heures. L'incapacité de faire de nouveaux plus hauts après une impulsion aussi massive signale que la force d'achat s'épuise rapidement.
Un échec à reconquérir le niveau de $851 maintient la thèse de position courte valide, avec pour cible un mouvement de retour à la moyenne vers $633 afin de combler le vide de liquidité inférieur. Placer un stop loss autour de $933 protège contre d’éventuels derniers pics de short-squeeze.
Les sursauts verticaux attirent les acheteurs FOMO tardifs juste avant que la structure du marché ne bascule vers une correction.
#ZEC #Zcash #CryptoAnalysis #TechnicalAnalysis
Tout le monde regarde cette rallye trop étirée sur $ZEC, mais en manquant la phase de distribution qui se met en place sur les plus hauts locaux.
Après une course verticale explosive de $500 jusqu'à $880, l'élan s'est essoufflé pour se transformer en une consolidation serrée en creux plus élevés sur le graphique en 4 heures. L'incapacité de faire de nouveaux plus hauts après une impulsion aussi massive signale que la force d'achat s'épuise rapidement.
Un échec à reconquérir le niveau de $851 maintient la thèse de position courte valide, avec pour cible un mouvement de retour à la moyenne vers $633 afin de combler le vide de liquidité inférieur. Placer un stop loss autour de $933 protège contre d’éventuels derniers pics de short-squeeze.
Les sursauts verticaux attirent les acheteurs FOMO tardifs juste avant que la structure du marché ne bascule vers une correction.
#ZEC #Zcash #CryptoAnalysis #TechnicalAnalysis
Après une course verticale explosive de $500 jusqu'à $880, l'élan s'est essoufflé pour se transformer en une consolidation serrée en creux plus élevés sur le graphique en 4 heures. L'incapacité de faire de nouveaux plus hauts après une impulsion aussi massive signale que la force d'achat s'épuise rapidement.
Un échec à reconquérir le niveau de $851 maintient la thèse de position courte valide, avec pour cible un mouvement de retour à la moyenne vers $633 afin de combler le vide de liquidité inférieur. Placer un stop loss autour de $933 protège contre d’éventuels derniers pics de short-squeeze.
Les sursauts verticaux attirent les acheteurs FOMO tardifs juste avant que la structure du marché ne bascule vers une correction.
#ZEC #Zcash #CryptoAnalysis #TechnicalAnalysis
80
·
--
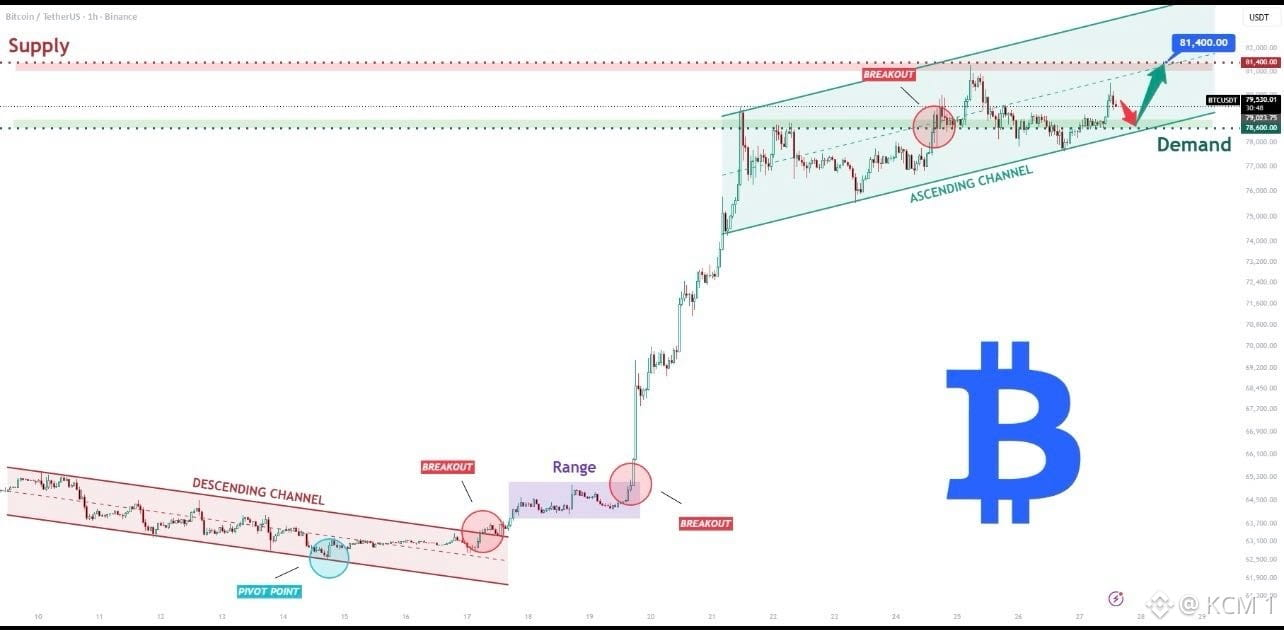
Tout le monde observe cette consolidation serrée à l’intérieur du canal ascendant sur $BTC , mais il manque le setup de continuation de tendance qui se forme à partir d’un support de demande.
Après avoir cassé le bas du canal descendant et consolidé dans la fourchette intermédiaire autour de 65 000 $, le prix a fortement étendu son mouvement vers la zone des 79 500 $. L’action actuelle du prix respecte la demande du canal inférieur près de 78 600 , en restant solidement au-dessus d’un support dynamique clé.
Un rebond réussi depuis la ligne de demande du canal prépare la prochaine étape à la hausse, avec pour cible un retest propre de l’offre au-dessus vers 81 400 . Maintenir cette structure de canal permet de conserver pleinement l’élan haussier plus large.
Ne paniquez pas lors des replis locaux : c’est un positionnement où le support sur des graphiques de plus faible timeframe s’aligne avec la continuation du canal.
#BTC #Bitcoin #CryptoAnalysis #TechnicalAnalysis
Tout le monde observe cette consolidation serrée à l’intérieur du canal ascendant sur $BTC , mais il manque le setup de continuation de tendance qui se forme à partir d’un support de demande.
Après avoir cassé le bas du canal descendant et consolidé dans la fourchette intermédiaire autour de 65 000 $, le prix a fortement étendu son mouvement vers la zone des 79 500 $. L’action actuelle du prix respecte la demande du canal inférieur près de 78 600 , en restant solidement au-dessus d’un support dynamique clé.
Un rebond réussi depuis la ligne de demande du canal prépare la prochaine étape à la hausse, avec pour cible un retest propre de l’offre au-dessus vers 81 400 . Maintenir cette structure de canal permet de conserver pleinement l’élan haussier plus large.
Ne paniquez pas lors des replis locaux : c’est un positionnement où le support sur des graphiques de plus faible timeframe s’aligne avec la continuation du canal.
#BTC #Bitcoin #CryptoAnalysis #TechnicalAnalysis
Après avoir cassé le bas du canal descendant et consolidé dans la fourchette intermédiaire autour de 65 000 $, le prix a fortement étendu son mouvement vers la zone des 79 500 $. L’action actuelle du prix respecte la demande du canal inférieur près de 78 600 , en restant solidement au-dessus d’un support dynamique clé.
Un rebond réussi depuis la ligne de demande du canal prépare la prochaine étape à la hausse, avec pour cible un retest propre de l’offre au-dessus vers 81 400 . Maintenir cette structure de canal permet de conserver pleinement l’élan haussier plus large.
Ne paniquez pas lors des replis locaux : c’est un positionnement où le support sur des graphiques de plus faible timeframe s’aligne avec la continuation du canal.
#BTC #Bitcoin #CryptoAnalysis #TechnicalAnalysis
79
·
--
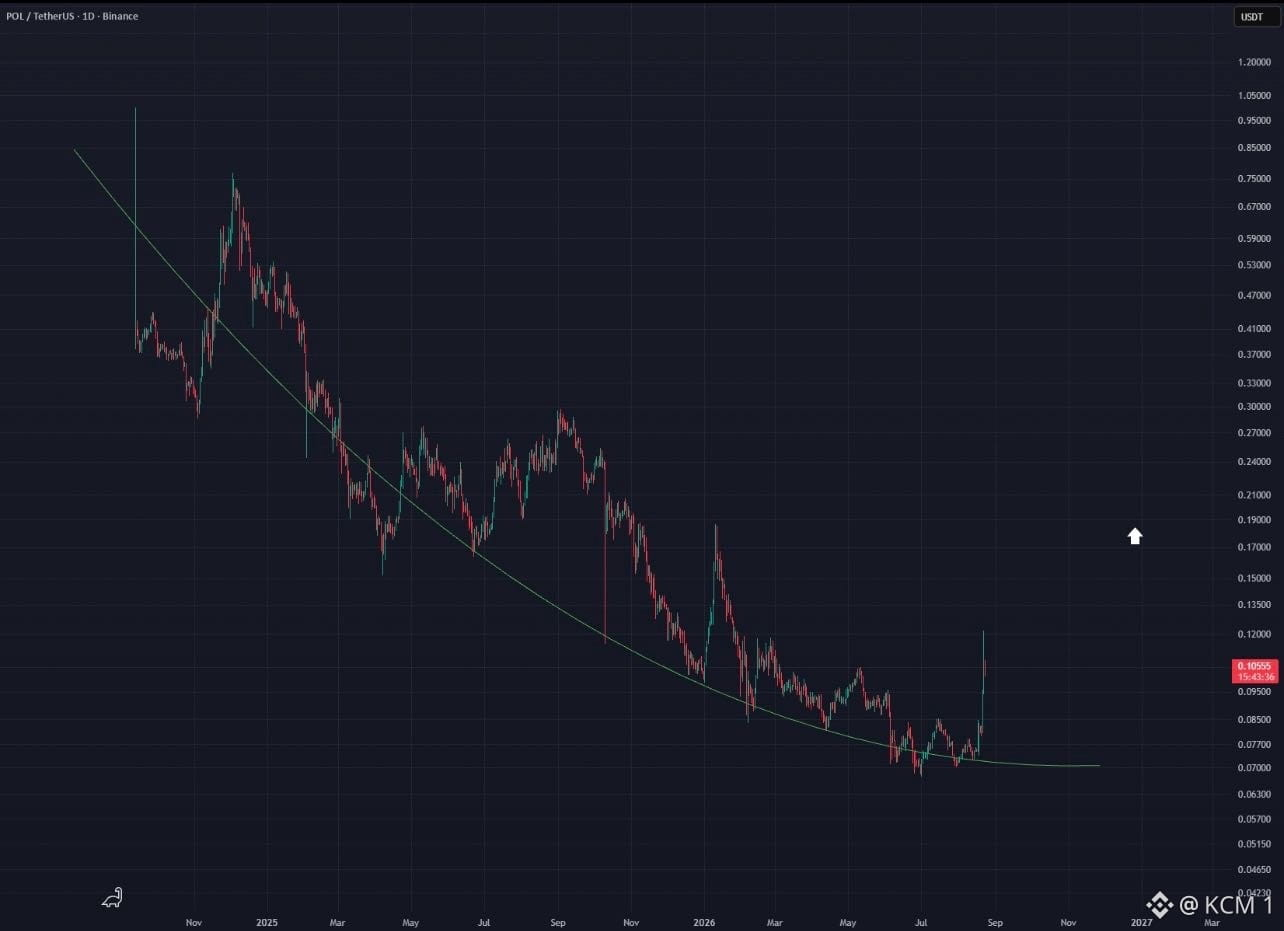
Tout le monde observe cette brusque hausse sur $POL, mais passe à côté de la base arrondie sur plusieurs années qui vient de déclencher une percée structurelle majeure.
Après une longue tendance baissière suite à une courbe parabolique arrondie, le prix a enfin reconquis un support clé près de $0.0750 et a explosé à la hausse vers $0.1100. Cette bougie d’expansion verte agressive signale que les acheteurs absorbent l’offre massive en plafond à long terme située en bas de la fourchette macro.
Même si des cadres plus courts peuvent voir un repli à court terme après une impulsion verticale aussi marquée, le fait de rester au-dessus du niveau de cassure de la courbe confirme le changement de tendance. Le maintien de cette structure pose les bases d’une inversion de tendance prolongée vers des objectifs de résistance plus élevés.
Ne négligez pas les courbes d’accumulation sur plusieurs mois : lorsqu’elles se brisent, l’élan change très vite.
#POL #Polygon #CryptoAnalysis #TechnicalAnalysis
Tout le monde observe cette brusque hausse sur $POL, mais passe à côté de la base arrondie sur plusieurs années qui vient de déclencher une percée structurelle majeure.
Après une longue tendance baissière suite à une courbe parabolique arrondie, le prix a enfin reconquis un support clé près de $0.0750 et a explosé à la hausse vers $0.1100. Cette bougie d’expansion verte agressive signale que les acheteurs absorbent l’offre massive en plafond à long terme située en bas de la fourchette macro.
Même si des cadres plus courts peuvent voir un repli à court terme après une impulsion verticale aussi marquée, le fait de rester au-dessus du niveau de cassure de la courbe confirme le changement de tendance. Le maintien de cette structure pose les bases d’une inversion de tendance prolongée vers des objectifs de résistance plus élevés.
Ne négligez pas les courbes d’accumulation sur plusieurs mois : lorsqu’elles se brisent, l’élan change très vite.
#POL #Polygon #CryptoAnalysis #TechnicalAnalysis
Après une longue tendance baissière suite à une courbe parabolique arrondie, le prix a enfin reconquis un support clé près de $0.0750 et a explosé à la hausse vers $0.1100. Cette bougie d’expansion verte agressive signale que les acheteurs absorbent l’offre massive en plafond à long terme située en bas de la fourchette macro.
Même si des cadres plus courts peuvent voir un repli à court terme après une impulsion verticale aussi marquée, le fait de rester au-dessus du niveau de cassure de la courbe confirme le changement de tendance. Le maintien de cette structure pose les bases d’une inversion de tendance prolongée vers des objectifs de résistance plus élevés.
Ne négligez pas les courbes d’accumulation sur plusieurs mois : lorsqu’elles se brisent, l’élan change très vite.
#POL #Polygon #CryptoAnalysis #TechnicalAnalysis
65
Connectez-vous pour découvrir plus de contenu
Rejoignez la communauté mondiale des adeptes de cryptomonnaies sur Binance Square
⚡️ Suviez les dernières informations importantes sur les cryptomonnaies.
💬 Jugé digne de confiance par la plus grande plateforme d’échange de cryptomonnaies au monde.
👍 Découvrez les connaissances que partagent les créateurs vérifiés.
Adresse e-mail/Nº de téléphone
Sujets d’actualité
AIStocksWhatNext
690,498 vues
5,134 mentions
Partagez et gagnez une récompense de trafic dans notre campagne de hashtag tendance
✨Sujet : Quelles autres opportunités d’investissement restent-elles alors que les actions liées à l’IA continuent de grimper ?
👉Comment participer :
Publiez une courte publication ou un article avec le hashtag #AIStocksWhatNext
Partagez si vous êtes plutôt haussier ou baissier, et publiez vos avoirs en actions IA ou votre transaction — utiliser le widget de trading peut améliorer votre éligibilité.
Vous pouvez aussi renforcer votre publication en partageant des données ou des graphiques, et en évitant les images générées par l’IA.
✍️Créez du contenu à partir des angles ci-dessous :
- Nvidia affirme que les ventes de puces vont doubler l’an prochain, et que les principaux acteurs de l’IA continuent d’enregistrer des revenus records ; les dépenses en calcul qui soutiennent tout cela sont tout aussi impressionnantes. La demande en IA décolle-t-elle vraiment ? Et combien de temps cela peut-il durer ? Les actions IA montent partout. Est-ce une vraie cassure, ou juste un rebond à court terme ?
- Des leaders de l’industrie appellent à ralentir le développement de l’IA, tandis que Trump prévoit de construire une « Force IA », affirmant que l’IA pourrait représenter 25 % du PIB américain à l’avenir. De quel côté êtes-vous ? Le soutien au niveau des États sera-t-il un gain de long terme pour les actions IA ?
- Achetez-vous des actions liées à l’IA ? Partagez votre transaction/position liée à l’IA avec notre widget de partage de trading.
⏰Période de la campagne :
- 2026-09-22 7:00 - 2026-09-24 4:00 UTC
🎁Récompense :
- Les publications qualifiées qui respectent les consignes ci-dessus et contiennent plus de 100 mots seront examinées et pourront recevoir un boost aléatoire de trafic de 500 à 3 000 vues. Vous recevrez une notification de la part de votre secrétaire de flux si votre publication est sélectionnée.
- Ayez une chance de voir votre article mis en avant sur Binance Square Official
Vous cherchez des idées pour votre publication ? Visitez la page du sujet #AIStocksWhatNext ou la page Square Guide on How to Post for Better Reach.
Binance Square Official
·504 mentions J’aime
·1.4M vues
21SharesLaunchesEuropesFirstZcashETP
16,856 vues
576 mentions
CardanoJoinsX402PaymentStandard
12,322 vues
435 mentions