*DIVERGENCE
What is a Divergence and how to find it-
The point where two things split off from each other is called a divergence. When there is a difference between the direction of Price movement and any indicator, it is called “Divergence”. When the market momentum has reflected in Indicator but yet to reflect in Price, this causes a Divergence.
You can use indicators like Volume, RSI, MACD, Stochastic etc to find a Divergence.
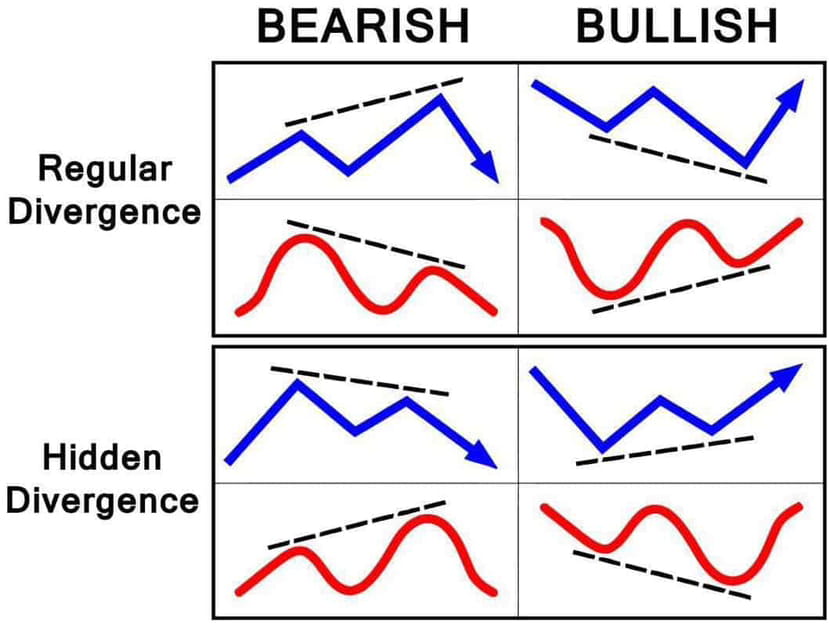
Fig. 3.1 shows all the basic potential forms of Divergences. Pattern in Blue shows price action while pattern in Red shows indicator direction.
Use of Divergence with different indicators-
1. EMA and Stochastic -
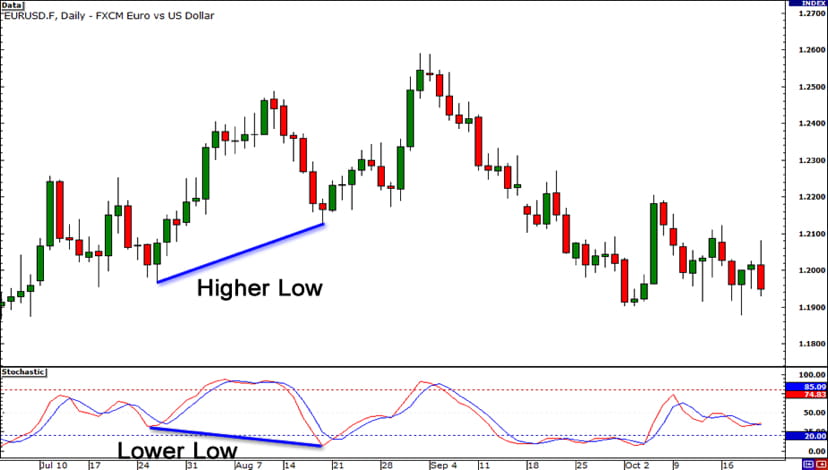
(1) If the price is above 200 EMA, look for the divergences on the lower side of Price and Stochastic. This basically means, in an uptrend you should be looking for Bullish Divergence.
Fig. 3.2
(2) If the price is below 200 EMA, search for the Divergences on the upper side of Price and Stochastic. The means, in a downtrend you should be looking for Bearish Divergence.
2. RSI-
(1) If the Price is making higher high and RSI is making lower high, it is a Short signal. But one should enter only if sees a breakout of structure downside in price. You shouldn’t enter just because of this method. A combination of different trading strategies have higher chances for a trade to end up in profit.
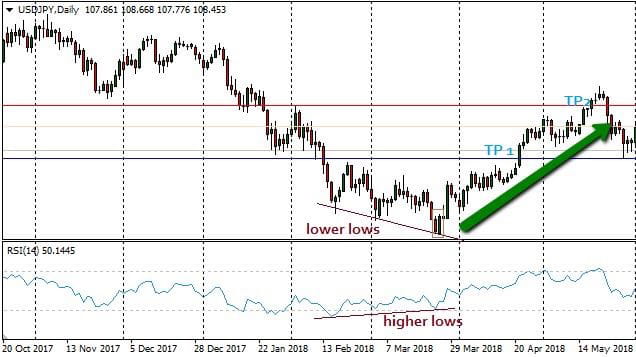
(2) If the Price is making lower low and RSI is making higher low, it a Long signal but only if you see a trendline or structural breakout upside.
3. Volume-
If the Price is rising but there a decrease in volume, the price might decline in future.
If the Price and Volume both are rising simultaneously, it indicates that the market is in strong uptrend and price might go higher in future.
If the Price is falling but volume is rising, it can be a indication that market is in accumulating phase and it hasn’t reflected in Price yet but there can be an increase in price in future.
If the Price and Volume both are decline, it shows that market is weak at the moment and price might go down further.