
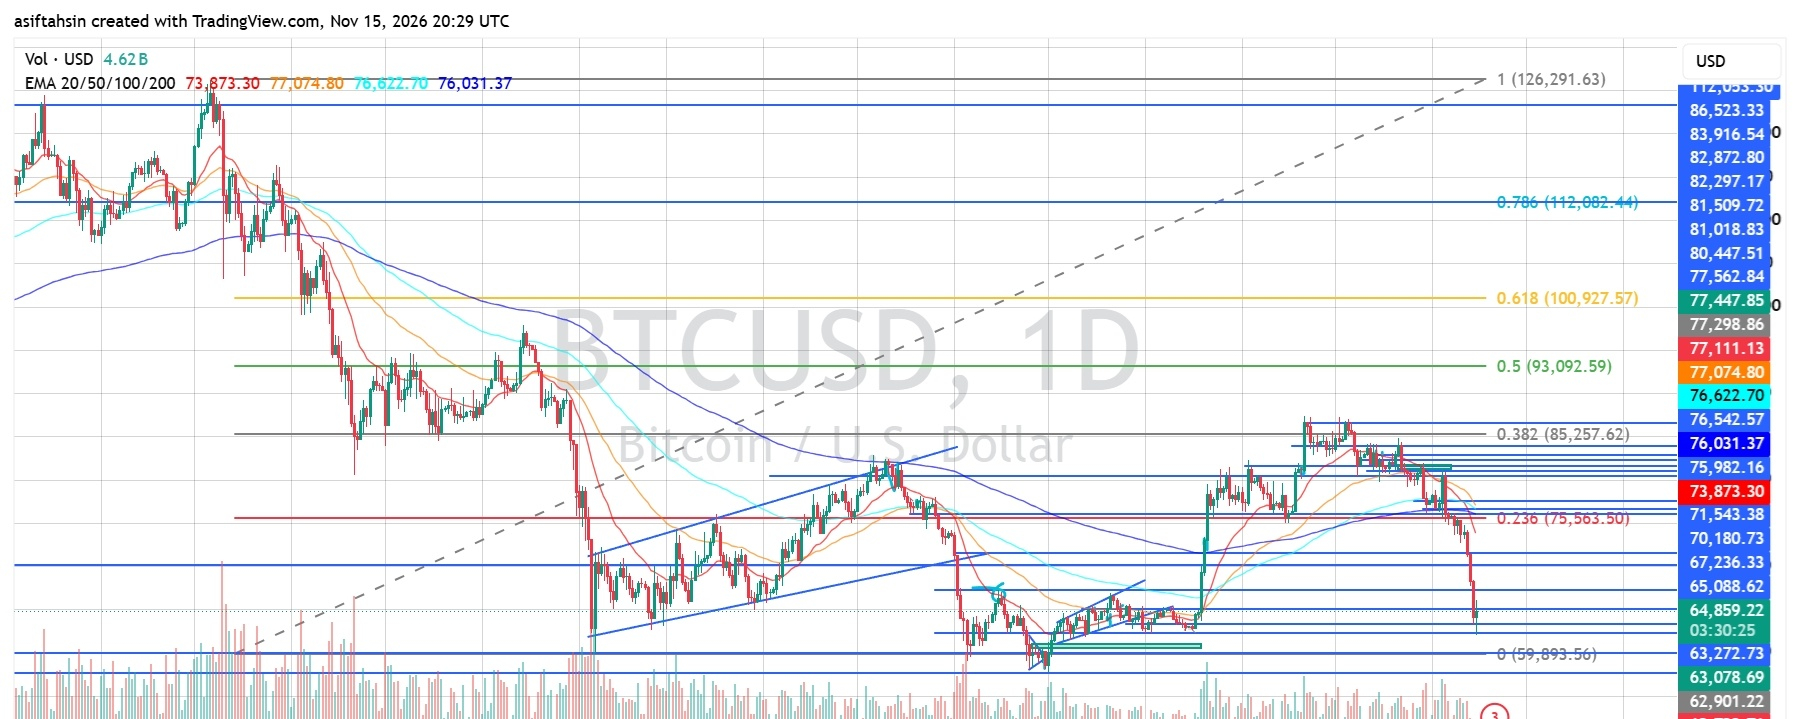

Bitcoin is currently trading around $64,859–$64,882, following a sharp sell-off from the recent October recovery high near $86,500. BTC has broken below several important support zones and is now approaching the $63,000–$65,000 demand area.
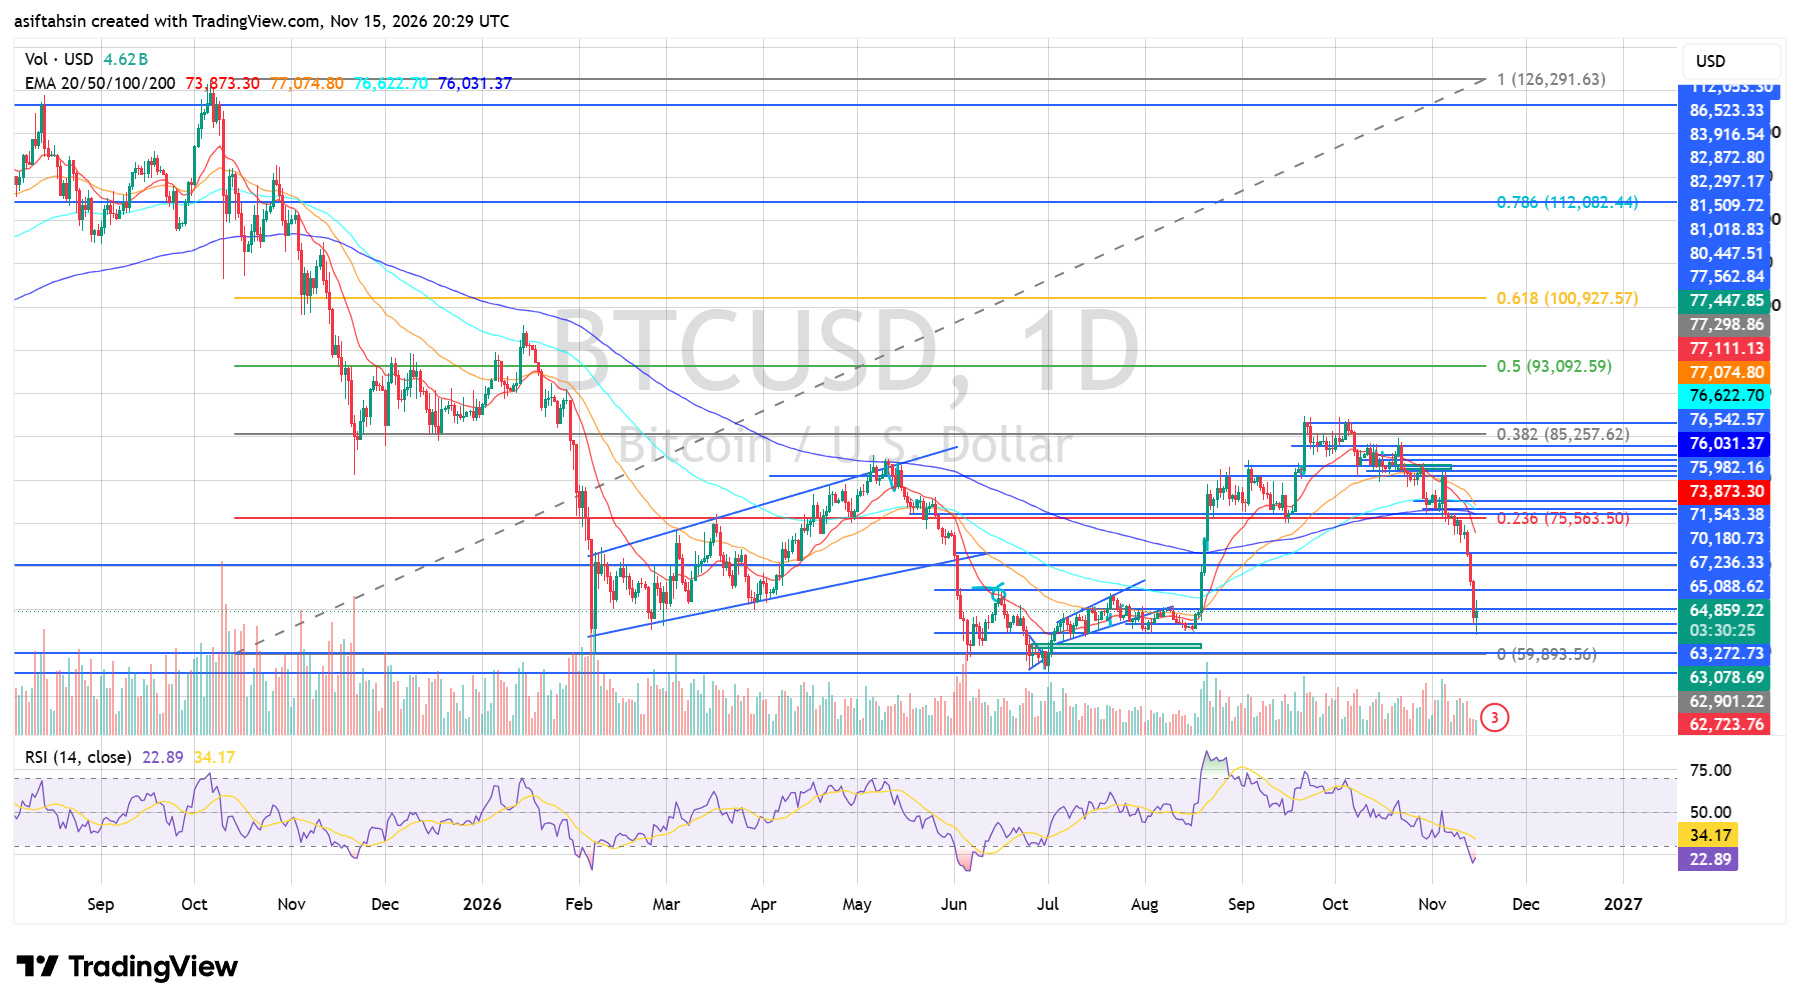
The daily market structure remains strongly bearish. Price is trading below all four major EMAs, while RSI has dropped to 22.89, indicating deeply oversold conditions. Although a relief bounce is possible, buyers need to reclaim important resistance levels before a meaningful recovery can develop.
EMA Structure
BTC is trading below all four major exponential moving averages:
- 20 EMA: $73,875.49
- 50 EMA: $77,075.70
- 100 EMA: $76,623.15
- 200 EMA: $76,031.60
The 20 EMA is below the longer-term moving averages, while price remains significantly below the entire EMA structure.
This confirms strong bearish momentum. The $73,875 region is the first major EMA resistance, followed by the $76,031–$77,075 resistance cluster.
BTC needs to reclaim these moving averages to establish a stronger recovery structure.
Fibonacci Levels
Based on your chart:
- 0: $59,893.56
- 0.236: $75,563.50
- 0.382: $85,257.62
- 0.5: $93,092.59
- 0.618: $100,927.57
- 0.786: $112,082.44
- 1.0: $126,291.63
BTC is trading significantly below the 0.236 Fibonacci level at $75,563.50. This reflects the weakness of the current market structure.
The $59,893 area represents the broader Fibonacci baseline and an important downside reference if current support fails.
Bullish Recovery Scenario
If BTC manages to defend the $63,000–$65,000 support region and buyers return with stronger volume, a relief recovery could develop toward:
- $65,088
- $67,236
- $70,180
- $71,543
- $73,875 — 20 EMA
- $75,563 — 0.236 Fibonacci
- $76,031–$77,075 — EMA resistance zone
A sustained move above $67,236 would be an initial sign of stabilization. Reclaiming $71,543–$73,875 would provide stronger recovery confirmation.
Bearish Continuation Scenario
If BTC fails to hold the current demand zone and selling pressure continues, the next downside areas to monitor are:
- $64,000–$63,000
- $63,272
- $63,078
- $62,901
- $62,723
- $62,285
- $59,893 — Fibonacci baseline
A decisive daily close below $62,285 could increase the risk of a deeper correction toward the $59,893 region.
The $63,000 area is particularly important because losing this support could accelerate downside pressure.
RSI Momentum
- RSI: 22.89
- RSI Signal Average: 34.17
RSI has dropped deeply into oversold territory, indicating intense selling pressure.
The RSI remains significantly below its signal average, confirming that bearish momentum is still dominant.
A short-term relief bounce is possible because the market is heavily oversold. However, oversold conditions alone do not confirm a trend reversal.
A recovery above 30 would be an early sign of momentum stabilization, while a sustained move above 40–50 would provide stronger confirmation.
Market Structure & Liquidity
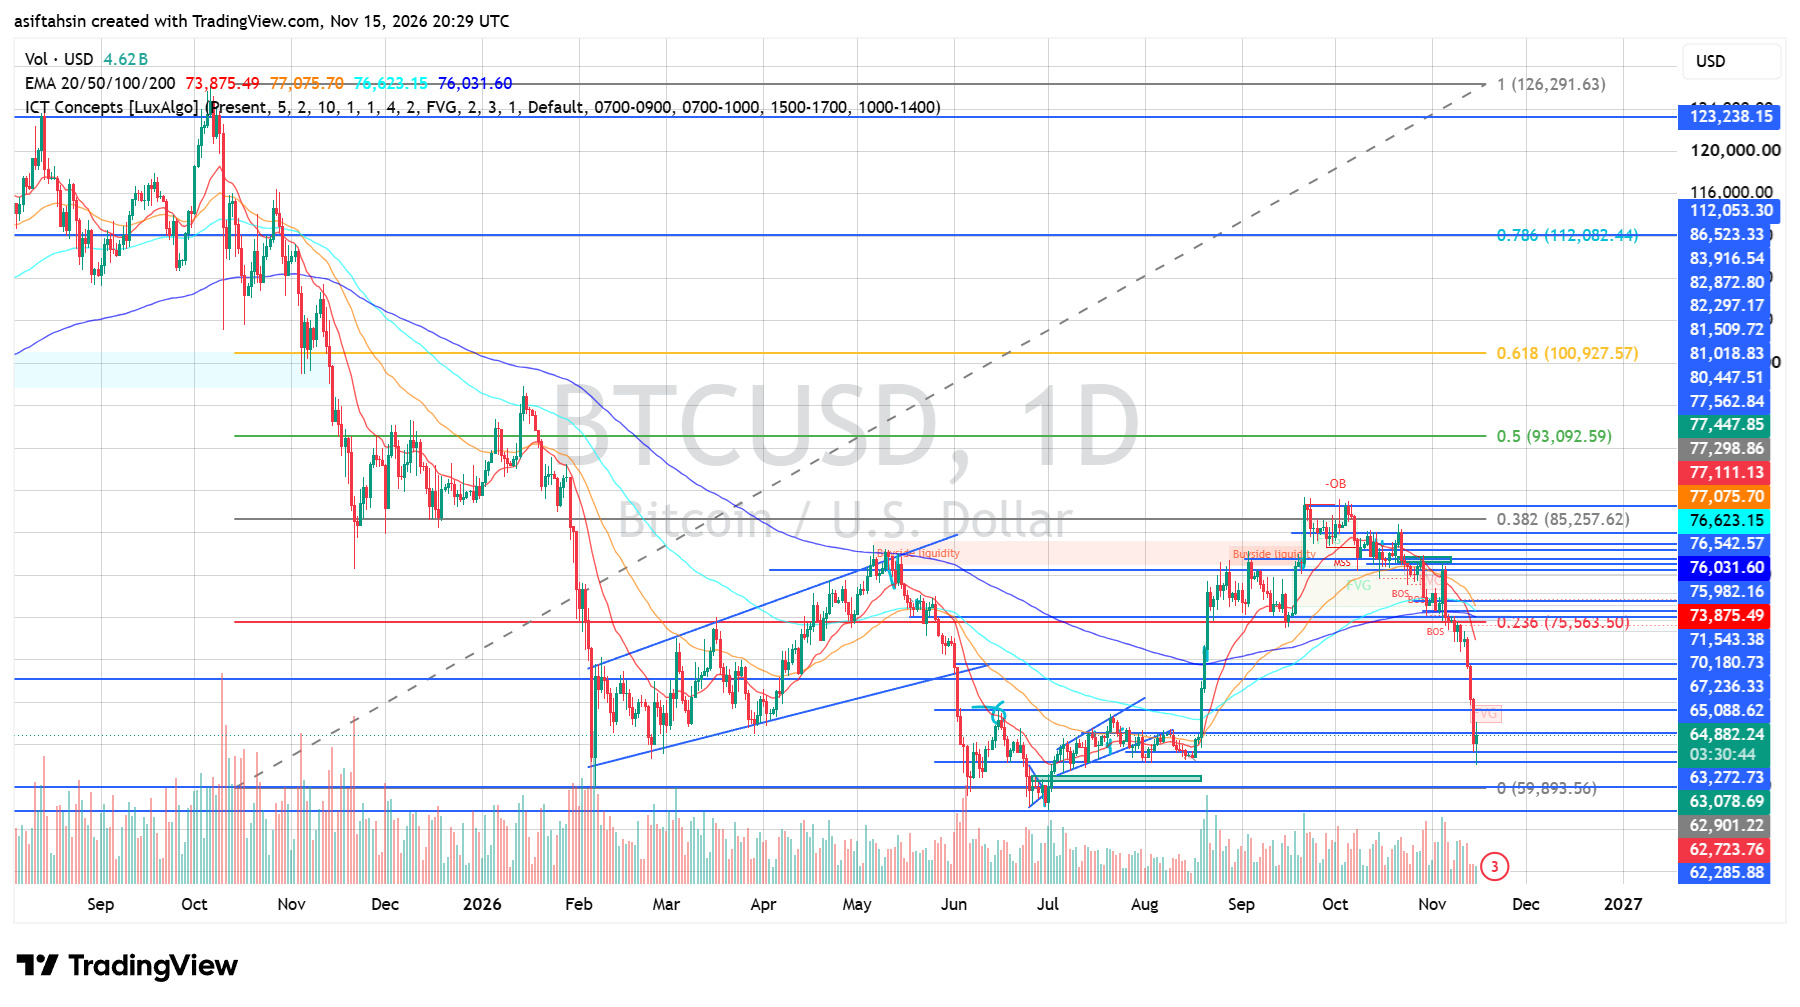
BTC previously recovered from the $62,900–$67,000 region and rallied toward the $83,000–$86,500 resistance area.
However, the latest rejection triggered a significant breakdown. Price has now moved below the $75,563 Fibonacci level and all four major EMAs.
The recent decline has weakened the broader recovery structure, with sellers maintaining control.
The immediate focus is whether buyers can defend the $63,000–$65,000 demand area. A recovery above $67,236 would be the first indication that selling pressure is beginning to ease.
Key Levels
Resistance:
- $65,088
- $67,236
- $70,180
- $71,543
- $73,875
- $75,563
- $76,031–$77,075
Support:
- $64,000–$63,000
- $63,272
- $63,078
- $62,901
- $62,723
- $62,285
- $59,893
Final Outlook
BTC remains strongly bearish on the daily timeframe while trading below all four major EMAs. RSI near 22 indicates extreme selling pressure, making a short-term relief bounce possible, but a confirmed reversal has not yet developed.
Holding the $63,000–$65,000 region could allow a recovery toward $67,236, followed by $70,180 and $71,543.
However, losing $62,285 could expose BTC to further downside toward the $59,893 Fibonacci baseline.
For a stronger recovery, BTC needs to reclaim $71,543–$73,875 first, followed by the broader EMA resistance zone around $76,000–$77,000.
Current Bias: Bearish below $67,236 | Recovery confirmation above $71,543–$73,875 | Further downside risk below $62,285.
