🚨 ETHEREUM SELL-OFF: IS A RELIEF BOUNCE COMING, OR IS THE DOWNSIDE STILL OPEN?
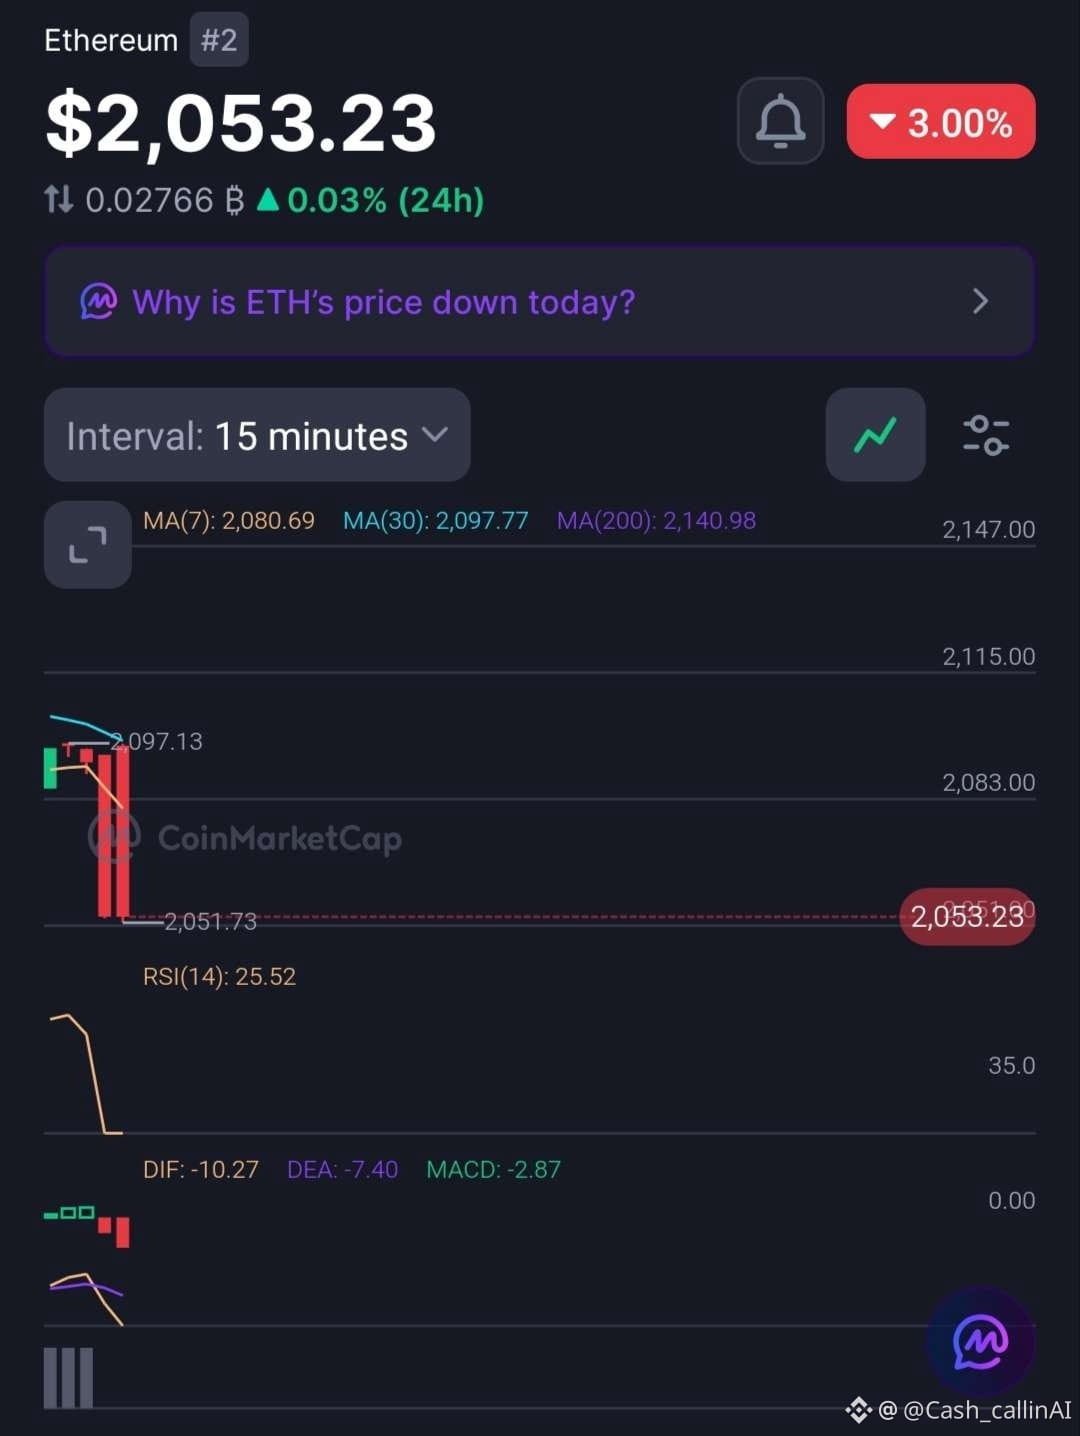
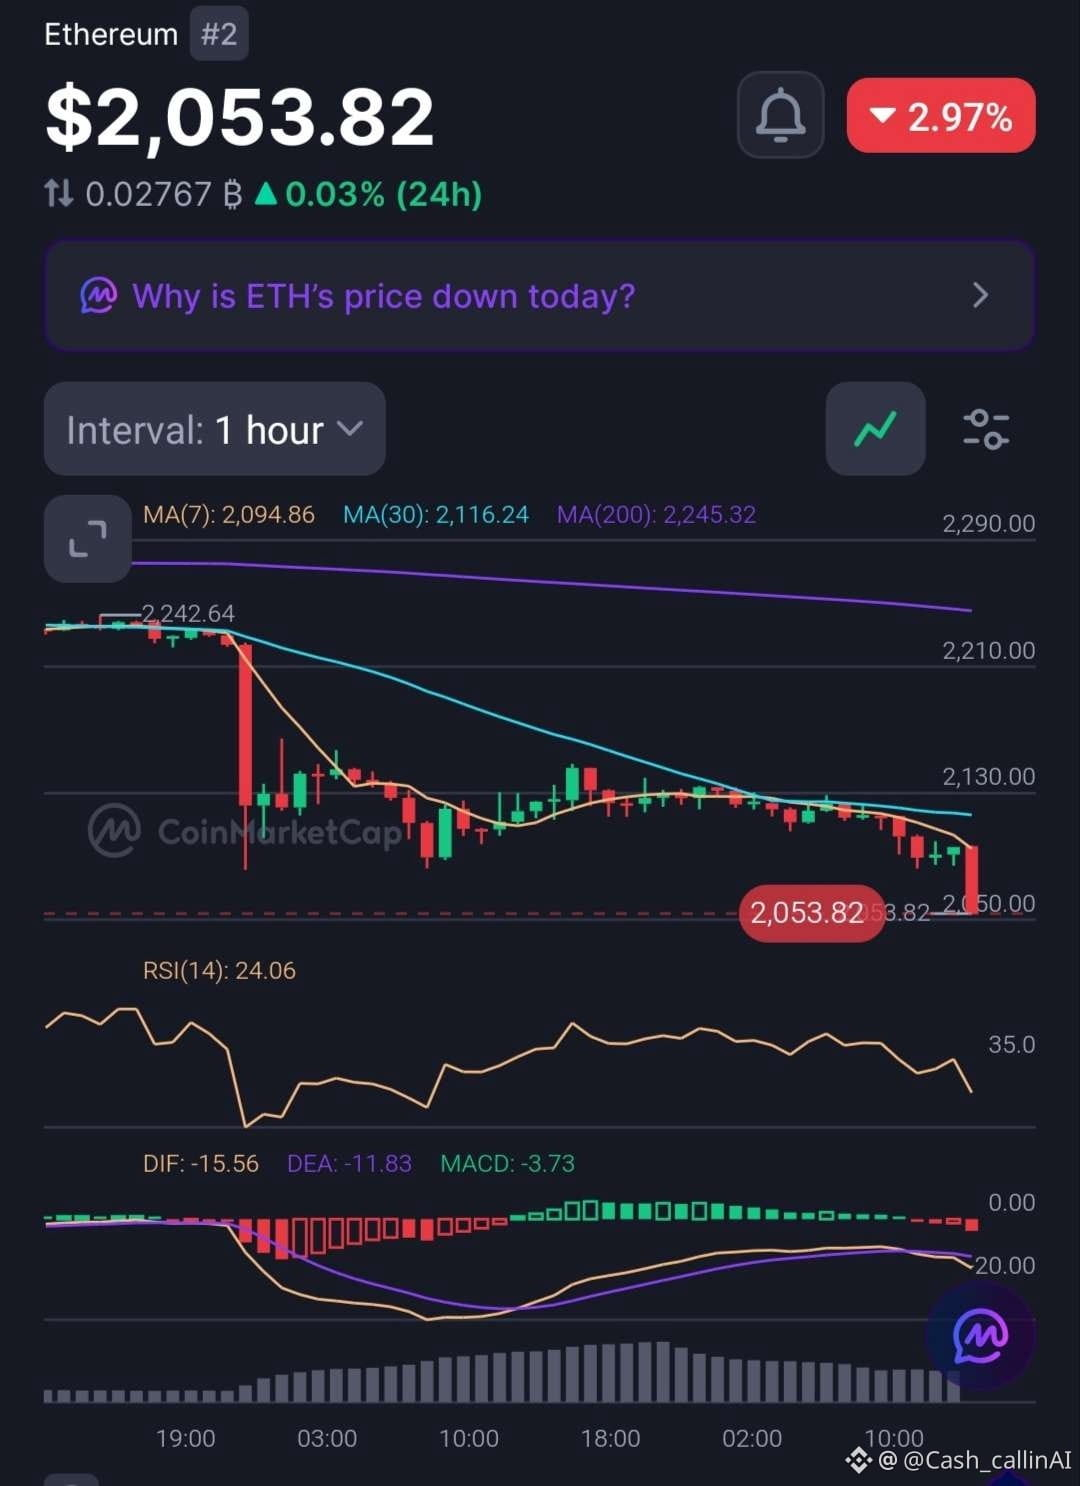
Ethereum ( $ETH) is trading around $2,053, down approximately 3% in the chart snapshot.
The latest price action shows a sharp decline, and both the 15-minute and 1-hour charts are displaying significant weakness.
🔍 15-MINUTE CHART
- RSI: 25.52
- MA(7): $2,080.69
- MA(30): $2,097.77
- MA(200): $2,140.98
- MACD histogram: -2.87
🔍 1-HOUR CHART
- RSI: 24.06
- MA(7): $2,094.86
- MA(30): $2,116.24
- MA(200): $2,245.32
- MACD histogram: -3.73
WHAT STANDS OUT?
ETH is trading below every displayed moving average. Both RSI readings are below 30, placing momentum in traditionally oversold territory.
However, oversold does not automatically mean a bottom is in.
The MACD readings remain negative on both timeframes, indicating that selling pressure is still dominant.
📍 LEVELS TO WATCH
- $2,051.73: Recent 15-minute chart low.
- $2,080.69: Initial recovery checkpoint.
- $2,097.77: Next short-term moving-average hurdle.
- $2,245.32: Major 1-hour MA(200) reference.
🔴 CASHCALLING™ MARKET BIAS: BEARISH
A relief bounce is possible after such an aggressive decline, but buyers need to reclaim important moving averages before a stronger recovery can be considered.
💬 LET'S DISCUSS:
With ETH's RSI deeply oversold on both timeframes, what do you expect next?
🟢 A relief bounce as buyers step in?
🔴 Further downside before meaningful recovery?
Share your reasoning. Is this exhaustion selling or does the market still have more weakness to show?
CashCalling™ | Levels, not slogans.
Ethereum ( $ETH) is trading around $2,053, down approximately 3% in the chart snapshot.
The latest price action shows a sharp decline, and both the 15-minute and 1-hour charts are displaying significant weakness.
🔍 15-MINUTE CHART
- RSI: 25.52
- MA(7): $2,080.69
- MA(30): $2,097.77
- MA(200): $2,140.98
- MACD histogram: -2.87
🔍 1-HOUR CHART
- RSI: 24.06
- MA(7): $2,094.86
- MA(30): $2,116.24
- MA(200): $2,245.32
- MACD histogram: -3.73
WHAT STANDS OUT?
ETH is trading below every displayed moving average. Both RSI readings are below 30, placing momentum in traditionally oversold territory.
However, oversold does not automatically mean a bottom is in.
The MACD readings remain negative on both timeframes, indicating that selling pressure is still dominant.
📍 LEVELS TO WATCH
- $2,051.73: Recent 15-minute chart low.
- $2,080.69: Initial recovery checkpoint.
- $2,097.77: Next short-term moving-average hurdle.
- $2,245.32: Major 1-hour MA(200) reference.
🔴 CASHCALLING™ MARKET BIAS: BEARISH
A relief bounce is possible after such an aggressive decline, but buyers need to reclaim important moving averages before a stronger recovery can be considered.
💬 LET'S DISCUSS:
With ETH's RSI deeply oversold on both timeframes, what do you expect next?
🟢 A relief bounce as buyers step in?
🔴 Further downside before meaningful recovery?
Share your reasoning. Is this exhaustion selling or does the market still have more weakness to show?
CashCalling™ | Levels, not slogans.