$ETH: Burst Size vs Persistent Flow
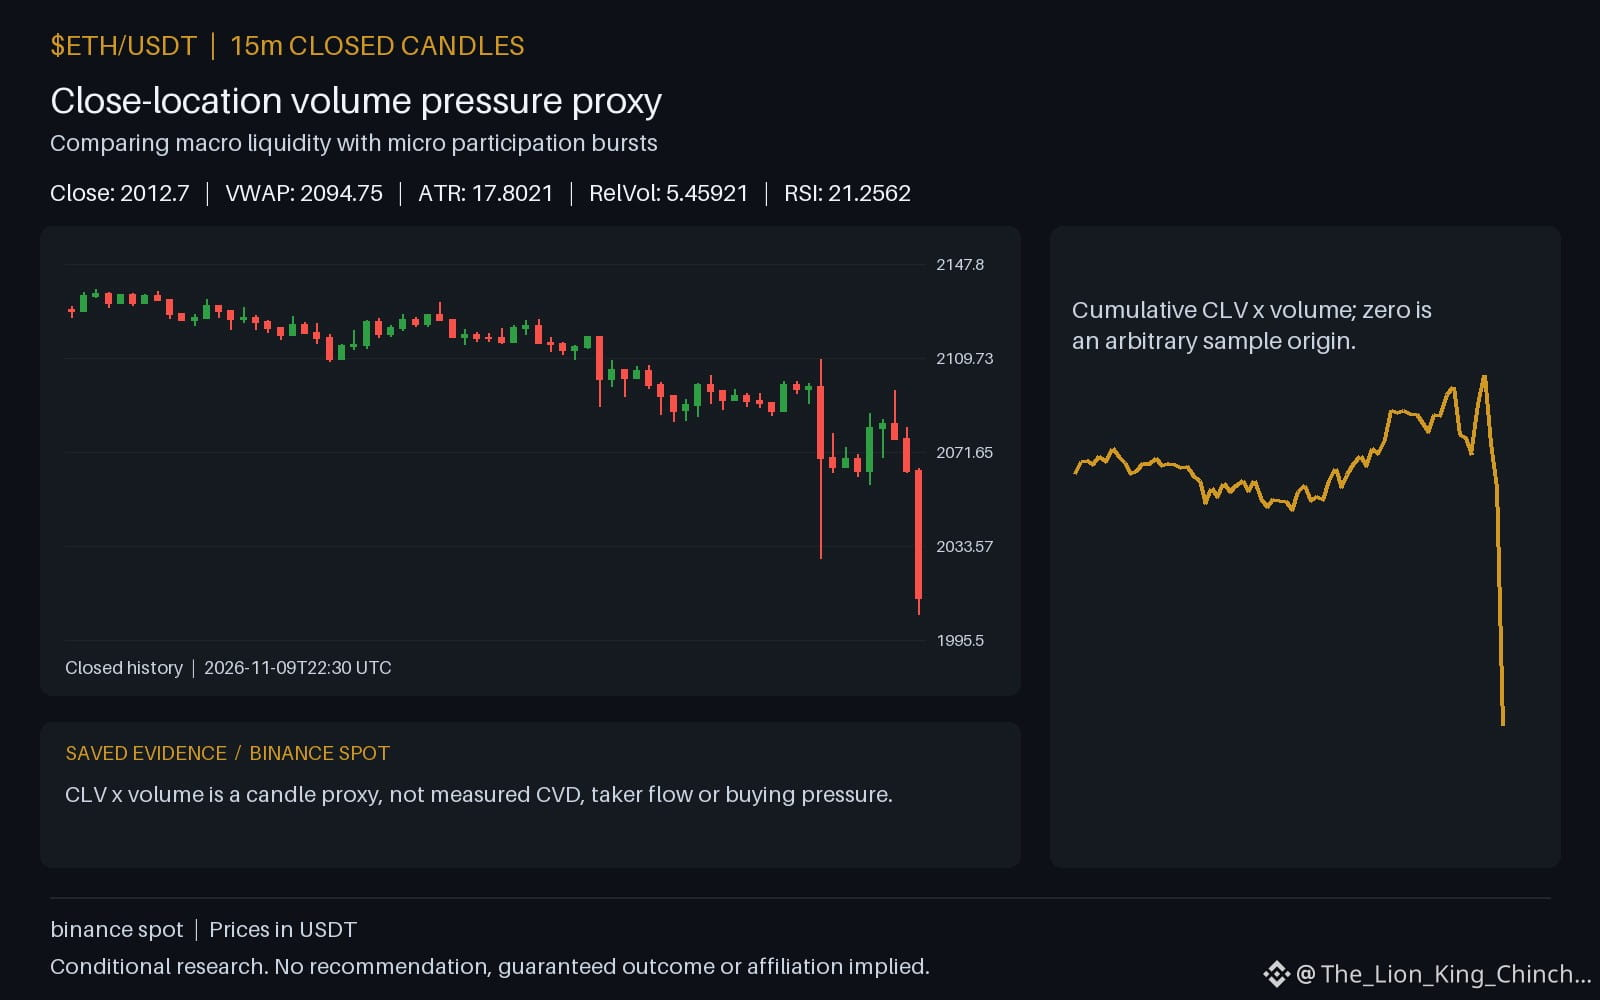
How do you distinct a single hourly spike from a sustained daily shift in participation? This question frames the research on $ETH . Current data shows volume above baseline with price below support. A common assumption is that any volume surge reflects broad consensus. The clue here is the mismatch between the scale of the burst and the surrounding activity.
An alternative reading treats the spike as a micro event. In a hypothetical mechanism, macro liquidity represents steady state. A micro burst is a temporary deviation. If only one hourly bar shows elevated volume while the daily change remains muted, the interpretation leans toward a fluke. The RSI at 21.2562 provides context on momentum without asserting cause. A counterexample would be a series of consecutive hourly bars with similar volume levels. That pattern weakens the fluke interpretation and suggests a structural shift in participation.
What could change the reading? Sustained movement relative to the 2077.64 and 2095.41 over time. If price reclaims those levels with consistent volume across multiple timeframes, the micro burst narrative loses weight. Conversely, if volume normalizes after one hour, the initial spike was likely isolated. This research does not claim actual trader motives or order flow mechanics. It explores a logical distinction between scale and duration. The limit of this analysis is that it uses only static snapshots. It cannot verify future behavior. A self-check involves waiting for the next two hourly candles to see if volume normalizes or persists before drawing conclusions.
Probabilistic market research, not a recommendation or guaranteed return.
How do you distinguish between a one-candle volume fluke and a genuine all-day shift in market participation?
#ETH #MarketAnalysis #CryptoLearning
How do you distinct a single hourly spike from a sustained daily shift in participation? This question frames the research on $ETH . Current data shows volume above baseline with price below support. A common assumption is that any volume surge reflects broad consensus. The clue here is the mismatch between the scale of the burst and the surrounding activity.
An alternative reading treats the spike as a micro event. In a hypothetical mechanism, macro liquidity represents steady state. A micro burst is a temporary deviation. If only one hourly bar shows elevated volume while the daily change remains muted, the interpretation leans toward a fluke. The RSI at 21.2562 provides context on momentum without asserting cause. A counterexample would be a series of consecutive hourly bars with similar volume levels. That pattern weakens the fluke interpretation and suggests a structural shift in participation.
What could change the reading? Sustained movement relative to the 2077.64 and 2095.41 over time. If price reclaims those levels with consistent volume across multiple timeframes, the micro burst narrative loses weight. Conversely, if volume normalizes after one hour, the initial spike was likely isolated. This research does not claim actual trader motives or order flow mechanics. It explores a logical distinction between scale and duration. The limit of this analysis is that it uses only static snapshots. It cannot verify future behavior. A self-check involves waiting for the next two hourly candles to see if volume normalizes or persists before drawing conclusions.
Probabilistic market research, not a recommendation or guaranteed return.
How do you distinguish between a one-candle volume fluke and a genuine all-day shift in market participation?
#ETH #MarketAnalysis #CryptoLearning