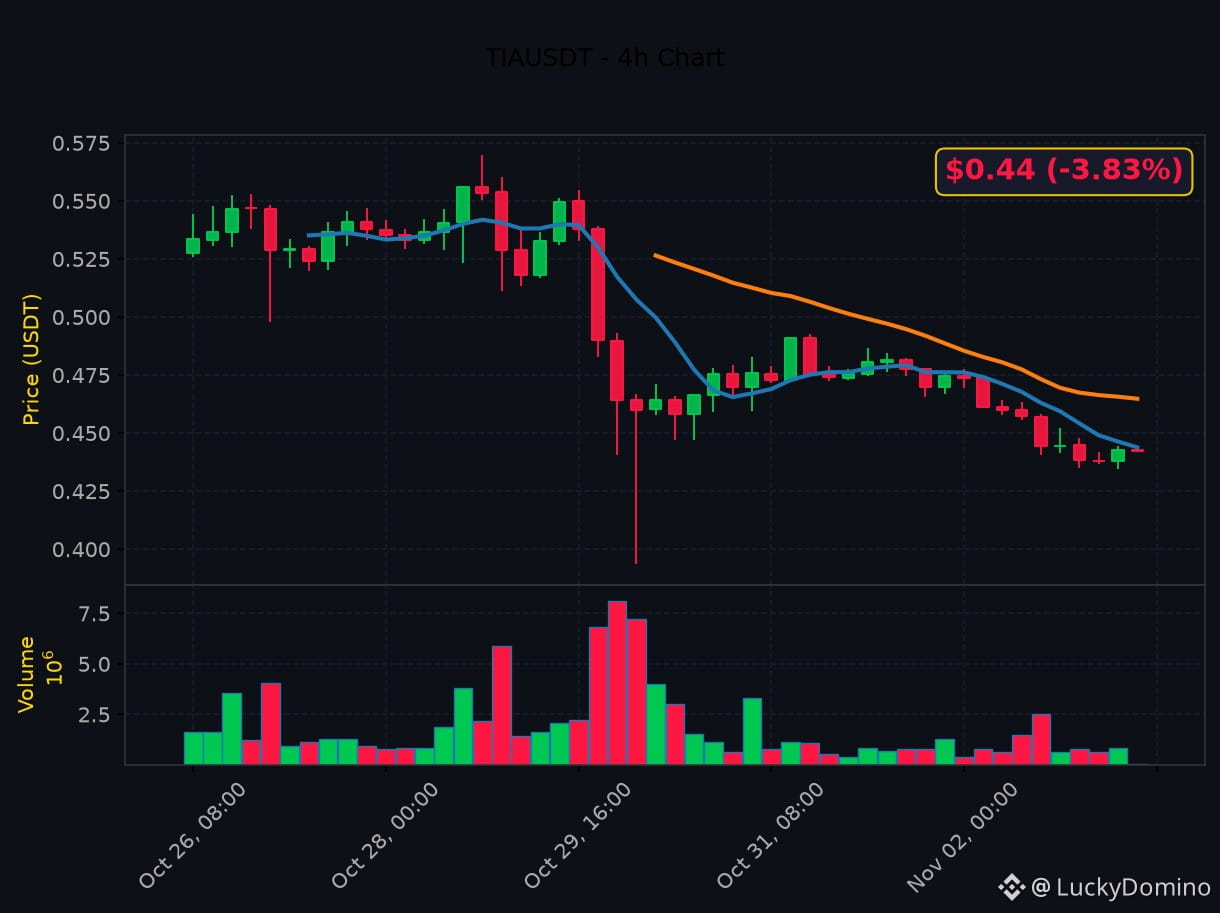
🔴 TIA bleeding -3.83%. Time to panic or time to plan?
🔥 $TIA Technical Analysis
📊 Current: $0.44 (-3.83%)
📈 24h Range: $0.43 - $0.46 (6.6% range)
🎯 Key Indicators:
• RSI(14): 17.4 — oversold - reversal opportunity
• MACD bearish crossover, histogram negative - selling pressure
• Price in strong downtrend. EMA20 ($0.46) vs EMA50 ($0.49) = bearish bias.
📉 Volume & Volatility:
• High volatility
• 24h Volume: 6,947,228 TIA
💡 Trade Setup:
• Short bias below $0.46 (EMA20)
• Target: $0.46 | Stop: $0.43
What's your play on $TIA? Drop it below 👇
$TIA $INJ
#TIA #CryptoTrading #TechnicalAnalysis
🔥 $TIA Technical Analysis
📊 Current: $0.44 (-3.83%)
📈 24h Range: $0.43 - $0.46 (6.6% range)
🎯 Key Indicators:
• RSI(14): 17.4 — oversold - reversal opportunity
• MACD bearish crossover, histogram negative - selling pressure
• Price in strong downtrend. EMA20 ($0.46) vs EMA50 ($0.49) = bearish bias.
📉 Volume & Volatility:
• High volatility
• 24h Volume: 6,947,228 TIA
💡 Trade Setup:
• Short bias below $0.46 (EMA20)
• Target: $0.46 | Stop: $0.43
What's your play on $TIA? Drop it below 👇
$TIA $INJ
#TIA #CryptoTrading #TechnicalAnalysis