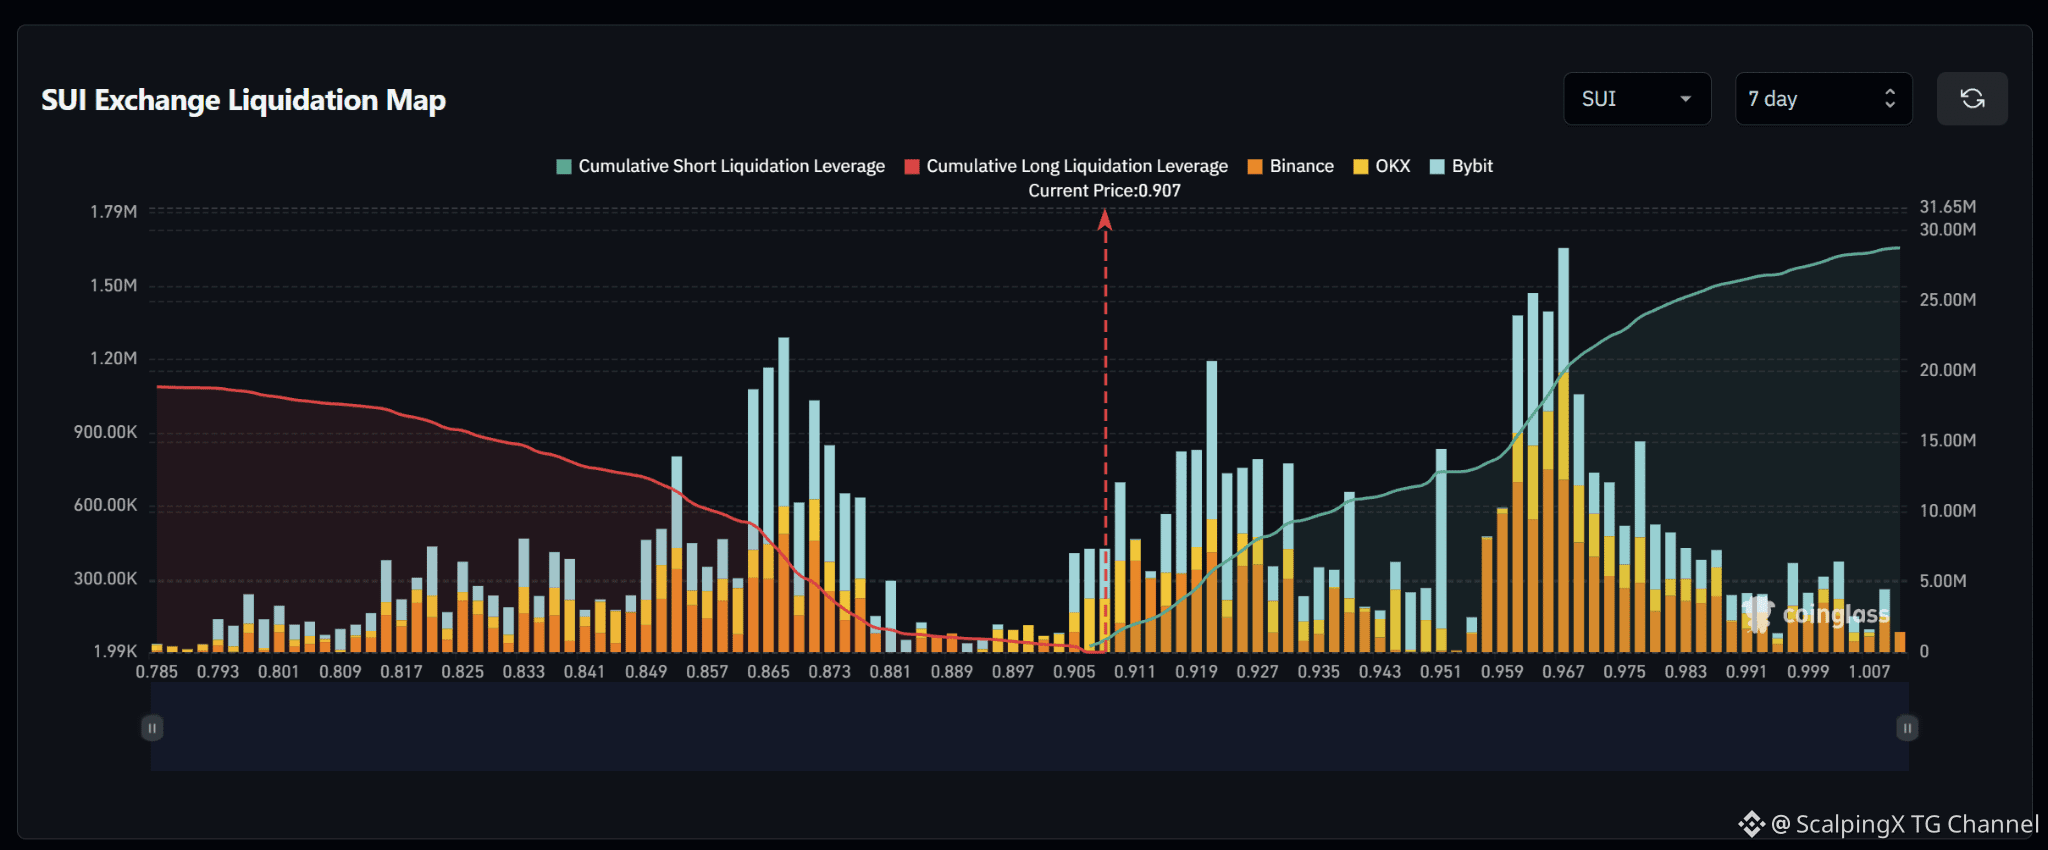
$SUI – Liquidation Map (7 days) – Index ~0.907
🧭 The map favors an upside short sweep. Estimated cumulative short liquidation exposure is roughly $29M, versus nearly $19M on the long side across the displayed range. Nearby short clusters are more pronounced, while the major long cluster sits farther away at 0.863–0.875.
🔺 The initial target is 0.909–0.913. A break and hold above 0.913 shifts attention to 0.917–0.929, particularly near 0.921. Short liquidations within this band could amplify the advance.
🎯 Holding above 0.929 after a sweep brings 0.943–0.951 into focus. Farther above sits the large short band at 0.959–0.975, concentrated around 0.961–0.967. The reaction there will help assess continuation.
⚖️ Losing 0.903 without a reclaim weakens the upside bias. Long exposure is relatively thin through 0.881–0.901 before the major cluster at 0.863–0.875. Avoid chasing a sweep of 0.917–0.929 that quickly falls back below 0.917.
#LiquidationMap