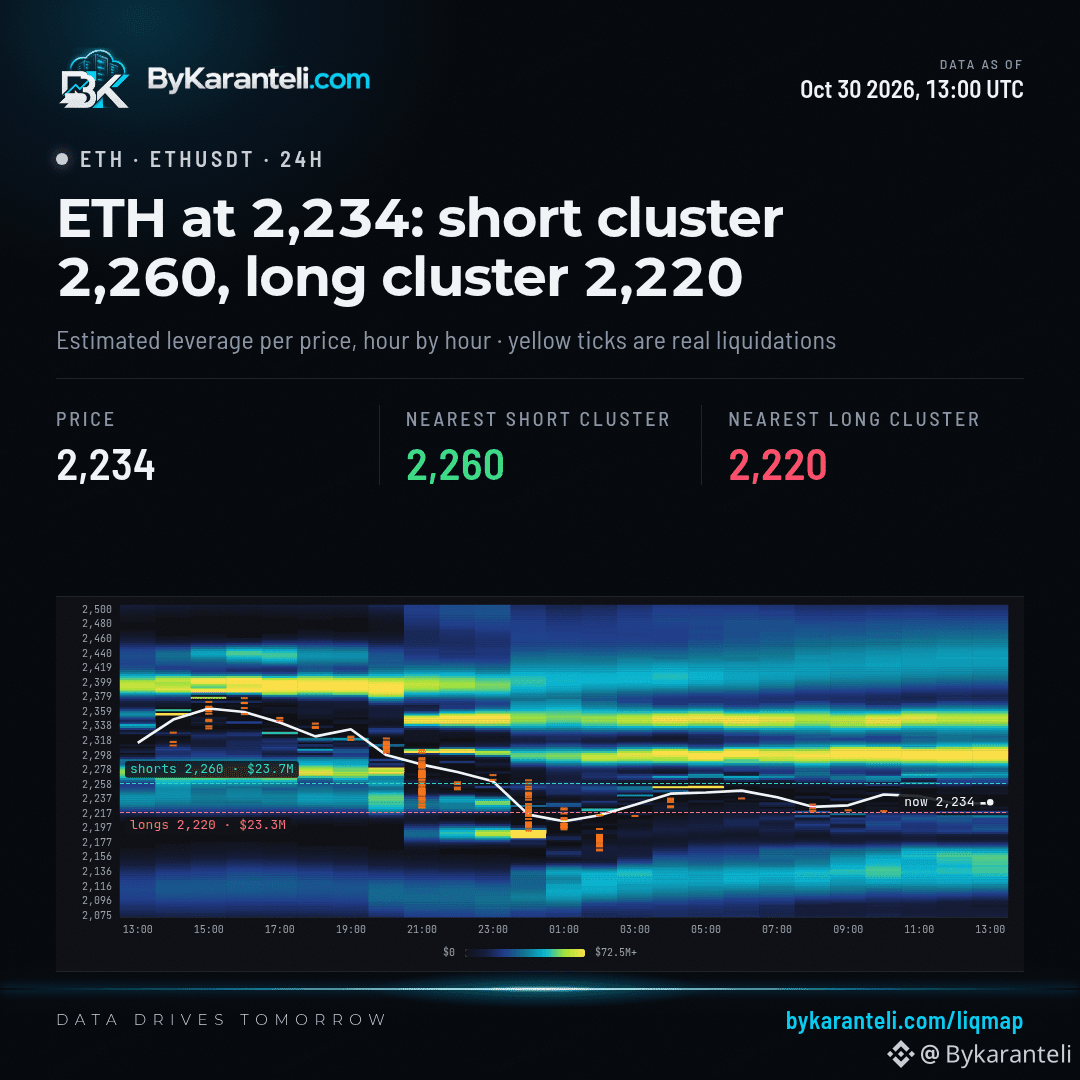
On Oct 30 at 13:00 UTC, Ether's estimated liquidation map tilts toward traders betting on a rise. Within 3% of the $2,234 price, more modeled exposure sits below price, on long positions, than above it on shorts.
The closest modeled long level is $2,220, where leveraged buyers would start being forced out. A larger modeled long cluster sits further down at $2,156.
Above price, the nearest modeled short level is $2,260, and the largest short cluster is at $2,301. Those are where traders betting on a fall would be forced to buy back. All levels are estimates built from open interest and leverage, not recorded liquidations.