

Pair: DUSK/USDT (Dusk Network) Perpetual | Timeframe: 1H | Exchange: Binance | Chart date: Oct 14–15, 2026 (UTC)
Market Overview
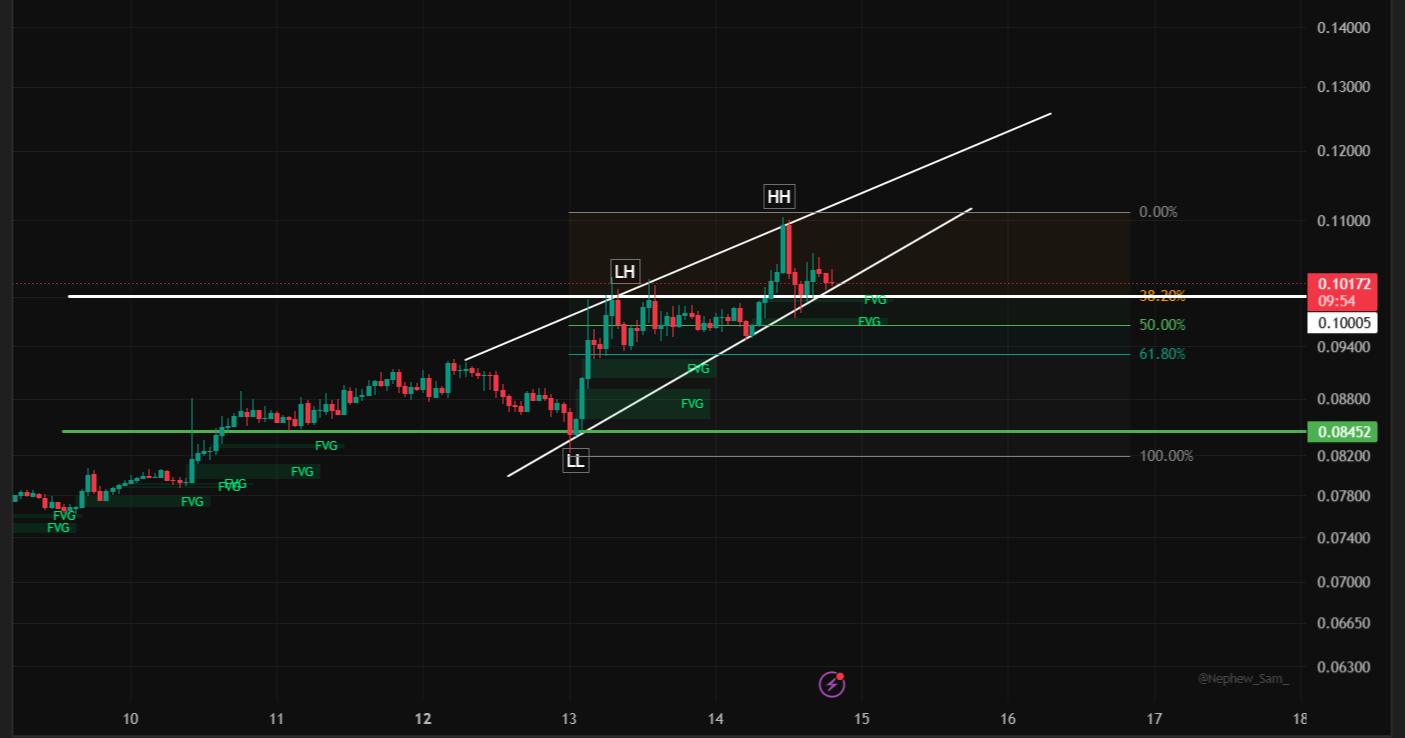
DUSK/USDT is trading around 0.10210, holding steady inside a strong, well-defined uptrend. Price has been climbing in clean steps since bottoming near 0.0780 several days ago, breaking a sequence of lower highs (LH) and most recently printing a sharp higher high (HH) near 0.1035 after bouncing off a higher low (LL) at roughly 0.0845. Each leg higher has left behind a Fair Value Gap (FVG), creating a visible "staircase" of unfilled support zones all the way down the chart — a sign of persistent, structured buying rather than a single speculative spike.
Price has since pulled back modestly from the HH and is now consolidating right around the 38.2% Fibonacci retracement of the latest impulsive leg.
Key Observations From the Chart
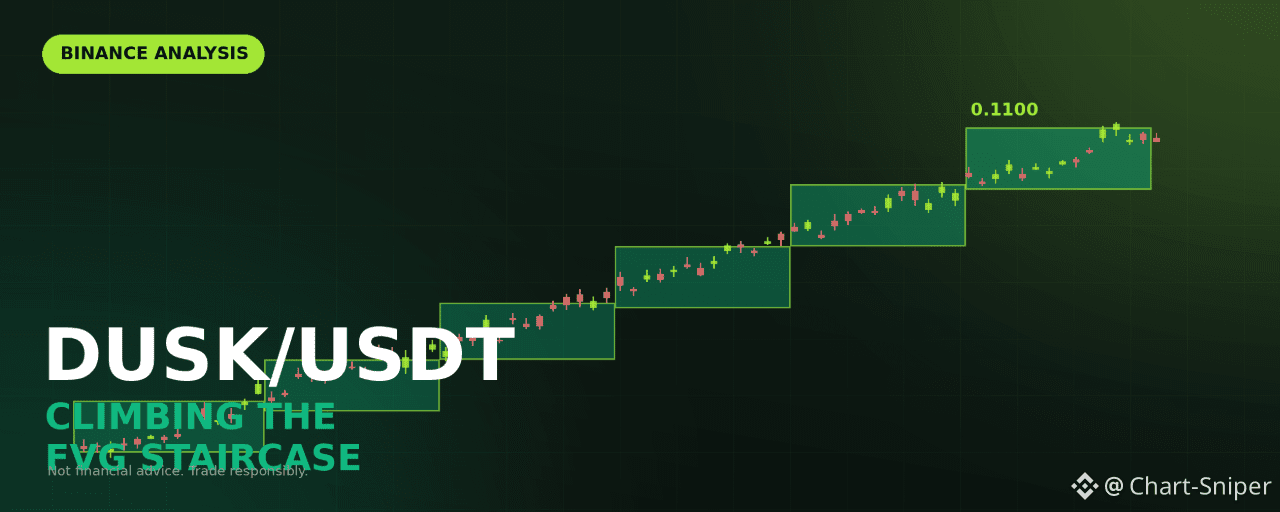
1. Strong uptrend with stacked FVGs. Nearly every leg up has left an FVG behind it, and price has so far respected these as support on pullbacks. This stair-step pattern is a hallmark of sustained institutional-style buying.
2. Resistance at 0.1100. This is the 0% Fibonacci anchor, just above the recent HH. A confirmed break and hold above this level would signal the uptrend has further room to run.
3. Fibonacci retracement zone. Measuring the latest impulsive swing from the LL (about 0.0845) up to the HH (about 0.1035):
38.2% sits near 0.10210 (current price)
50% sits near 0.10005
61.8% sits near 0.09400
Price trading right at the 38.2% level is a common pause point before trend continuation, provided it holds.
4. Nearby FVG support just below. There are two Fair Value Gaps stacked between roughly 0.0940 and 0.1000, directly beneath current price. These overlap closely with the 50%–61.8% Fibonacci zone, creating a strong confluence support area.
5. The macro higher low at 0.0845 is the trend's foundation. As long as price holds comfortably above this level, the broader uptrend structure remains intact.
Trade Scenarios
Scenario A: Buy the FVG/Fibonacci Confluence (Preferred)
Let price pull back into the stacked FVG and Fibonacci zone before buying, rather than chasing the current level.
Entry zone: 0.09950 to 0.09400
Stop-loss: 0.09100 (below the FVG cluster and 61.8% level)
Take-profit 1: 0.10210 (current resistance area)
Take-profit 2: 0.10350 (the HH)
Take-profit 3: 0.11000
Scale into the zone across a couple of entries, and move your stop to breakeven once TP1 is tagged.
Scenario B: Breakout Long
If price clears the recent high without a deep pullback, wait for confirmation rather than buying into resistance.
Trigger: A 1H candle close above 0.11050
Entry: On the close, or on a retest of 0.1100 as new support
Stop-loss: 0.10350
Take-profit 1: 0.11800
Take-profit 2: 0.12500
Scenario C: Bearish Invalidation
If price breaks down through the FVG support cluster and the macro higher low, the uptrend is likely over.
Trigger: 1H close below 0.08800
Short entry: On a retest of 0.08800–0.08900 from below
Stop-loss: 0.09350
Take-profit 1: 0.08450 (prior major support)
Take-profit 2: 0.08000
Take-profit 3: 0.07600
Risk Management Tips
Risk only 1% to 2% of your account per trade.
DUSK has shown a sharp impulsive HH candle — keep leverage conservative (3x to 5x at most).
Avoid entering in the middle of the range (0.1005 to 0.1020), where risk/reward is weak in both directions.
Always set your stop-loss the moment you open a position.
Watch Bitcoin and overall market sentiment — a strong altcoin uptrend can still stall quickly if the broader market turns risk-off.
Conclusion
DUSK/USDT remains in a healthy, well-structured uptrend, with layered Fair Value Gaps acting as a support staircase all the way up the chart. A pullback into the 0.094–0.0995 confluence zone followed by renewed strength keeps the bullish case intact toward 0.1100 and beyond, while a break below the 0.0845 higher low would be the clearest signal the trend has reversed. Let the chart confirm before committing size.
Disclaimer: This article is for educational and informational purposes only and is not financial advice. Cryptocurrency and derivatives trading carry a high risk of loss, and you can lose more than you expect, especially with leverage. Entry, stop-loss and target levels are based on chart analysis and are not guaranteed. Always do your own research and only trade with money you can afford to lose.
@Binance Square Official #CPIWatch #EthereumDropsBelow$2500 #StriveBuys3311BTCFor$280M #BINANCE #ChartSniper