

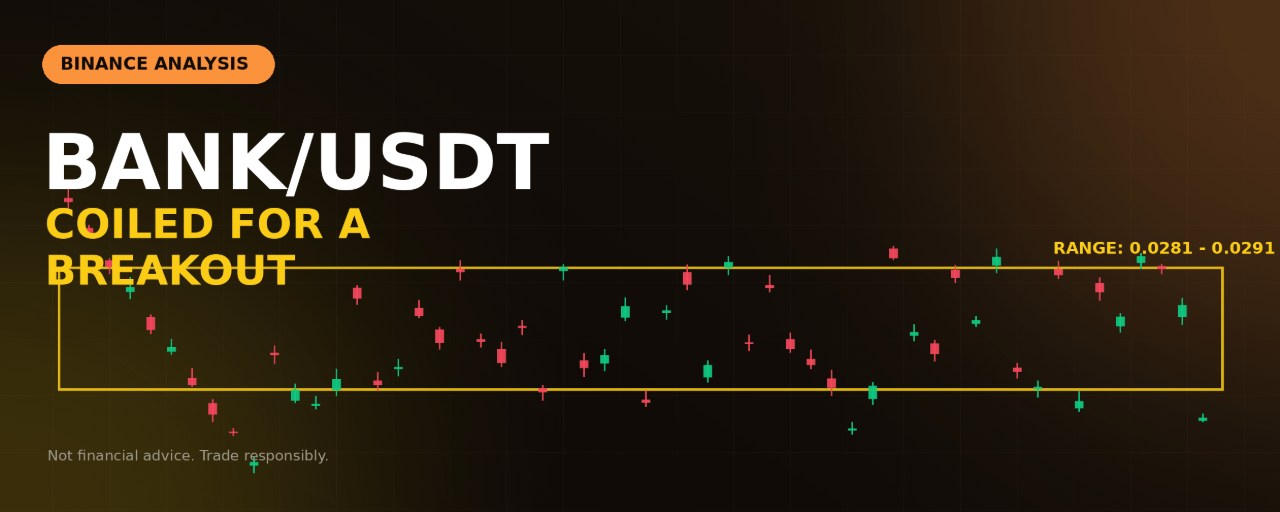


Pair: $BANK USDT Perpetual | Timeframe: 1H | Exchange: Binance | Chart date: Oct 9–10, 2026 (UTC)
Market Overview
BANK/USDT is trading around 0.02848, consolidating tightly after a sharp decline and recovery. Price fell hard from a higher high near 0.0293 down to a lower low (LL) around 0.0266, before buyers stepped back in and pushed the pair back up along a clean ascending trendline. For the past several hours, price has been coiling inside a horizontal range, printing a lower high (LH) just under the top of that range — a sign the move up is losing some steam even as the broader structure stays constructive.
Volume has also cooled off noticeably since the initial spike down, which is typical of a consolidation phase building energy for the next directional move.
Key Observations From the Chart
1. Range-bound after a strong recovery. Since reclaiming the 0.0281 area, price has been trading inside a tight box roughly between 0.0281 and 0.0291. A break of either side of this range is likely to define the next move.
2. Resistance at 0.0291–0.0293. This is the top of the range and the prior high. The LH print just below this zone shows sellers are still active here.
3. Fibonacci retracement zone. Measuring the drop from the high (about 0.0293) down to the LL (about 0.0266):
38.2% sits near 0.0281
50% sits near 0.0279
61.8% sits near 0.0276
Price is currently trading just above the 38.2% level, which has acted as support during the recent consolidation.
4. The ascending trendline is the dynamic support to watch. The steep recovery trendline from the LL is still intact. A break below it, combined with a close under 0.0281, would weaken the bullish case.
5. Falling volume inside the range. Lower volume during consolidation is normal, but it also means the eventual breakout (in either direction) is likely to come with a volume expansion — worth watching for confirmation.
Trade Scenarios
Scenario A: Buy the Range Support (Preferred)
Buy a reaction off the lower half of the range, in line with the Fibonacci zone and the rising trendline.
Entry zone: 0.02810 to 0.02770
Stop-loss: 0.02720 (below the 61.8% level and trendline support)
Take-profit 1: 0.02880
Take-profit 2: 0.02930 (range high / resistance)
Take-profit 3: 0.03000
Scale into the zone rather than entering all at once, and move your stop to breakeven once TP1 is tagged.
Scenario B: Breakout Long
If buyers clear the top of the range with conviction, wait for confirmation rather than buying the first wick into resistance.
Trigger: A 1H candle close above 0.02950, ideally with rising volume
Entry: On the close, or on a retest of 0.0293 as new support
Stop-loss: 0.02830
Take-profit 1: 0.03050
Take-profit 2: 0.03150
Scenario C: Bearish Breakdown
If the range support fails, the recovery structure is likely broken and a retest of the recent low becomes probable.
Trigger: 1H close below 0.02700
Short entry: On a retest of 0.02700–0.02720 from below
Stop-loss: 0.02790
Take-profit 1: 0.02660 (the LL)
Take-profit 2: 0.02570
Take-profit 3: 0.02500
Risk Management Tips
Risk only 1% to 2% of your account per trade.
This pair has already shown one sharp, high-volume flush — keep leverage conservative (3x to 5x at most).
Avoid entering in the middle of the range (0.0282 to 0.0286), where risk/reward is weak in both directions.
Always set your stop-loss the moment you open a position, not after.
Watch for the volume spike that typically accompanies a genuine range breakout — a move on thin volume is more likely to fail.
Conclusion
BANK/USDT is consolidating inside a well-defined range after a sharp recovery from its recent low. A bounce from the Fibonacci support zone keeps the bullish recovery case alive, while a confirmed close above 0.0295 would open the door toward 0.0305–0.0315. A breakdown below 0.0270, on the other hand, would put the recent lows back in play. Let the range resolve before committing size.
Disclaimer: This article is for educational and informational purposes only and is not financial advice. Cryptocurrency and derivatives trading carry a high risk of loss, and you can lose more than you expect, especially with leverage. Entry, stop-loss and target levels are based on chart analysis and are not guaranteed. Always do your own research and only trade with money you can afford to lose.
@Binance Square Official #BitcoinReboundsTo$83K #EthereumLiquidationsHit$356M #EthereumLiquidationsHit$356M #Binance #ChartSniper