



Pair: $XAI USDT Perpetual | Timeframe: 1H | Exchange: Binance | Chart date: Oct 9–10, 2026 (UTC)
Market Overview
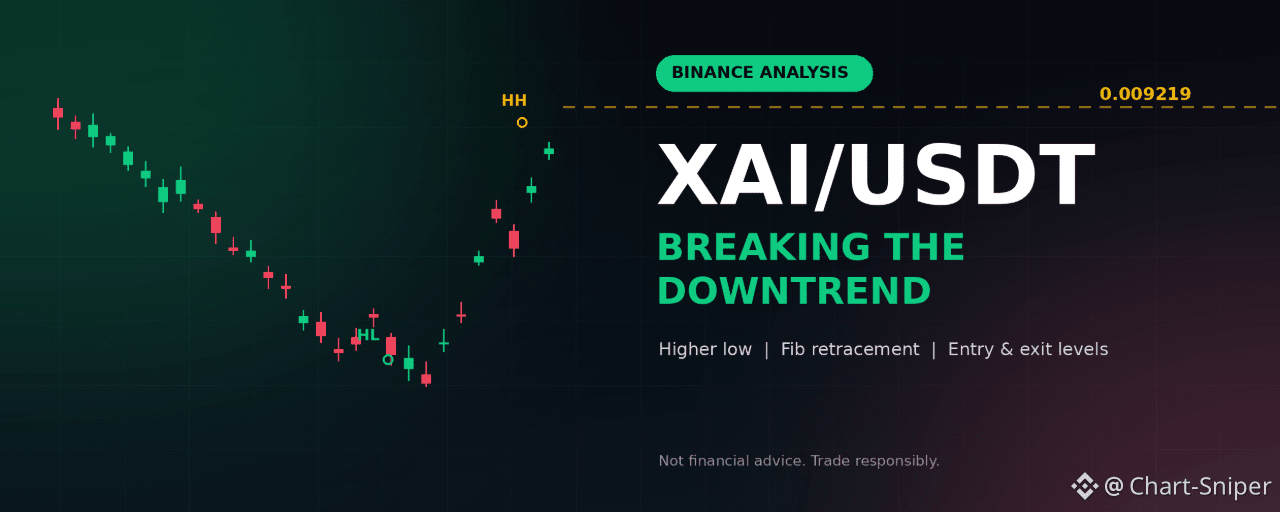
XAI/USDT is trading around 0.009038, after a sharp rebound from a swing low near 0.0083. For most of early October the pair was in a clear downtrend — lower highs and lower lows all the way from 0.0102 down to 0.0083. But the most recent swing broke that pattern: price printed a higher low (HL) around 0.0083 and then a higher high (HH) near 0.00922, the first sign of a potential structure shift from bearish to bullish.
Price has since pulled back and is now consolidating just above the 38.2% Fibonacci retracement, deciding whether this was a real reversal or just a relief bounce inside a bigger downtrend.
Key Observations From the Chart
1. Structure break in progress. The sequence LL → LH → LL → HL → HH is the textbook first step of a trend reversal. One HH alone doesn't confirm a new uptrend, but it's the first crack in an otherwise clean downtrend.
2. Resistance at 0.009219. This is the 0% Fibonacci anchor and the most recent swing high. It's the level bulls need to clear and hold above to validate the reversal.
3. Fibonacci retracement zone. Measuring the swing from the HL (about 0.0083) up to the HH (about 0.009219):
38.2% sits near 0.008858
50% sits near 0.008760
61.8% sits near 0.008632
Price is currently trading just above the 38.2% level — a pullback into the 50–61.8% zone would offer the cleanest buy-the-dip setup.
4. The HL at 0.0083 is the line in the sand. As long as price holds above this level on pullbacks, the higher-low structure stays intact. A close back below it would hand control back to the sellers.
5. Momentum shift visible on the candles. The last leg up from 0.0083 to 0.00922 was fast and nearly one-directional, suggesting aggressive buying stepped in at the lows — a sign of real demand, not just drift.
Trade Scenarios
Scenario A: Buy the Retracement (Preferred)
Let price pull back into the Fibonacci zone and buy the reaction, in line with the new higher-low structure.
Entry zone: 0.008860 to 0.008640
Stop-loss: 0.008280 (below the HL swing low)
Take-profit 1: 0.009038 (current resistance / recent consolidation)
Take-profit 2: 0.009219 (swing high)
Take-profit 3: 0.009500
Scale in across the zone rather than entering all at once, and move your stop to breakeven once TP1 is tagged.
Scenario B: Breakout Long
If buyers push through resistance without a deep pullback, wait for confirmation rather than chasing the wick.
Trigger: A 1H candle close above 0.009250
Entry: On the close, or on a retest of 0.009219 as new support
Stop-loss: 0.008900
Take-profit 1: 0.009600
Take-profit 2: 0.009800
Take-profit 3: 0.010200 (prior major high)
Scenario C: Bearish Invalidation
If the higher-low structure fails, the downtrend is likely resuming.
Trigger: 1H close below 0.008280 (below the HL)
Short entry: On a retest of 0.008280–0.008300 from below
Stop-loss: 0.008550
Take-profit 1: 0.008000
Take-profit 2: 0.007730
Take-profit 3: 0.007500
Risk Management Tips
Risk only 1% to 2% of your account per trade.
This pair is showing fast, wide-ranging candles — keep leverage conservative (3x to 5x at most).
Avoid entering in the middle of the range (0.0089 to 0.0091), where risk/reward is weak in both directions.
Set your stop-loss the moment you open the trade.
Watch Bitcoin and overall market sentiment — a strong reversal attempt in an altcoin can still fail if the broader market turns risk-off.
Conclusion
XAI/USDT has just shown its first higher high after a multi-day downtrend, and the 0.009219 resistance is now the key test. A clean pullback into the 0.0086–0.0089 zone followed by a bounce would strengthen the bullish case, while a close back below 0.0083 would undo the reversal narrative entirely. Let the chart confirm before committing size.
Disclaimer: This article is for educational and informational purposes only and is not financial advice. Cryptocurrency and derivatives trading carry a high risk of loss, and you can lose more than you expect, especially with leverage. Entry, stop-loss and target levels are based on chart analysis and are not guaranteed. Always do your own research and only trade with money you can afford to lose.
@Binance Square Official #BitcoinReboundsTo$83K #EthereumLiquidationsHit$356M #BitcoinETFsSee$244MNetOutflows #Binance #ChartSniper