


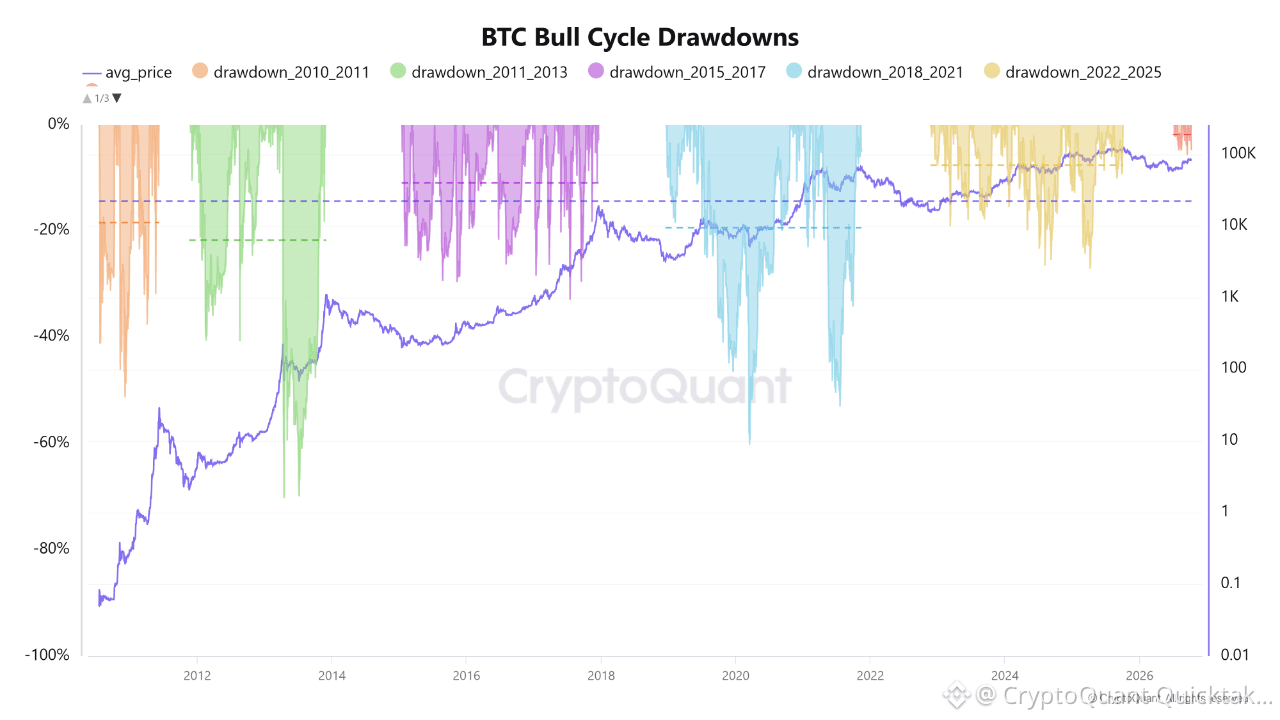
As Bitcoin undergoes a price correction, it is worth examining current price levels in the context of average drawdowns during previous bull cycles. The Bitcoin Bull Cycle Drawdowns indicator measures how much Bitcoin's price has declined from peaks formed during each bull cycle, allowing us to compare drawdowns across different cycles.
The average drawdowns from the peaks formed during each bull cycle are as follows:
ㆍ2010–2011: -18.41%
ㆍ2011–2013: -21.71%
ㆍ2015–2017: -10.93%
ㆍ2018–2021: -19.39%
ㆍ2022–2025: -7.58%
The overall average drawdown across the five previous bull cycles stands at -14.39%, although significantly deeper corrections have occurred during certain events. However, the most recent cycle experienced relatively milder drawdowns compared to previous cycles.
Bitcoin recently declined approximately 7.61%, from a high of $87,027 on October 5 to a low of $80,404 on October 9. This is comparable to the previous cycle's average drawdown of 7.58%, but remains below the historical overall average of 14.39%. Applying that historical average to the recent high gives a price level of approximately $74,500, which could serve as a reference point in the event of further downside.
Given that drawdowns have been relatively smaller in the most recent bull cycle, investors may consider gradually accumulating Bitcoin around $80,000 and increasing their buying exposure more aggressively in the $74,000–$75,000 range.
Written by MAC_D