
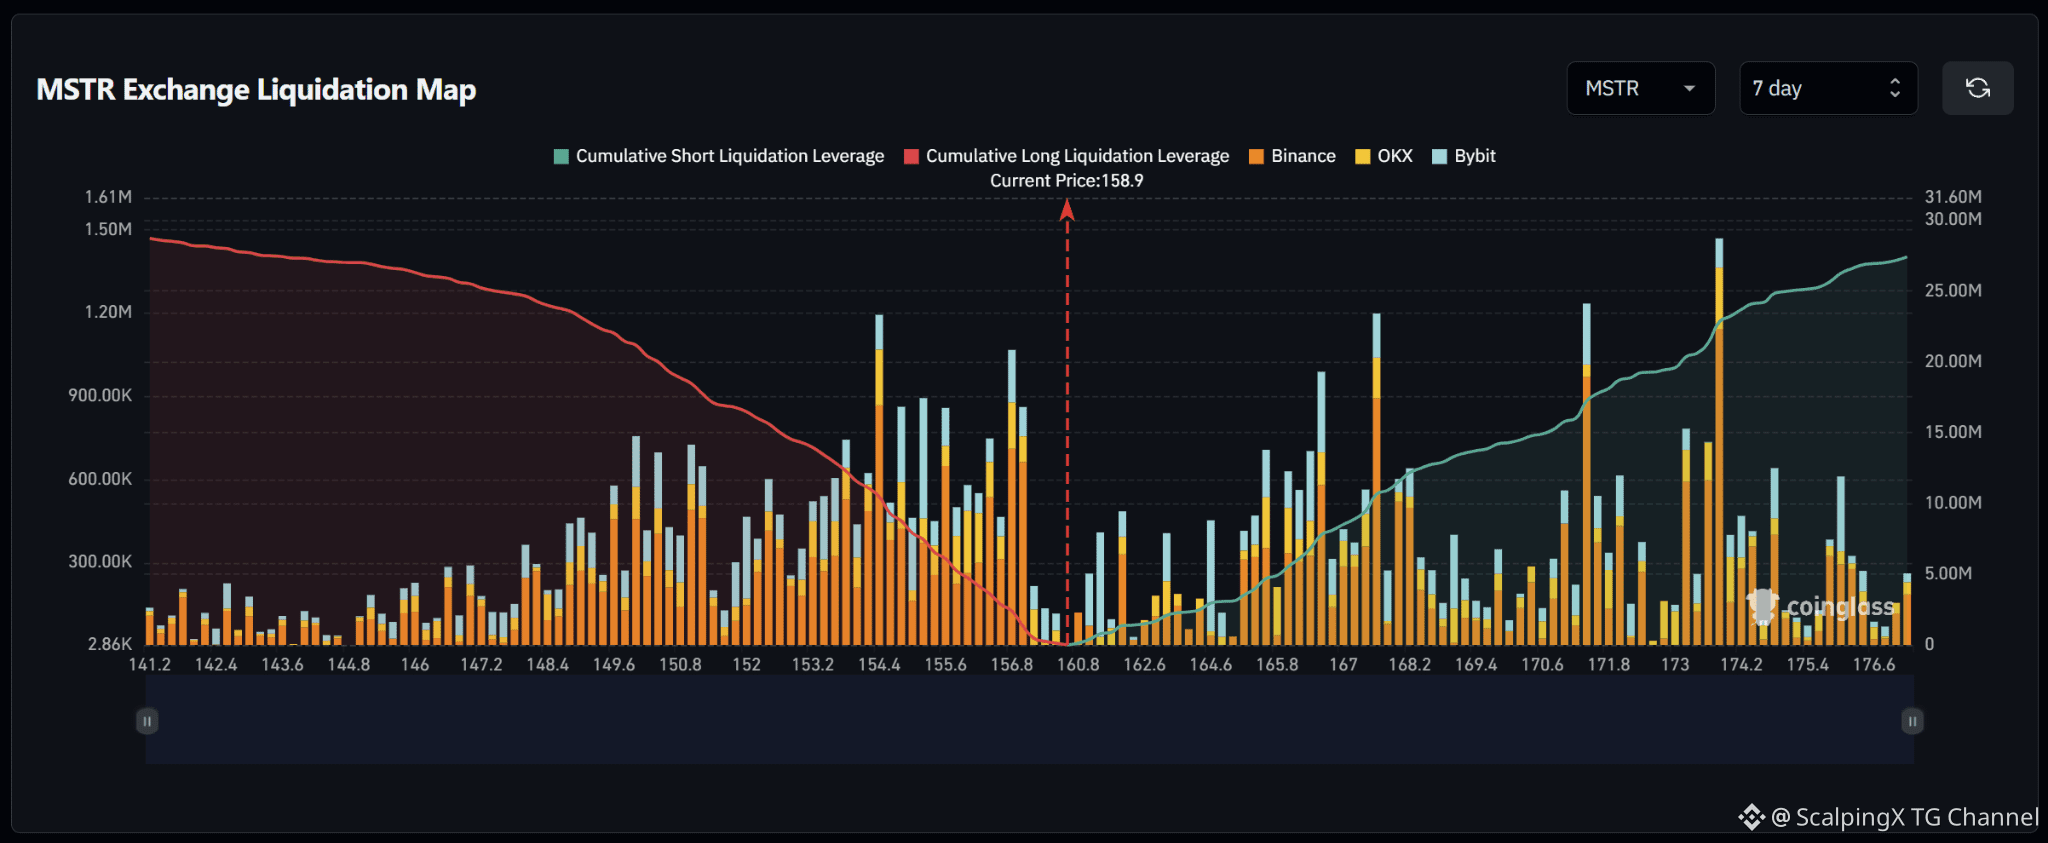
$MSTR – Liquidation Map (7 Days) – Current Price 158.9 🔎 The 7-day liquidation map shows roughly 28–29 million USD in long liquidations below the current price, slightly exceeding approximately 26–27 million USD in short liquidations above. The liquidity structure is therefore fairly balanced, with a mild downside tilt. 📉 Below the market, long-liquidation liquidity is concentrated heavily across 153–157. A major cluster sits around 154.4 with a bar close to 1.2 million USD; the 155–156 area contains several bars around 0.8–0.9 million USD, while 156.7–157.0 holds another cluster above 1 million USD. Losing 156.5 would shift attention toward 155–154 and then 152–150. 📈 Above the market, short-liquidation liquidity is distributed heavily across 165–174. Major clusters appear around 167–168 with a bar near 1.2 million USD, 171–172 with a bar above 1.2 million USD, and especially 173–174 with a bar close to 1.5 million USD. This is the most prominent liquidity zone above the market. 🧭 The broader setup is close to balanced but carries a mild downside tilt. Losing 156.5 would increase the probability of a sweep toward 155–154, followed by 152–150. Breaking above 162–164 would instead expose 167–168 and then 171–174.


Publier
Avertissement : ce contenu inclut des opinions de tiers. Il ne constitue pas un conseil. Binance Ai peut être utilisée, sans garantie de résultat. Consultez les CG.