
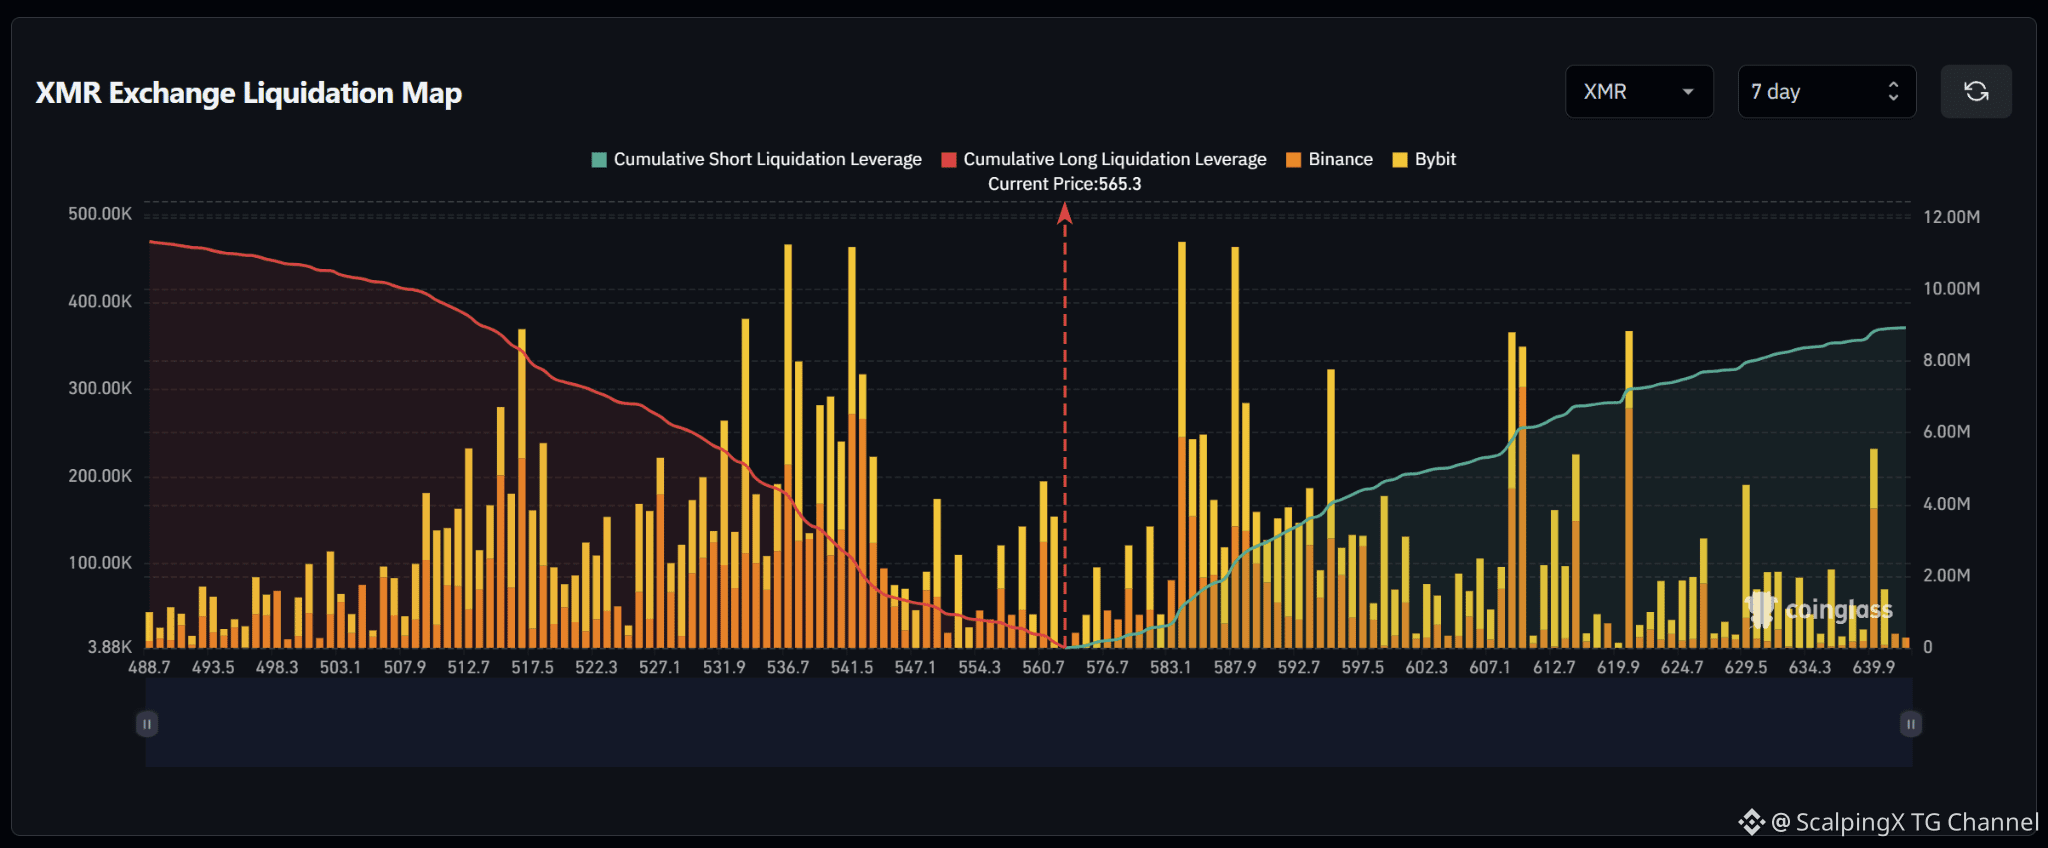
$XMR – Liquidation Map (7 Days) – Current Price 565.3 🔎 The 7-day liquidation map shows roughly 11–11.5 million USD in long liquidations below the current price, exceeding approximately 8.5–9 million USD in short liquidations above. The liquidity structure therefore has a mild downside tilt, with around 1.3 times more cumulative liquidity below the market. 📉 Below the market, long-liquidation liquidity is concentrated mainly across 512–542. The strongest clusters sit around 536–537 and 541–542 with bars near 0.46 million USD, while 516–518 and 531–533 also hold several relatively large pockets. Losing 560 would shift attention toward 547–542 and then 537–532. 📈 Above the market, short-liquidation liquidity is concentrated heavily across 582–589. The two strongest clusters sit around 583–584 and 587–588 with bars near 0.46–0.47 million USD. Further out, 608–610 and 619–620 also contain notable pockets around 0.35–0.37 million USD. 🧭 The broader setup has a mild downside tilt because long-liquidation exposure below remains larger. Losing 560 would increase the probability of a sweep toward 547–542, followed by 537–532. Breaking above 576 would instead expose 583–588 before attention shifts toward 608–620.


Publier
Avertissement : ce contenu inclut des opinions de tiers. Il ne constitue pas un conseil. Binance Ai peut être utilisée, sans garantie de résultat. Consultez les CG.