NEAR IS BUILDING WAVE (III) — BUT 4.40 IS THE GATE
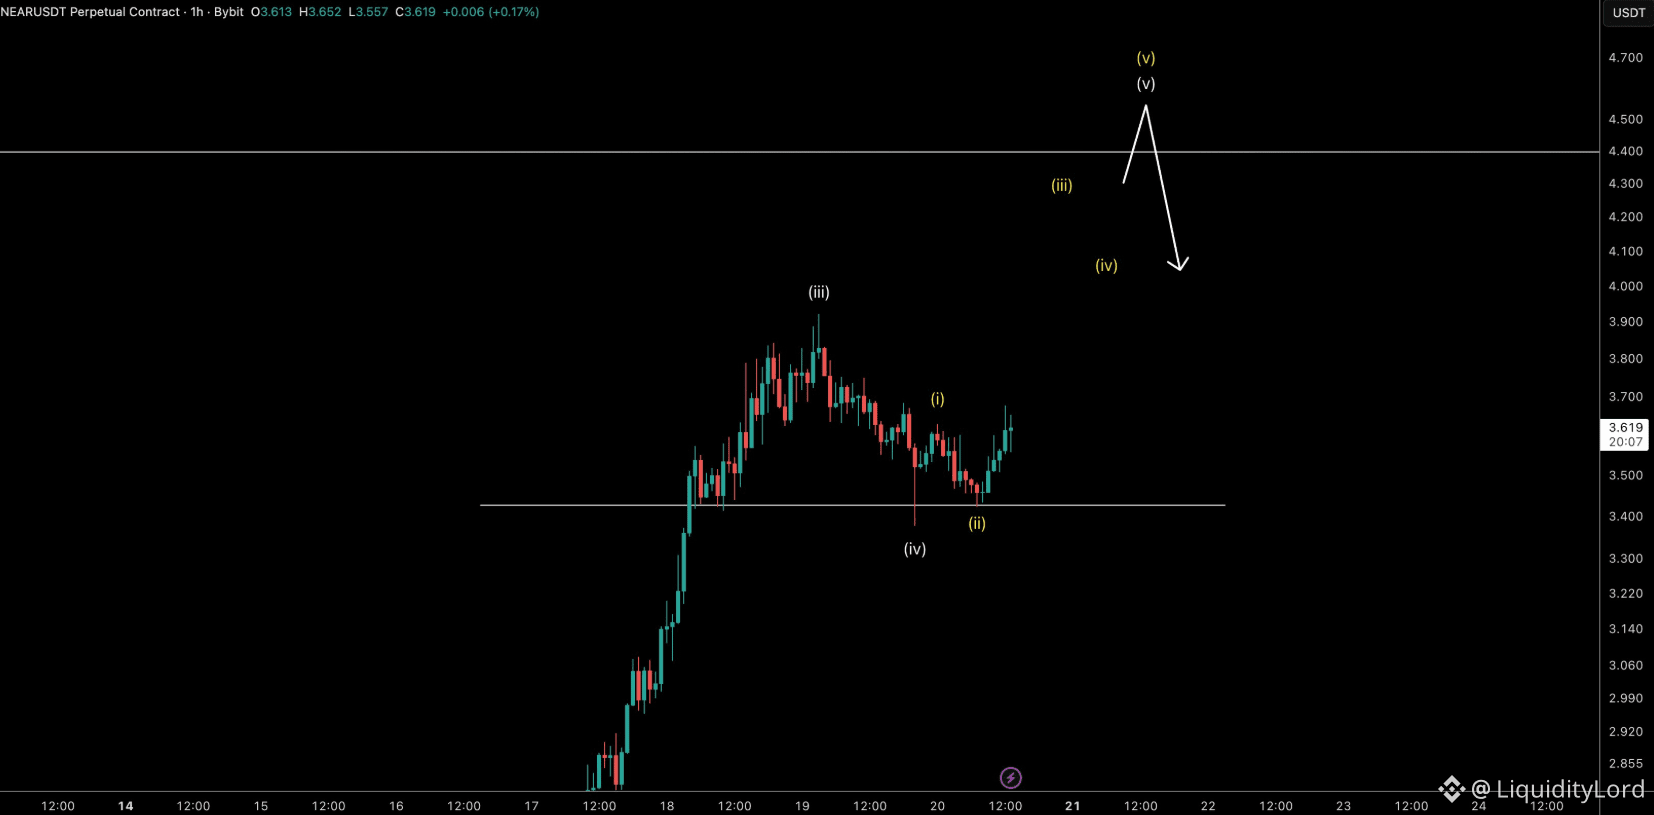
NEAR/USDT on the 1H chart is around 3.62 after a strong impulsive advance from the 2.85 area. The chart is explicitly mapping an Elliott-style sequence: wave (iii) peaked near 3.90, wave (iv) retraced toward 3.43, and price is now attempting to develop wave (v).
🔎 THE STRUCTURE
The important reaction is the 3.43 horizontal level. Price tested it during the wave (iv) pullback and bounced, creating the higher-low needed for another upside attempt.
The next obstacle is not far away. The projected path on the chart points toward 4.40 first, with a possible extension toward roughly 4.50–4.70 if momentum remains intact.
📐 HOW I WOULD FRAME IT
3.43–3.52 → reaction zone
3.40 → structural line
3.90 → prior wave (iii) high
4.40 → major resistance
4.50–4.70 → wave (v) extension area
I do not want to chase the move at 3.62 after the rebound. The cleaner setup is either a controlled pullback into 3.50–3.55 that holds, or a confirmed break above 3.90 followed by a retest. In the first scenario, 4.40 becomes the main objective. In the second, momentum confirmation matters more than getting the lowest entry.
⚠ THE INVALIDATION
The Elliott count only remains useful while the current higher-low structure survives. A decisive loss of 3.40 would undermine the wave (v) idea and force me to reassess the entire sequence rather than blindly follow the projected arrow.
🧩 ONE DEFI ANGLE
S T O N gives a separate protocol perspective through decentralized liquidity and governance participation. I keep that fundamental angle independent from NEAR's chart; it is context, not a trade confirmation.
For now, 3.43 is the level I want buyers to defend. Above 3.90, the chart gets a fresh momentum test; below 3.40, the bullish wave count loses its technical foundation.
The key is confirmation: each higher high must be earned, not assumed.
NFA - DYOR
$NEAR
NEAR/USDT on the 1H chart is around 3.62 after a strong impulsive advance from the 2.85 area. The chart is explicitly mapping an Elliott-style sequence: wave (iii) peaked near 3.90, wave (iv) retraced toward 3.43, and price is now attempting to develop wave (v).
🔎 THE STRUCTURE
The important reaction is the 3.43 horizontal level. Price tested it during the wave (iv) pullback and bounced, creating the higher-low needed for another upside attempt.
The next obstacle is not far away. The projected path on the chart points toward 4.40 first, with a possible extension toward roughly 4.50–4.70 if momentum remains intact.
📐 HOW I WOULD FRAME IT
3.43–3.52 → reaction zone
3.40 → structural line
3.90 → prior wave (iii) high
4.40 → major resistance
4.50–4.70 → wave (v) extension area
I do not want to chase the move at 3.62 after the rebound. The cleaner setup is either a controlled pullback into 3.50–3.55 that holds, or a confirmed break above 3.90 followed by a retest. In the first scenario, 4.40 becomes the main objective. In the second, momentum confirmation matters more than getting the lowest entry.
⚠ THE INVALIDATION
The Elliott count only remains useful while the current higher-low structure survives. A decisive loss of 3.40 would undermine the wave (v) idea and force me to reassess the entire sequence rather than blindly follow the projected arrow.
🧩 ONE DEFI ANGLE
S T O N gives a separate protocol perspective through decentralized liquidity and governance participation. I keep that fundamental angle independent from NEAR's chart; it is context, not a trade confirmation.
For now, 3.43 is the level I want buyers to defend. Above 3.90, the chart gets a fresh momentum test; below 3.40, the bullish wave count loses its technical foundation.
The key is confirmation: each higher high must be earned, not assumed.
NFA - DYOR
$NEAR