
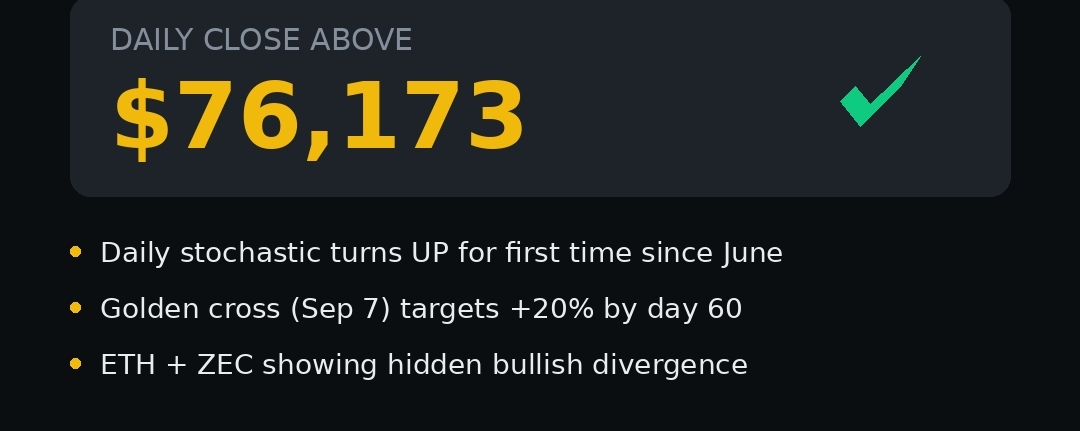

Bitcoin has homework due tonight — and the grade matters more than usual.
If BTC closes today above $76,173, a whole stack of bullish statistics lines up behind it. Miss that level, and the setup shifts, though not necessarily for the worse. Here's why this single daily close is getting so much attention right now.
The signal nobody's talking about yet
Here's the part that's easy to miss if you're only glancing at price. Dig into the momentum indicators and the daily stochastic just turned upward — for the first time since June. That's not a throwaway detail. The last two times this exact pattern showed up, it wasn't subtle. One marked the macro low at $57,750, right before things turned around. The other kicked off the run from $6,000 all the way to $67-68,000. Two for two isn't a guarantee. But it's the kind of coincidence that makes you sit up a little straighter.
At the same time, something else is happening that sounds like it should cancel all of that out: the 5-day stochastic is about to cross downward. On the surface, that reads as "uh oh." In practice, it's rarely that simple. Go back through the last decade and this exact combo — daily turning up while the 5-day turns down — has shown up eight times. Ten days later, Bitcoin was higher 61% of the time. Sixty days out, the median gain was over 6%. Not fireworks. Just quietly, statistically, in your favor.
The pullback that's supposed to happen — and why that's okay
There's also a textbook corrective setup in play right now: a short-term EMA slipping below a longer one, the kind of cross that historically drags price back down to test the green 55 EMA. This isn't a maybe. It happens 100% of the time, eventually — the only real question is when. By day five, 62% of similar setups have already made that test. By day twenty, it's climbed to 88%.
So if price dips from here, don't panic. That's not the market breaking. That's the market doing exactly what it always does.
Zoom out, and there's a bigger story: a golden cross with receipts
Pull back further and you'll find a golden cross — the 50-day moving average crossing above the 200-day — that officially triggered on September 7th, with Bitcoin sitting at $78,450. These crosses have a personality of their own: a brief dip first, then compounding gains. Historically, +3.2% by day 30, and a median +20% by day 60. Run that math against current levels and six-figure Bitcoin before year-end stops sounding like hopium. It starts looking like the base case.
And while everyone's watching BTC, the altcoins are quietly stealing the scene
Ethereum has been holding its range near $2,360, and there's hidden bullish divergence building underneath the surface. What really stands out, though, is what hasn't happened: no new lows, not once, through this entire consolidation. That kind of quiet relative strength has some traders convinced ETH could lead BTC for a stretch, with eyes on $2,500-2,600 and, further out, a real shot at $3,000+.
Then there's Zcash — the wildcard of this market cycle. A hidden bullish divergence flagged days ago has already started playing out, and a fresh higher low near $1,050 gives it a new base to build from. Fibonacci extensions point to $1,522 as the first stop, with room to run toward $1,900-2,000+ by late Q4, if the pattern holds.
So, where does that leave us?
None of this is a guarantee. Markets don't do guarantees, no matter how clean the chart looks. But line up the pieces — a fresh momentum turn, a golden cross still working through its statistical curve, and altcoins showing real relative strength — and one theme keeps surfacing: sideways-to-up into month-end, with the real move potentially building toward October and November.
Tonight's close is just the first checkpoint. Watch $76,173.