📈 AVAX/USDT — Is More Upside Possible?
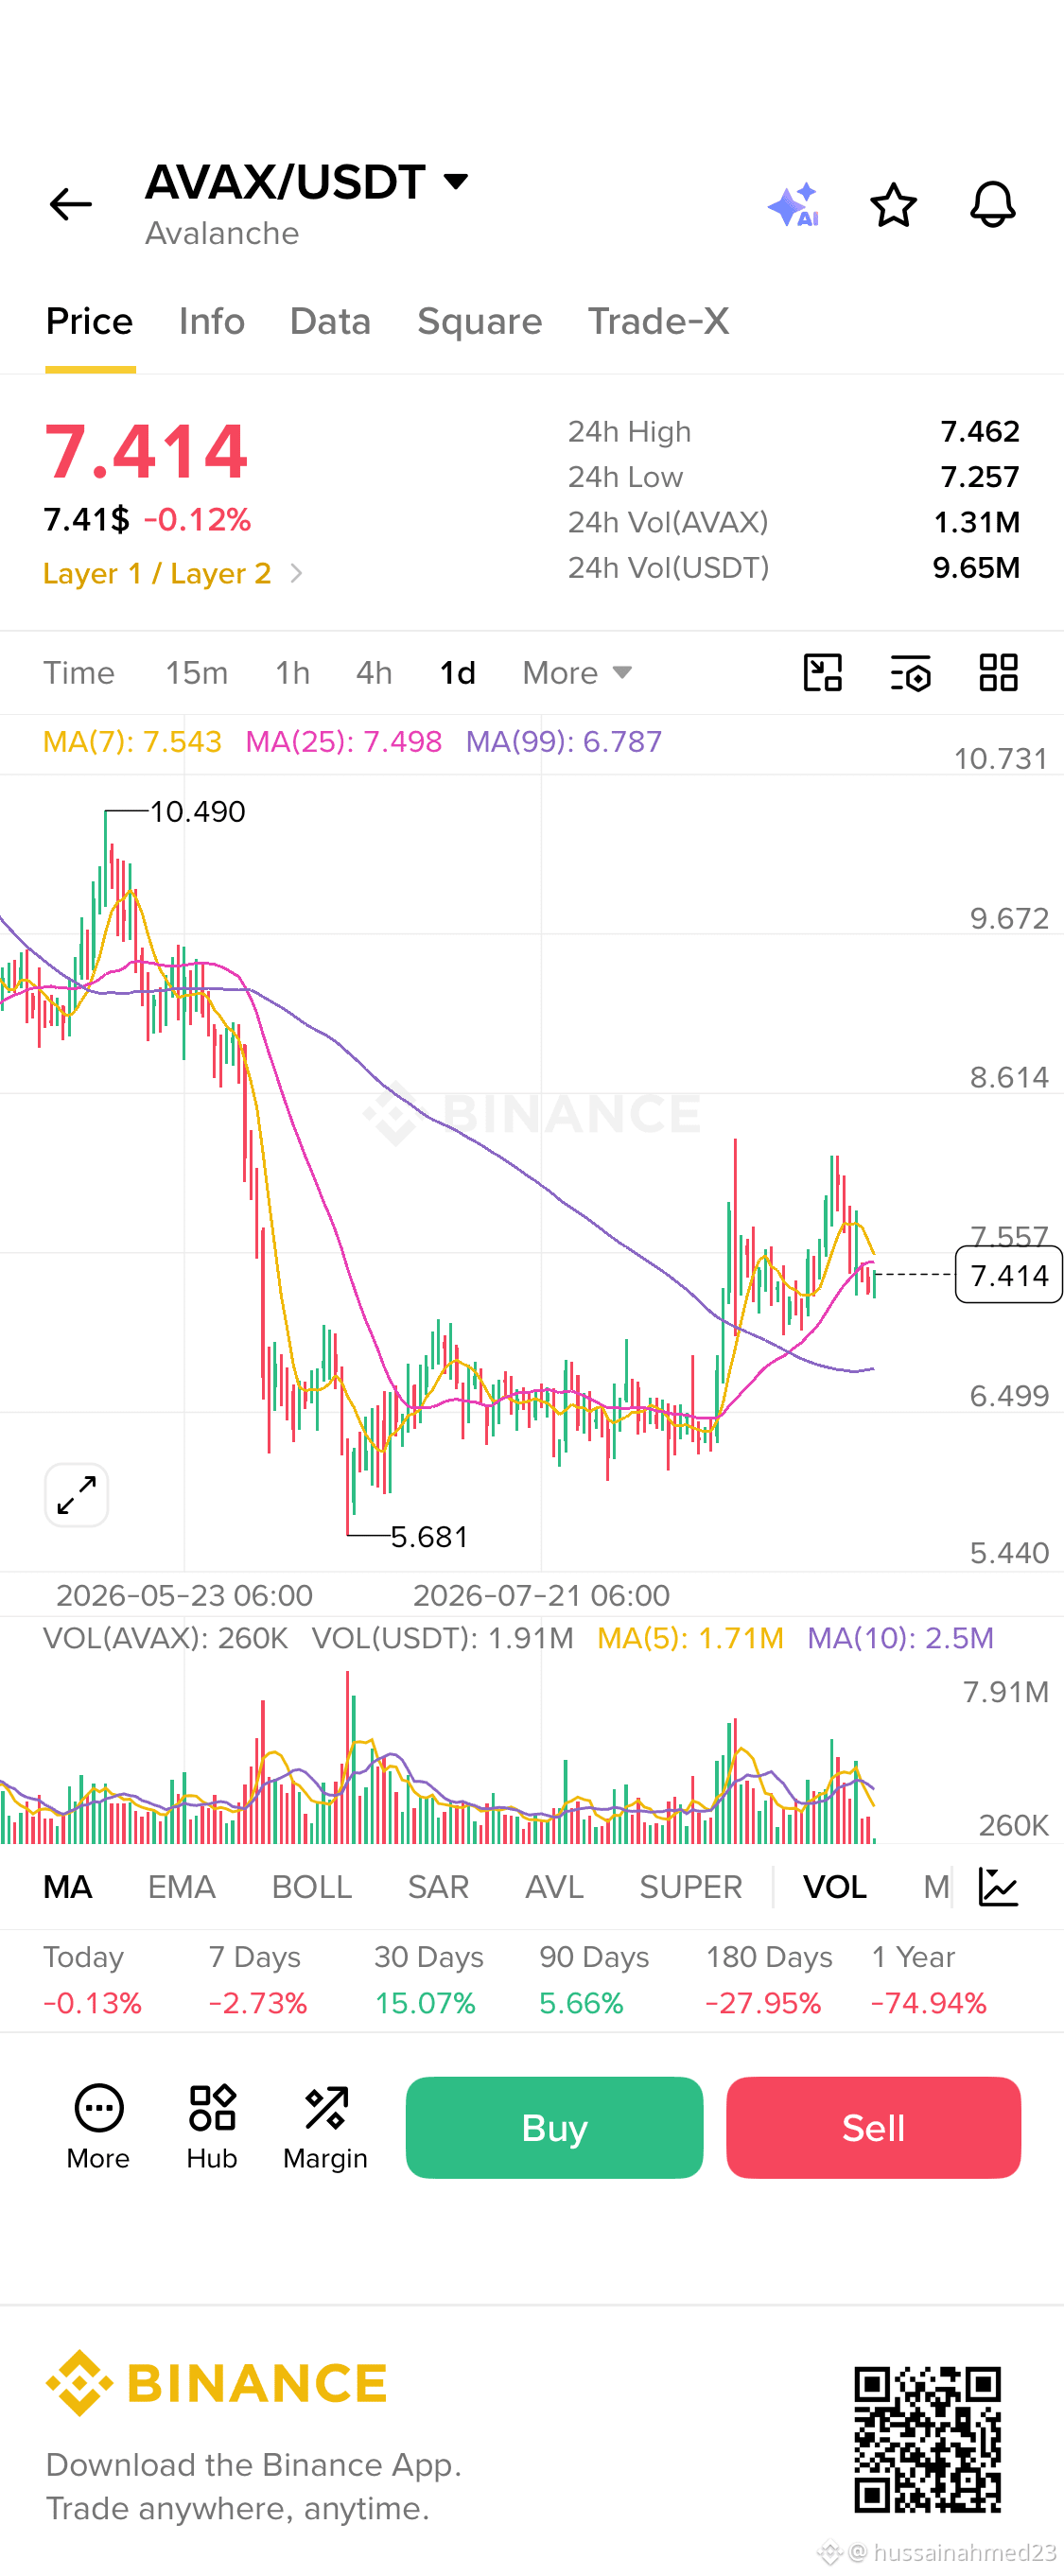
$AVAX is currently trading around 7.414 USDT. The daily chart shows a cautiously bullish recovery, but price is facing resistance near the short-term moving averages.
🟢 Bullish signs:
• MA(99): 6.787 — price remains well above it
• Recent recovery from 5.681 shows stronger buying interest
• 30D performance: +15.07%
🎯 Key Levels
🚀 Break & hold above 7.55–7.60:
Could open the way toward 8.00 → 8.60.
🟢 Support: 7.20–7.30
Holding this zone keeps the bullish structure alive.
🔴 Below 7.20:
Momentum could weaken, with a possible retest of 6.80–6.50.
Current Bias: 🟢 Cautiously Bullish
The key question: Can AVAX break 7.60 and start the next move higher? 👀🔥
⚠️ NFA. DYOR. Manage risk. Educational analysis only.
$AVAX is currently trading around 7.414 USDT. The daily chart shows a cautiously bullish recovery, but price is facing resistance near the short-term moving averages.
🟢 Bullish signs:
• MA(99): 6.787 — price remains well above it
• Recent recovery from 5.681 shows stronger buying interest
• 30D performance: +15.07%
🎯 Key Levels
🚀 Break & hold above 7.55–7.60:
Could open the way toward 8.00 → 8.60.
🟢 Support: 7.20–7.30
Holding this zone keeps the bullish structure alive.
🔴 Below 7.20:
Momentum could weaken, with a possible retest of 6.80–6.50.
Current Bias: 🟢 Cautiously Bullish
The key question: Can AVAX break 7.60 and start the next move higher? 👀🔥
⚠️ NFA. DYOR. Manage risk. Educational analysis only.