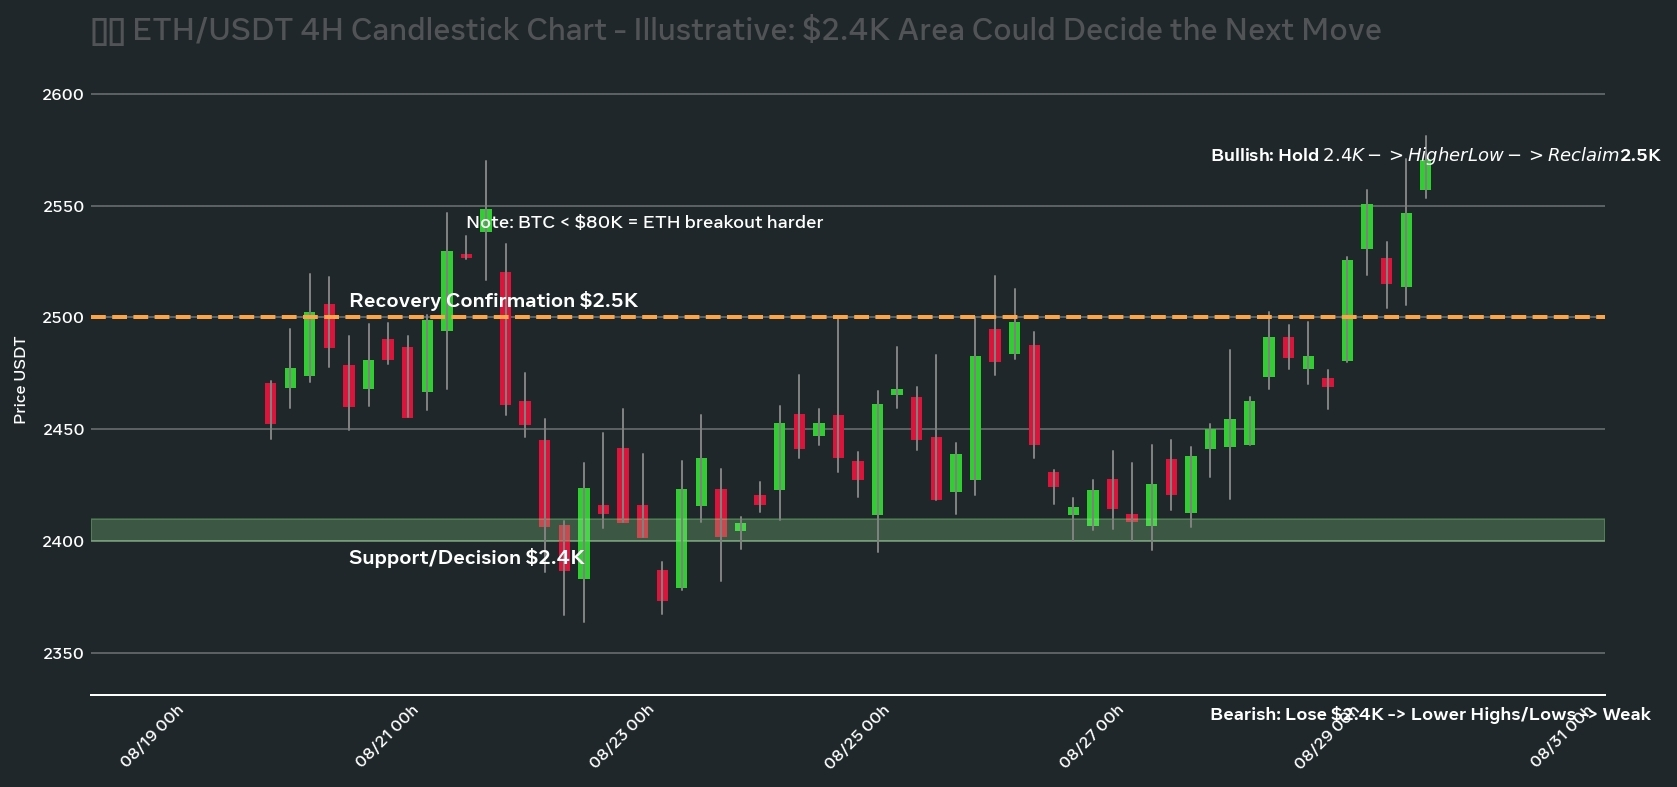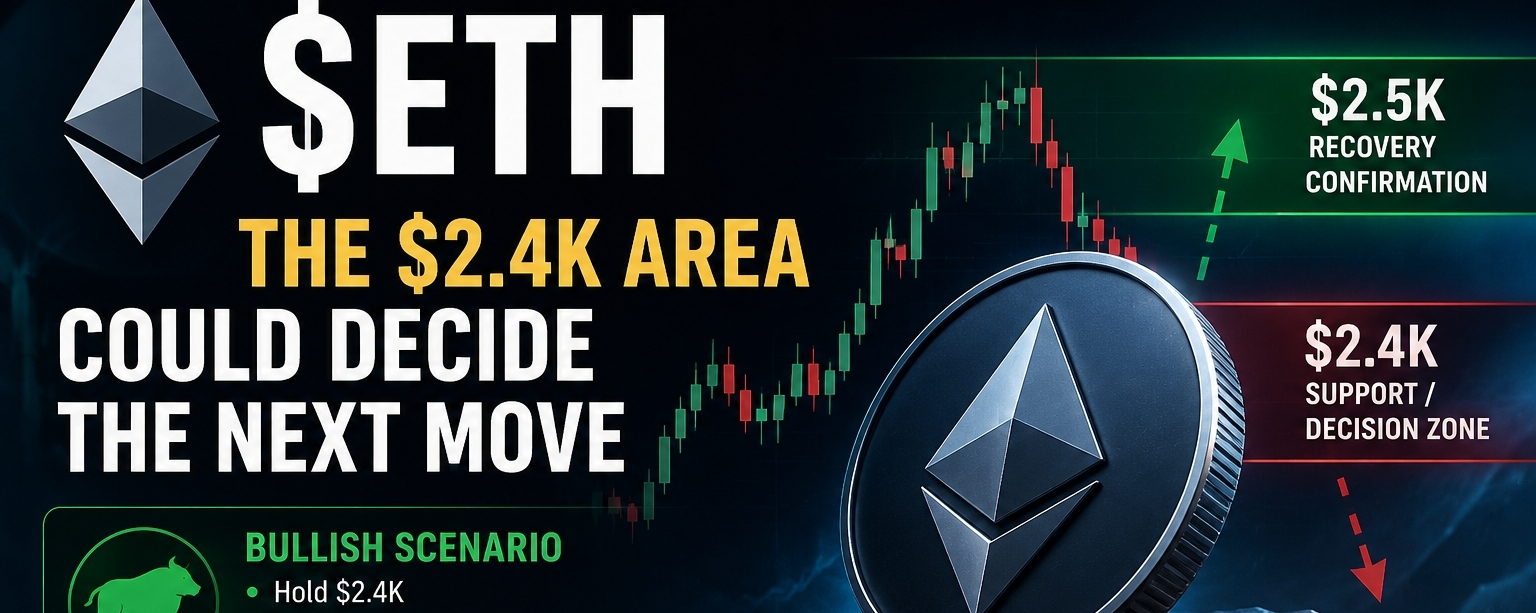

Ethereum is currently trading around the $2.4K–$2.5K region after losing some momentum from its recent recovery.
What interests me most is not the daily red candle itself.
It is how $ETH behaves around support.
The $2.4K area is important because buyers need to defend this region if they want to keep the recent recovery structure alive.
🟢 Bullish scenario:
If $ETH holds around $2.4K, creates a higher low on the 4H chart and then reclaims $2.5K, that could provide the first confirmation that buyers are returning.
A break above $2.5K with strong follow-through would make the structure more interesting.
🔴 Bearish scenario:
If $ETH loses $2.4K decisively and starts forming lower highs and lower lows, the recent bullish momentum could weaken further.
I would rather wait for a confirmed breakdown than assume that one red candle means the trend has completely changed.
📌 What I am watching:
$2.4K = support/decision zone
$2.5K = recovery confirmation
The bigger picture still depends heavily on Bitcoin.
If $BTC remains weak below $80K, Ethereum may struggle to sustain a breakout.
So I am watching $ETH independently, but I am also keeping Bitcoin's structure in mind.
No blind entries. No FOMO.
Just price action, support, resistance and confirmation.
4H candel chart,