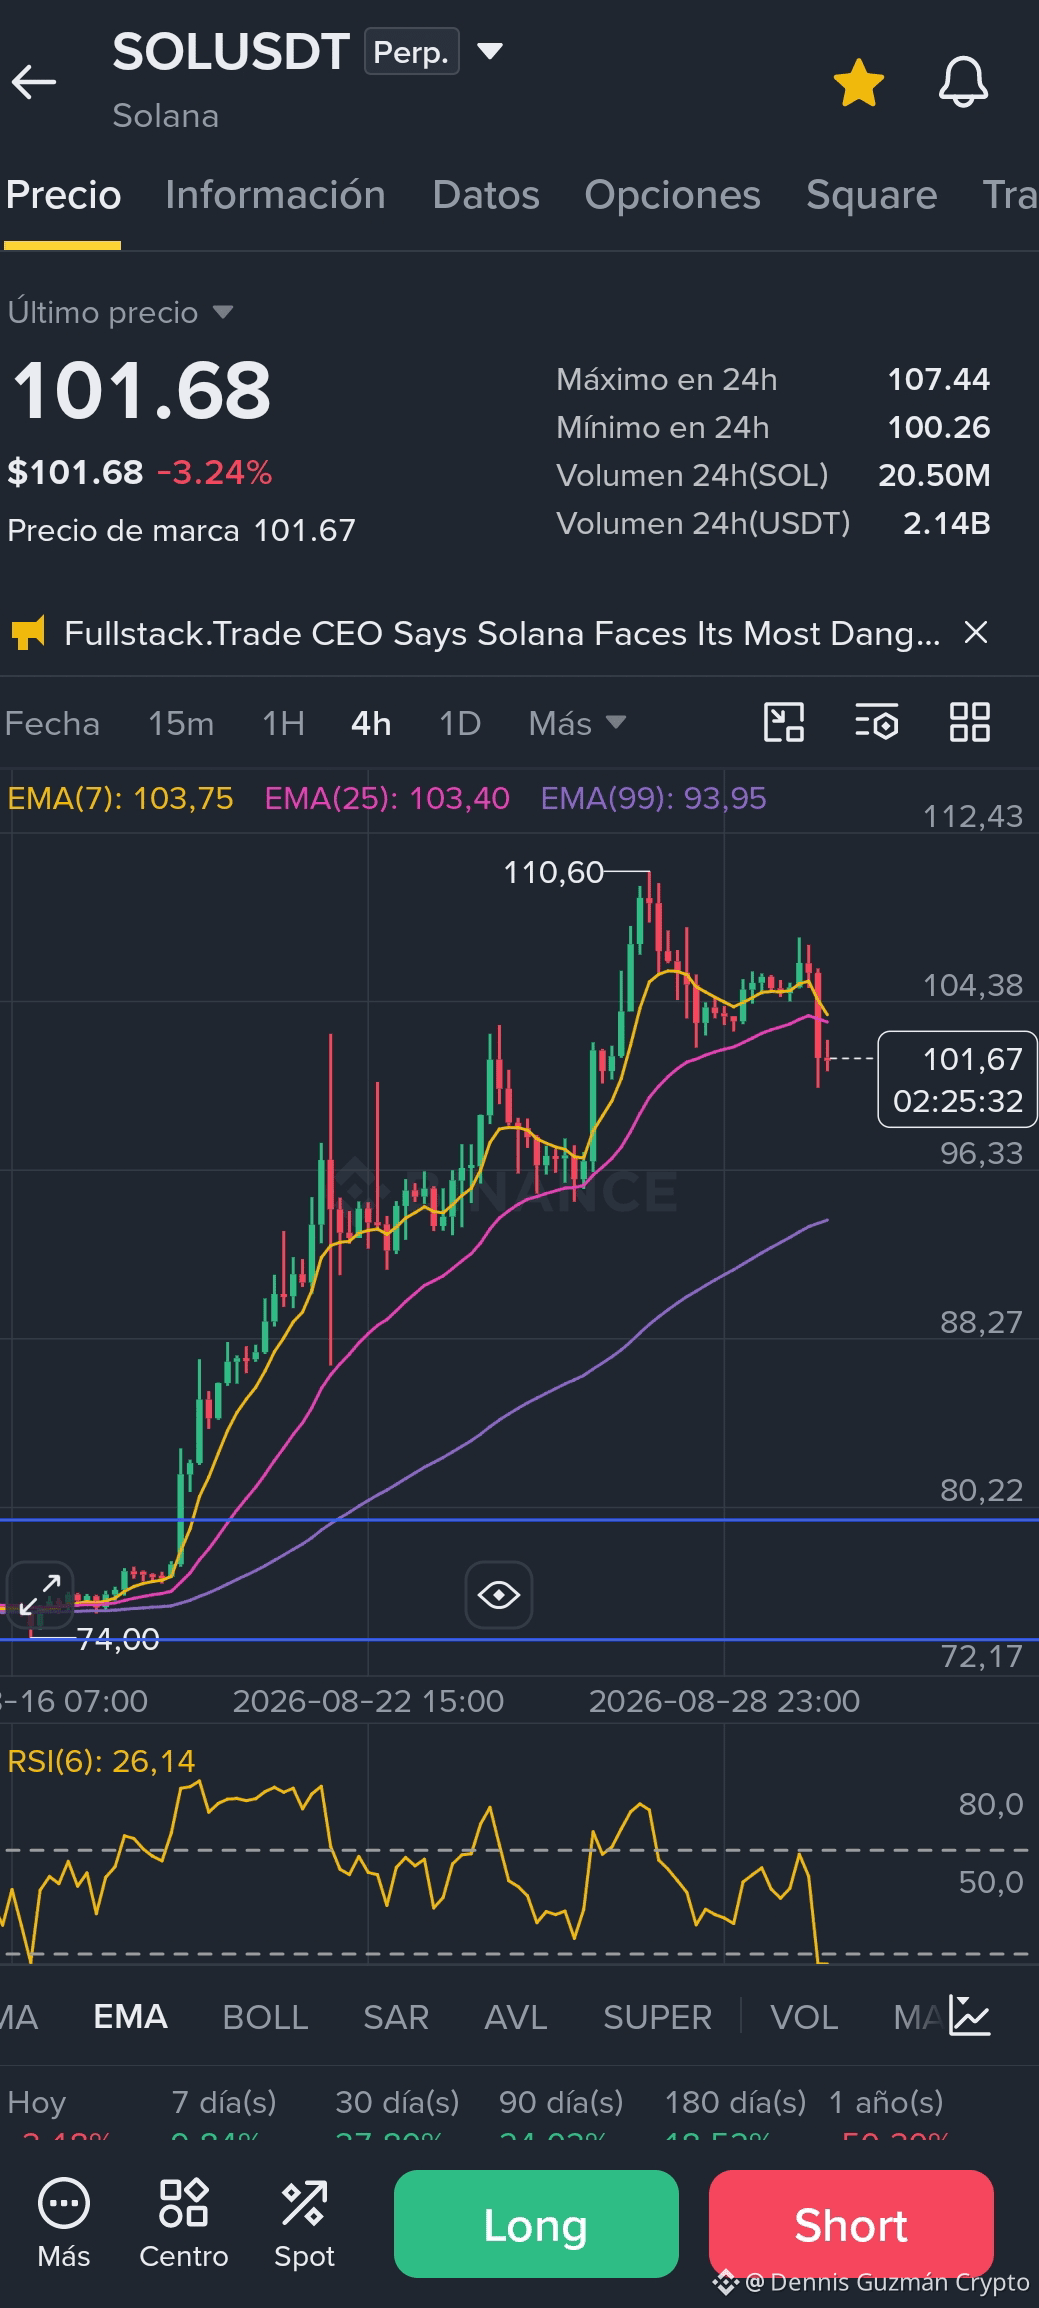
SOL is trading at 101.72 (-3.27%), retracing sharply after peaking at 110.60 in what had been a near-vertical advance from the 74.10 low. This chart is a useful case study in how fast RSI $SOL
can move: it dropped from overbought territory down to 26.05 in a short span, showing how momentum indicators can shift quickly when a parabolic rally meets profit-taking.
It's also worth noting how the EMAs — 7, 25, and 99 — had been fanning out during the uptrend, a pattern that often signals an extended, possibly overheated move, and one reason technical traders watch for this kind of separation as a sign that a pullback or consolidation phase may be approaching.
#sol #solana
can move: it dropped from overbought territory down to 26.05 in a short span, showing how momentum indicators can shift quickly when a parabolic rally meets profit-taking.
It's also worth noting how the EMAs — 7, 25, and 99 — had been fanning out during the uptrend, a pattern that often signals an extended, possibly overheated move, and one reason technical traders watch for this kind of separation as a sign that a pullback or consolidation phase may be approaching.
#sol #solana