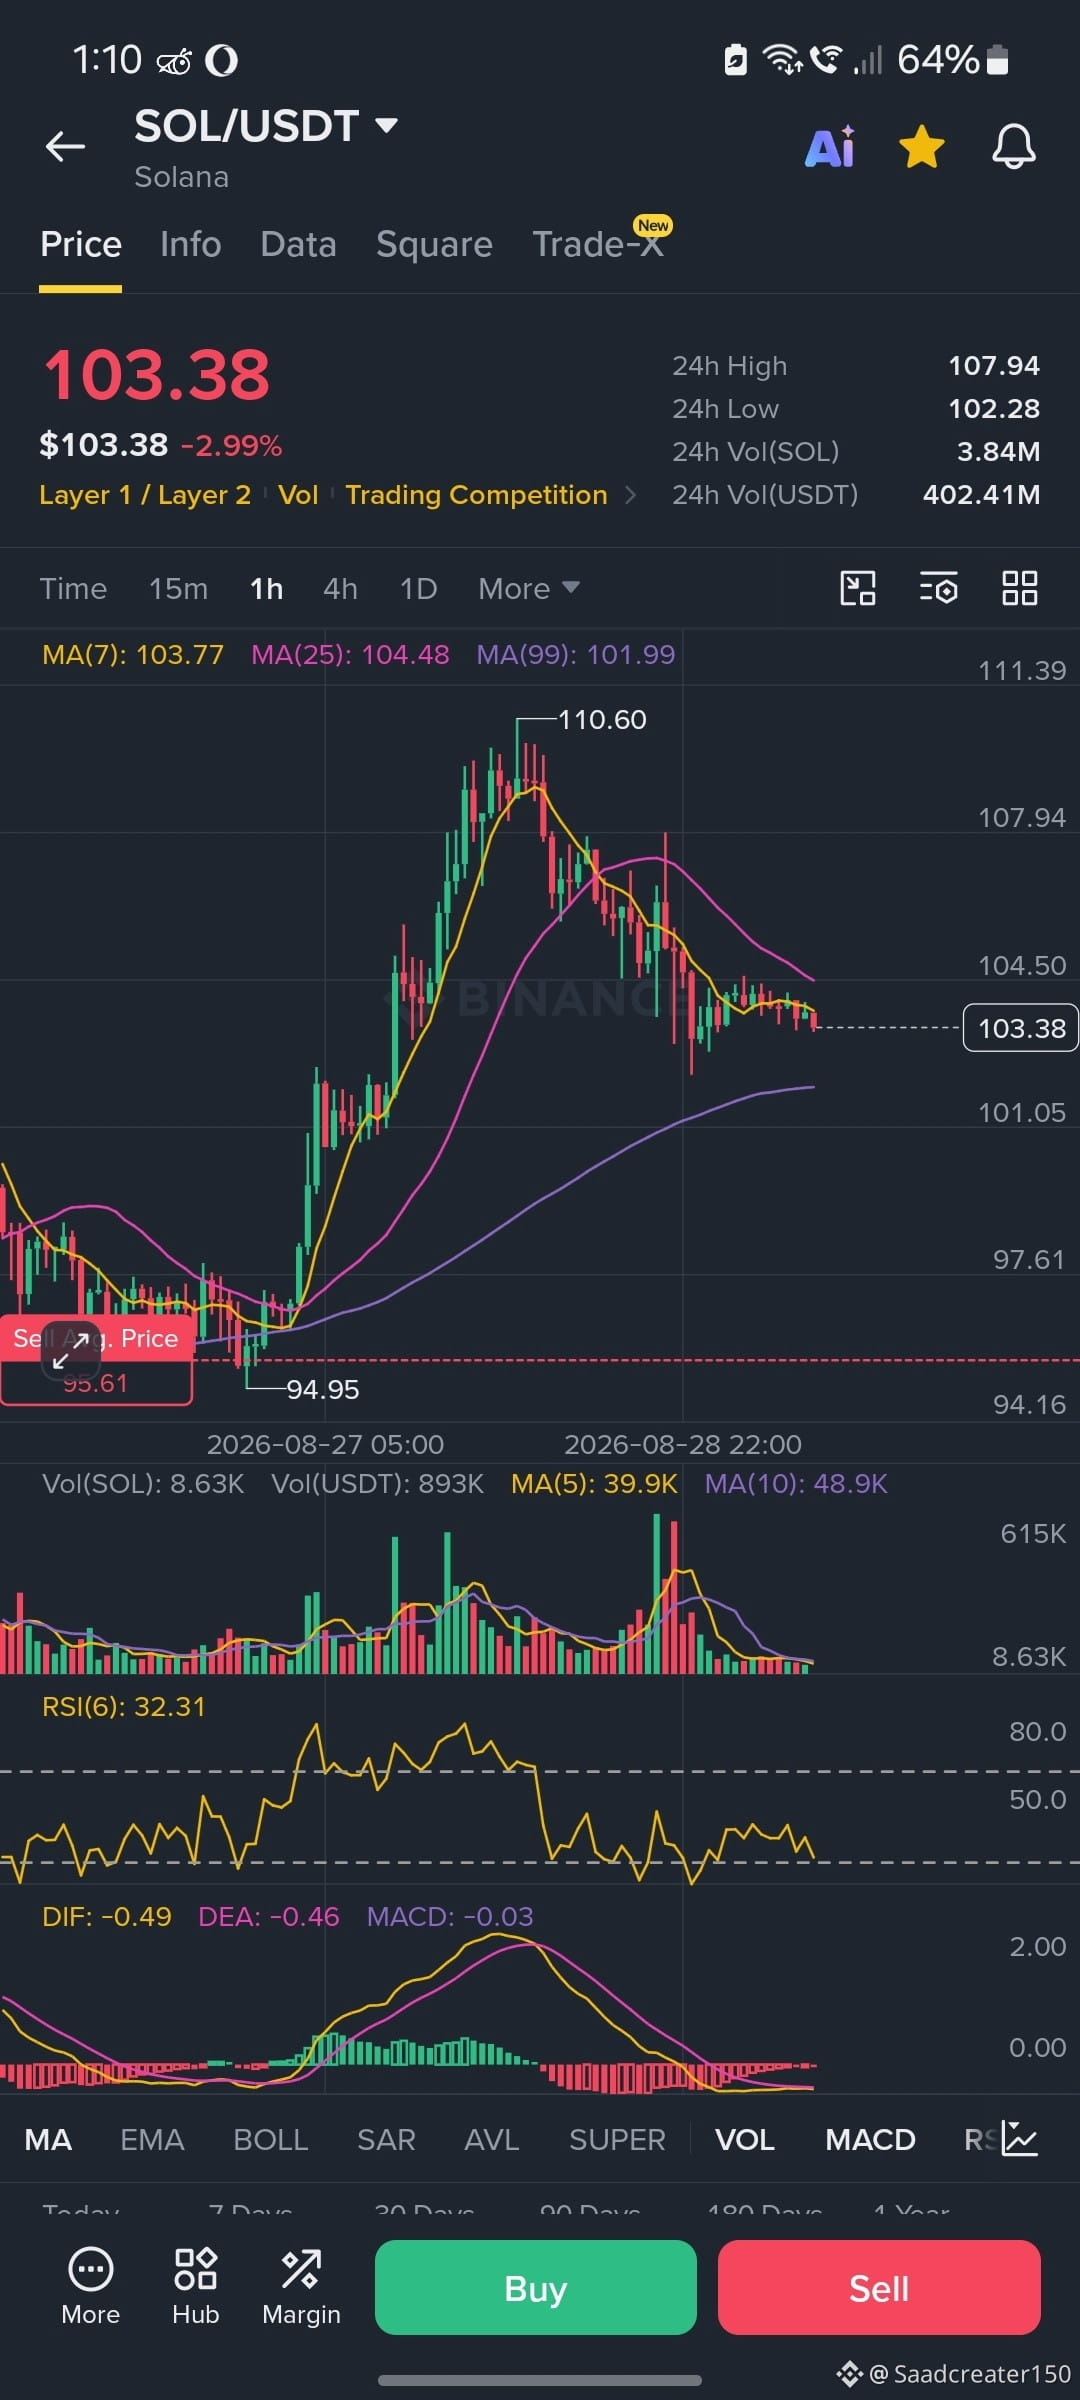
* Market Overview: SOL/USDT is undergoing a corrective pullback at $103.38 (-2.99%) on the 1-hour timeframe after rejecting from its local high of $110.60.
* Dynamic Levels: Price action is squeezed below short-term overhead resistance at the MA(7) ($103.77) and MA(25) ($104.48), heading toward key trend support at the MA(99) ($101.99).
* Momentum Indicators: The RSI(6) sits near oversold territory at 32.31, while the MACD remains below zero with active red histograms reflecting short-term bearish dominance.
* Volume Profile: Volume is declining during this downward pull, signaling that selling pressure is slowing down compared to the high volume seen on the move up to $110.60.
* Key Levels: A breakdown under the $102.00 dynamic support zone opens a drop toward $97.60, while bulls need a decisive recovery above $104.50 to regain control.
* Execution Plan: Avoid buying into falling momentum; wait for a confirmed reversal pattern near the $102.00 MA(99) bounce or a 1-hour close above $104.50 before taking long positions.
#Solana $SOL
* Dynamic Levels: Price action is squeezed below short-term overhead resistance at the MA(7) ($103.77) and MA(25) ($104.48), heading toward key trend support at the MA(99) ($101.99).
* Momentum Indicators: The RSI(6) sits near oversold territory at 32.31, while the MACD remains below zero with active red histograms reflecting short-term bearish dominance.
* Volume Profile: Volume is declining during this downward pull, signaling that selling pressure is slowing down compared to the high volume seen on the move up to $110.60.
* Key Levels: A breakdown under the $102.00 dynamic support zone opens a drop toward $97.60, while bulls need a decisive recovery above $104.50 to regain control.
* Execution Plan: Avoid buying into falling momentum; wait for a confirmed reversal pattern near the $102.00 MA(99) bounce or a 1-hour close above $104.50 before taking long positions.
#Solana $SOL