
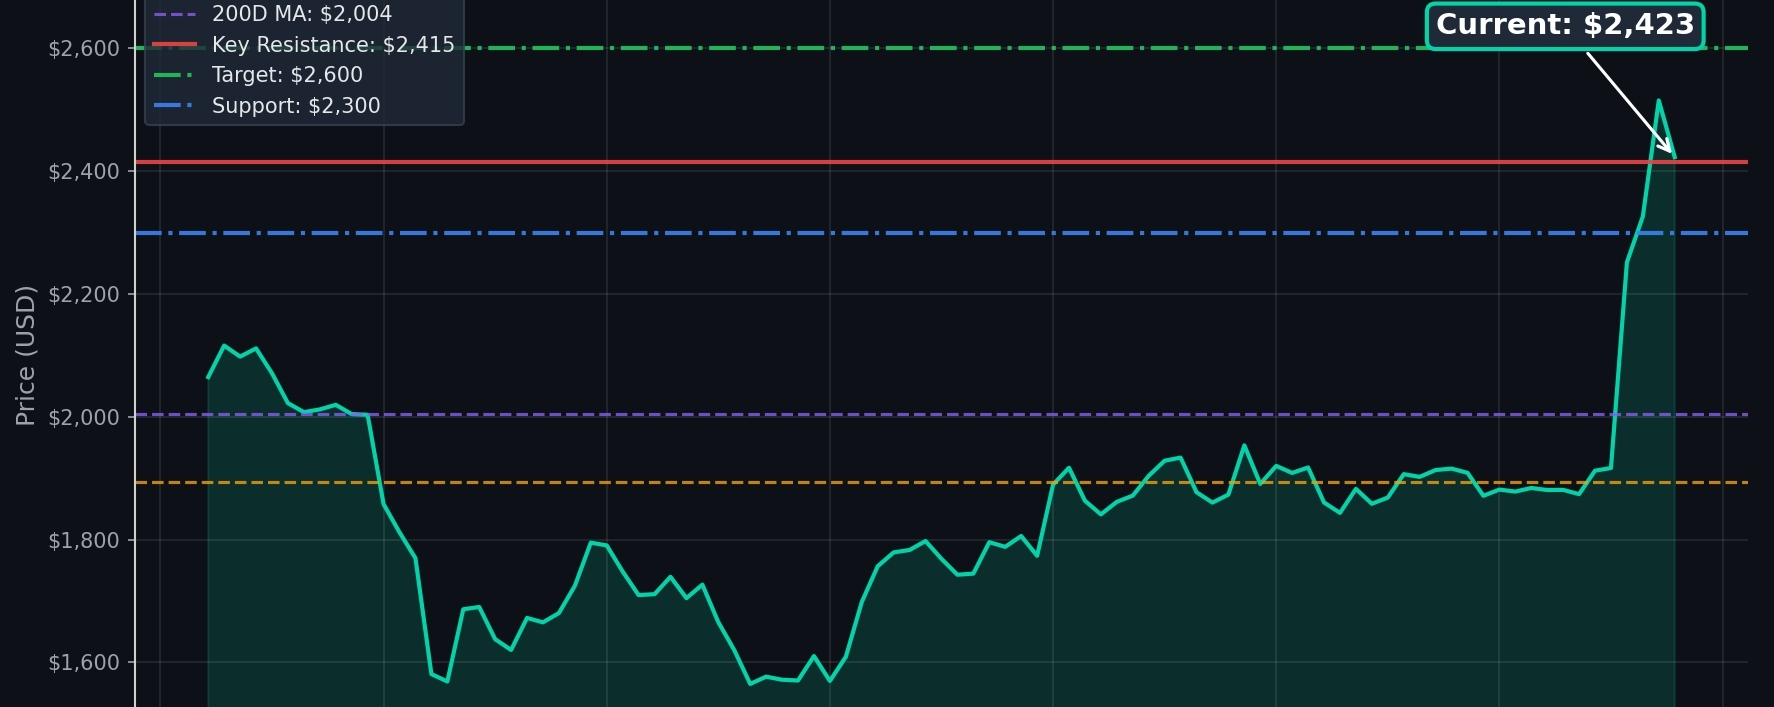

📊 $ETH /USD Technical Analysis | August 22, 2026
Current Price: $2,423 | Daily Change: −0.45%
🔑 Key Levels
Таблицы
Level
Value
Status
Key Resistance
$2,415
✅ Broken (+0.3%)
Breakout Target
$2,600
Ahead (+7.3%)
Support (dip buy)
$2,300
−5.1% from current
📈 What Happened Over 3 Months
Low: $1,507 (end of June) — right at the 52-week low
High: $2,546 (a week ago)
7-day gain: +28.8% 🚀
30-day gain: +29.1%
3-month gain: +17.4%
ETH bounced off the bottom with +60% from the yearly low, but is still −51% from the all-time high ($4,954).
📉 Moving Averages
50D MA: $1,894 — price is +28% above ✅
200D MA: $2,004 — price is +21% above ✅
Both indicators broken from below — this is a bullish signal. The medium- and long-term trends have flipped upward.
📊 Volume
24h Volume: ~$29.9B
Ratio to 10-day average: 1.93x — nearly double the norm
High volume on the rise = confirmation of buyer interest.
🎯 Scenarios
Bullish (higher probability): The 2,415 breakout has already occurred. If it holds above — the path to **2,600** is open. That's +7.3% from current levels.
Bearish: A pullback to 2,300 will give a "tasty" entry point. Below2,300 — risk of returning to $1,900 (50D MA).
💡 My Take
ETH just broke out of a 2-month range of 1,550–1,950. The breakout happened on volume — this is not a false breakout. The key question: will the price hold above 2,415? If yes — the2,600 target is quite realistic within the next 1–2 weeks.
Not financial advice. DYOR.