The provided chart is a monthly timeframe (1M) Bitcoin price chart on Binance (BTC/USDT), highlighting historical cycles with annotations for key bottoms and a peak. It compares the current price action around ~$66,000 to the 2022 bear market structure, suggesting Bitcoin is "fully copying" that period. The poster predicts the final bottom in the next 45–60 days, with whales already accumulating for a chance to buy low.
Current Bitcoin Market Snapshot
As of mid-February 2026, Bitcoin is trading around $66,000–$67,000 USD, down significantly from its all-time high of approximately $126,000 (reached in late 2025). Recent 24-hour changes show declines of 1.8–3% amid broader market pressure, with trading volume remaining high.
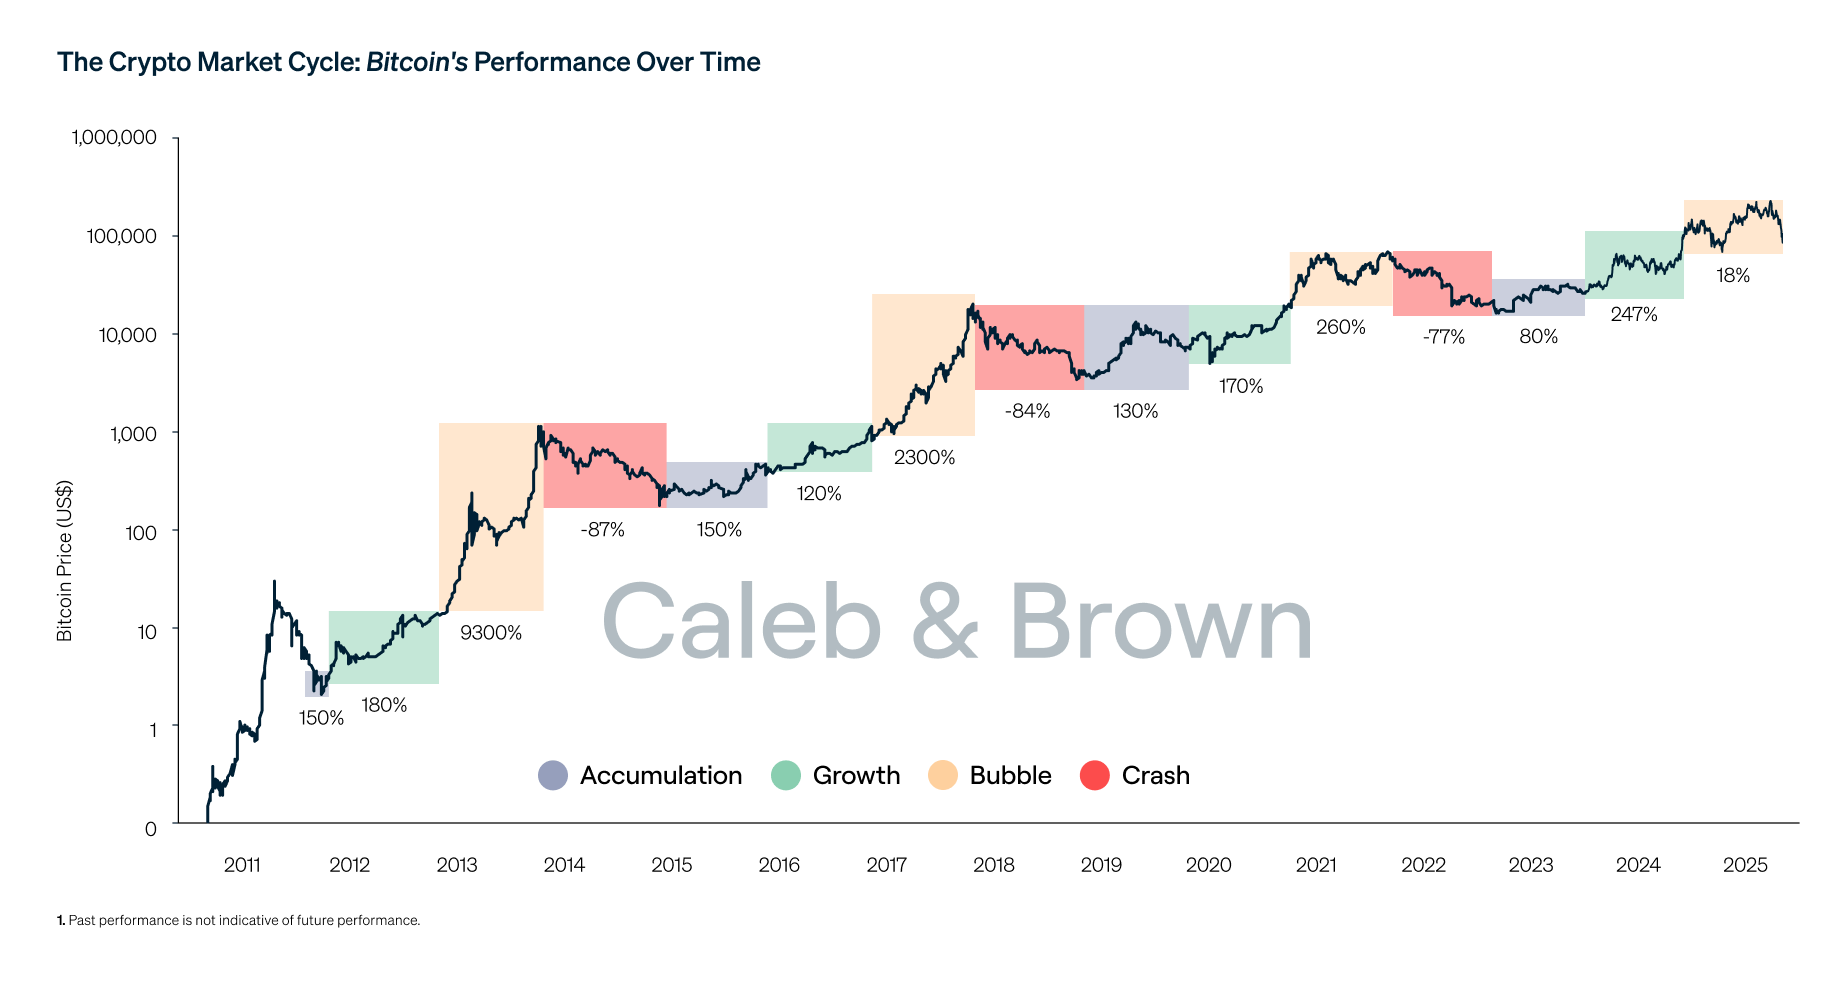
Bitcoin's Market Cycle & Crypto Cycles Chart | Key Insights & Trends
This long-term cycle chart illustrates Bitcoin's historical performance through accumulation, growth, bubble, and crash phases, showing repeated patterns of sharp corrections followed by recoveries.
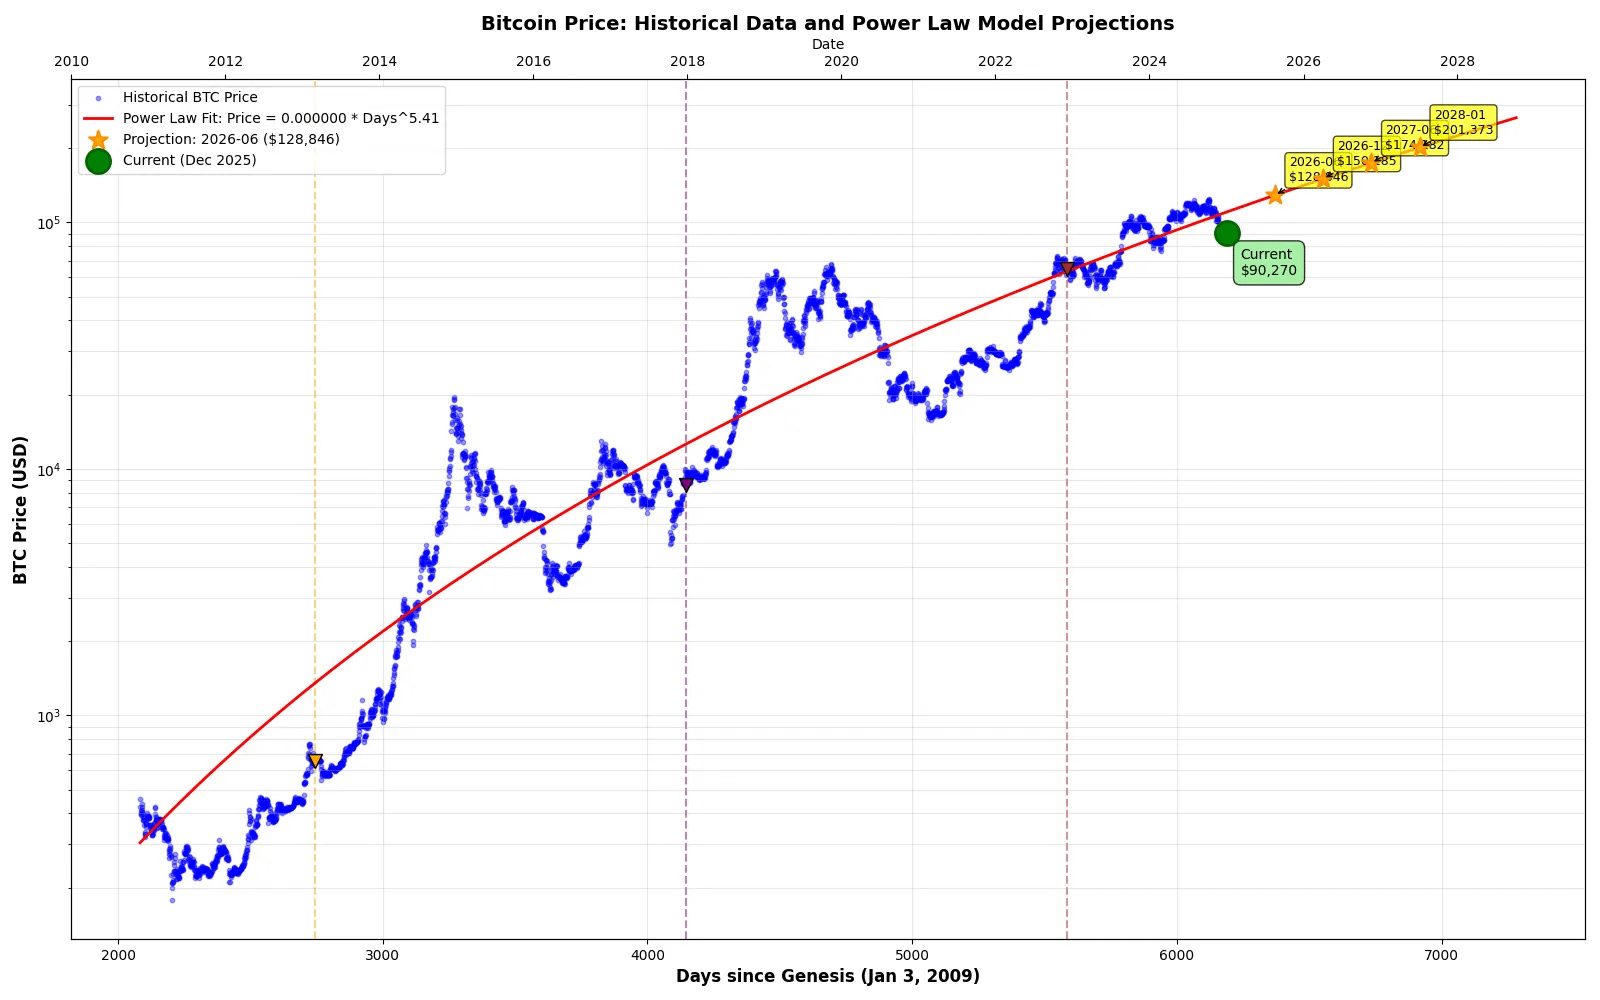
Bitcoin Cycles: A data-driven overview of halving events and price dynamic
A power law model projection for Bitcoin's price, based on historical data, suggests potential growth trajectories into 2026–2028, though current levels are below some longer-term fits.
Analyzing the Claim: Mirroring the 2022 Bear Market
The 2022 bear market saw Bitcoin drop from a peak of ~$69,000 (November 2021) to a bottom around $15,500–$16,000 (late 2022), a roughly 77% decline amid macro factors like rate hikes and crypto-specific events (e.g., FTX collapse).
The chart draws parallels:
A prior peak labeled ~$69k.
A "2022 $BTC BOTTOM" at ~$19.7k.
Current action showing a step-down pattern similar to post-peak consolidation.
Projection of a "2026 $BTC BOTTOM" after further downside.
Recent analyses note similarities in indicators (e.g., Mayer Multiple hitting 2022 levels, profitable supply dropping to ~50% like 2022 bottoms). Some analysts have eyed potential lows near $58,000–$60,000 as structural support (e.g., 200-week moving average zone), though deeper drops to $40,000–$50,000 have been discussed in bearish repeats.
However, the market is not identical—post-2024 halving dynamics, institutional adoption (e.g., ETFs), and different macro conditions (e.g., potential policy shifts) add variables. The post's 45–60 day bottom timeline would point to a possible low in March–April 2026.
Whale Accumulation Evidence
The post claims whales are accumulating. On-chain data supports this in recent periods, with "shark" entities (100–1,000+ BTC holders) showing net positive position changes and record or near-record holdings in some cohorts during dips. Larger whales (>1,000 BTC) have demonstrated accumulation vs. retail distribution in 60-day windows.
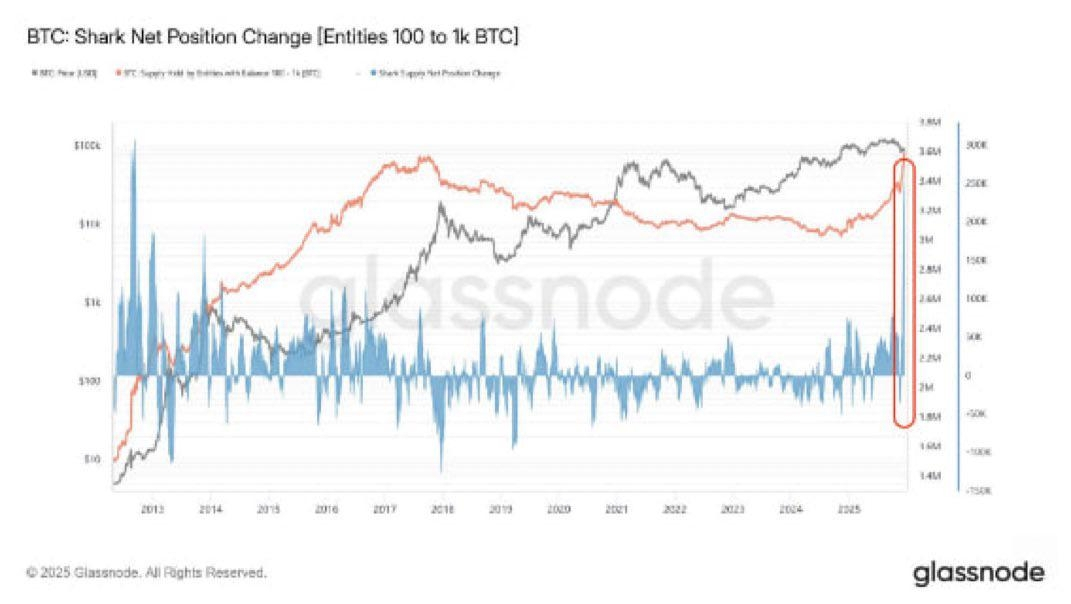
RECORD WHALE ACCUMULATION 🐳 : r/Bitcoin
This chart highlights shark net position changes, showing recent upward accumulation spikes.
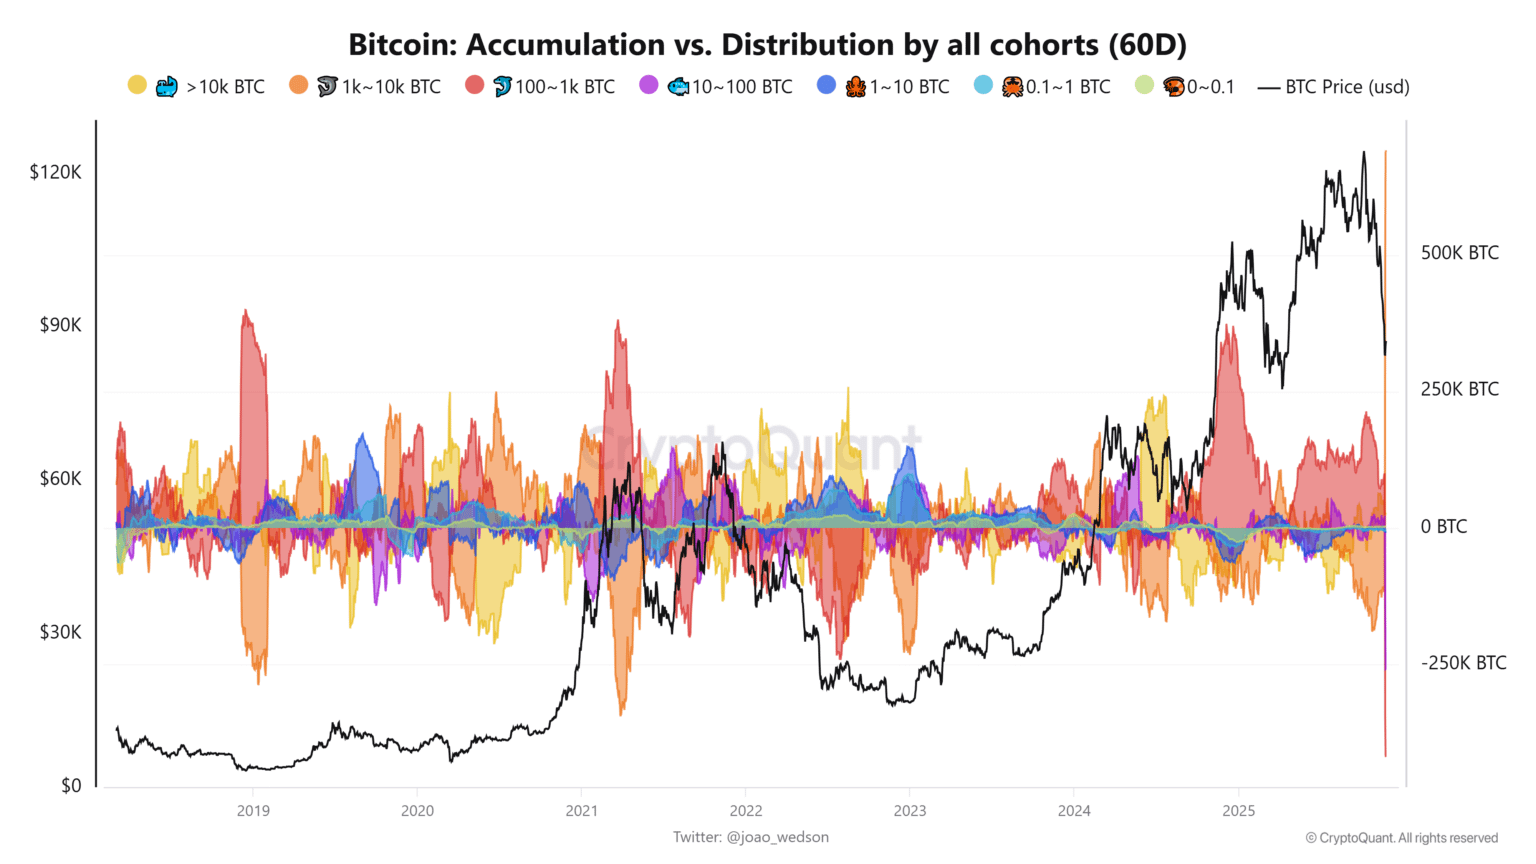
Bitcoin whale bets $2B on market bounce as smart money accumulates
Accumulation vs. distribution across cohorts, with larger holders (e.g., >10k BTC) net buying during recent price weakness.
2026 Outlook and Predictions
Predictions for Bitcoin in 2026 vary widely:
Conservative: $75,000–$150,000 range, with some centering around $110,000.
Optimistic: Up to $175,000–$250,000, driven by institutional inflows and adoption.
Longer-term models: Some forecast averages around $80,000–$100,000+ by year-end, assuming recovery post-correction.
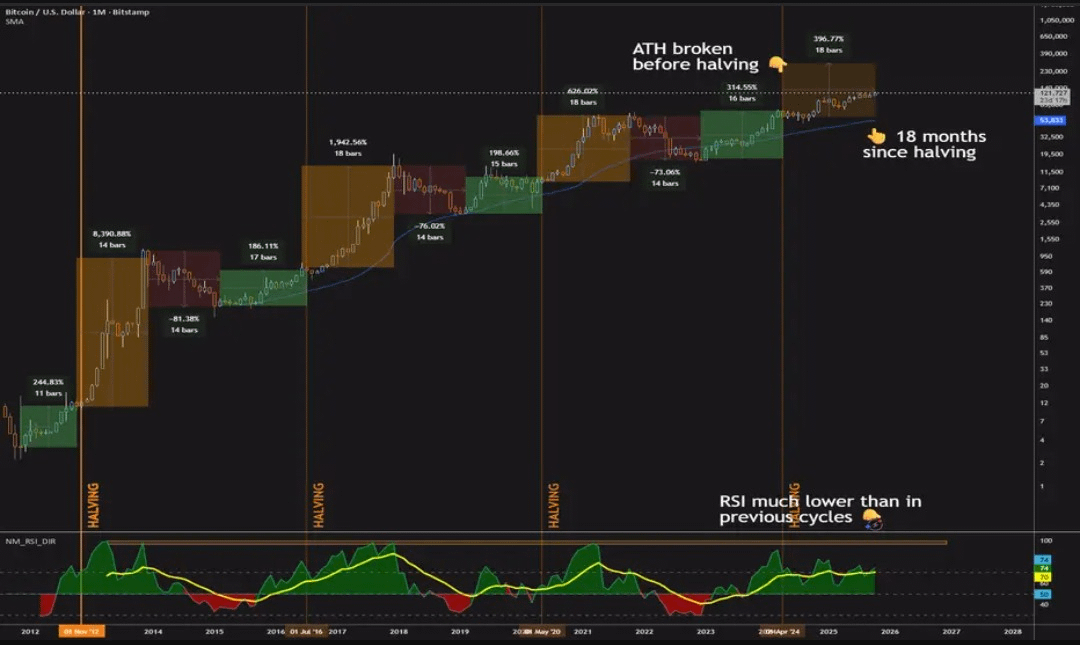
Is Bitcoin's 4-Year Cycle Over? for BITSTAMP:BTCUSD by Profit_Through_Patience — TradingView
A cycle comparison chart showing Bitcoin's performance post-halvings, with RSI and moving average signals indicating potential shifts in momentum.
The chart's bearish parallel is plausible for short-term downside risk, but historical cycles often feature deep corrections before multi-year uptrends. Accumulation by large holders during weakness has preceded recoveries in past bears. Always DYOR—crypto markets are volatile, and no prediction is guaranteed. Turn on notifications if following such updates!
