$AXS
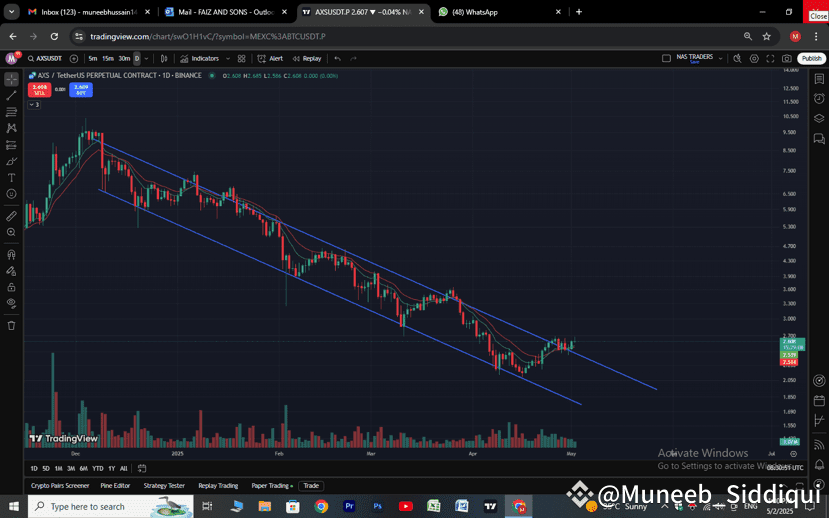
AXS has successfully broken out of a falling wedge pattern on the daily chart — a bullish reversal signal. Price is currently at $2.643 with initial momentum gaining above key resistance.
🔸 Key Support Zone at $2.55:
The $2.55 level is now acting as solid support after the breakout. This level must hold to maintain bullish momentum.
🔸 Upside Target: $9.50 – $10.00
Post-breakout projections indicate a potential upside towards $10 if volume continues to support the move.
🔸 Risk Level at $2.30:
A breakdown below $2.30 would invalidate the bullish scenario and put the price back in a bearish structure.
🔸 Action Plan:
Look for a retest of the breakout zone around $2.55–$2.60 as a potential long entry. Monitor volume and candle structure for confirmation. Mid-term targets lie around $4.00, $6.00, and $10.00.
AXS has successfully broken out of a falling wedge pattern on the daily chart — a bullish reversal signal. Price is currently at $2.643 with initial momentum gaining above key resistance.
🔸 Key Support Zone at $2.55:
The $2.55 level is now acting as solid support after the breakout. This level must hold to maintain bullish momentum.
🔸 Upside Target: $9.50 – $10.00
Post-breakout projections indicate a potential upside towards $10 if volume continues to support the move.
🔸 Risk Level at $2.30:
A breakdown below $2.30 would invalidate the bullish scenario and put the price back in a bearish structure.
🔸 Action Plan:
Look for a retest of the breakout zone around $2.55–$2.60 as a potential long entry. Monitor volume and candle structure for confirmation. Mid-term targets lie around $4.00, $6.00, and $10.00.